
Abstract
BACKGROUNDS:
Colorectal cancer is the third most common cancer in economically developed countries. Molecular studies and, in particular, gene expression have contributed to advances in the diagnosis and treatment of many cancers. Genes can be molecular and therapeutic markers, but because of the large molecular diversity in colorectal cancer the knowledge is not yet fully established. Probably one of the most crucial processes during early cancer development is inflammation. The inflammatory response in the tumor is an important indicator of molecular etiology and later of cancer progression.
OBJECTIVE:
The aim of this work is to identify potential biomarkers for early stage of colorectal adenocarcinoma in patients’ bowel tissues using transcriptomic analysis.
METHODS:
Expression of the inflammatory response genes of colorectal cancer at all clinical stages (I–IV) and control of the bowel were evaluated by oligonucleotide microarrays.
RESULTS:
Based on statistical analysis many differentially expressed genes were selected. LCK (LCK Proto-Oncogene, Src Family Tyrosine Kinase), GNLY (granulysin), SLC6A6 (Solute-Carrier Family 6 Member 6) and LAMP2 (Lysosomal Associated Membrane Protein 2) were specific for the early stage of the disease. These genes had the properties of the good biomarkers.
CONCLUSIONS:
The expression of LCK, GNLY, SLC6A6 and LAMP2 genes could be valuable potential diagnostic biomarkers of the early stage of colorectal adenocarcinoma.
Introduction
Colorectal cancer (CRC) ranks third among all the cancers in the United States. A downward trend continues for both sexes, however still new cases are diagnosed every year among younger people [33]. There are similar epidemiological trends in Poland, since 1980 there has been an increasing number of new diagnoses, a 4-fold increase for males and for females about a 3-fold increase. Malignant tumours in the colon are responsible for more than 12% of cancer mortality [40]. The most commonly diagnosed CRC is adenocarcinoma. In spite of better and more accessible screening methods, it is most commonly recognized in advanced clinical stages. Current tests for the early detection of colorectal cancer do not give the expected results [15]. A lower risk for bowel cancer is visible for people taking non-steroidal anti-inflammatory drugs or who drink green tea, thus confirming the role of inflammatory mediators in this disease [32, 34].
Inflammatory mediators may create a microenvironment that promotes growth, cell migration and neoangiogenesis [29]. Oxidative stress in such cells and the presence of the tumour necrosis factor (TNF-
This study is a part of the comprehensive subject of the CRC inflammatory microenvironment. It seems that this topic has been extensively developed, as currently evidenced by many review papers on the subject. Many sets of genes which may have significant meaning as diagnostic, prognostic or therapeutic factors have been stated in colorectal cancer. But, it is not enough, due to the molecular differences between subtypes of CRC. Many more studies are at the clinical trial stage and are not yet evaluated. Looking at the current knowledge on the topic and the continuous searching of new molecules playing a key role in the inflammatory response pathway (not limited to cancer), we have attempted to identify the biomarkers of early stage CRC which are differentially expressed compared to the control tissues. The results from oligonucleotide microarrays for the query – “inflammatory response pathway” based on the three sets of genes available in three bioinformatics databases were compared. The aim of our work was to identify genes that differentiate colorectal cancer from the microscopically healthy gut tissues (both unaccompanied by other diseases or therapies) in the inflammatory response pathway that characterizes its microenvironment. It is very important to find early markers of this disease that could provide unequivocal diagnostic information, but that could also be therapeutic targets. Thus, the selected-genes will be examined for their suitability as diagnostic markers and/or therapeutic targets in colorectal cancer patients.
Materials and methods
The material consisted of CRC and healthy colon tissue samples from 84 patients aged 51–86 years who
Self-Organizing Map of the investigated CRC samples and fragment of examined genes. (Explanations: CC – control colon; CSI – clinical stage I of CRC, CSII – clinical stage II of CRC, CSIII – clinical stage III of CRC, CSIV – clinical stage IV of CRC; colours in the heat map show the intensities of gene expression).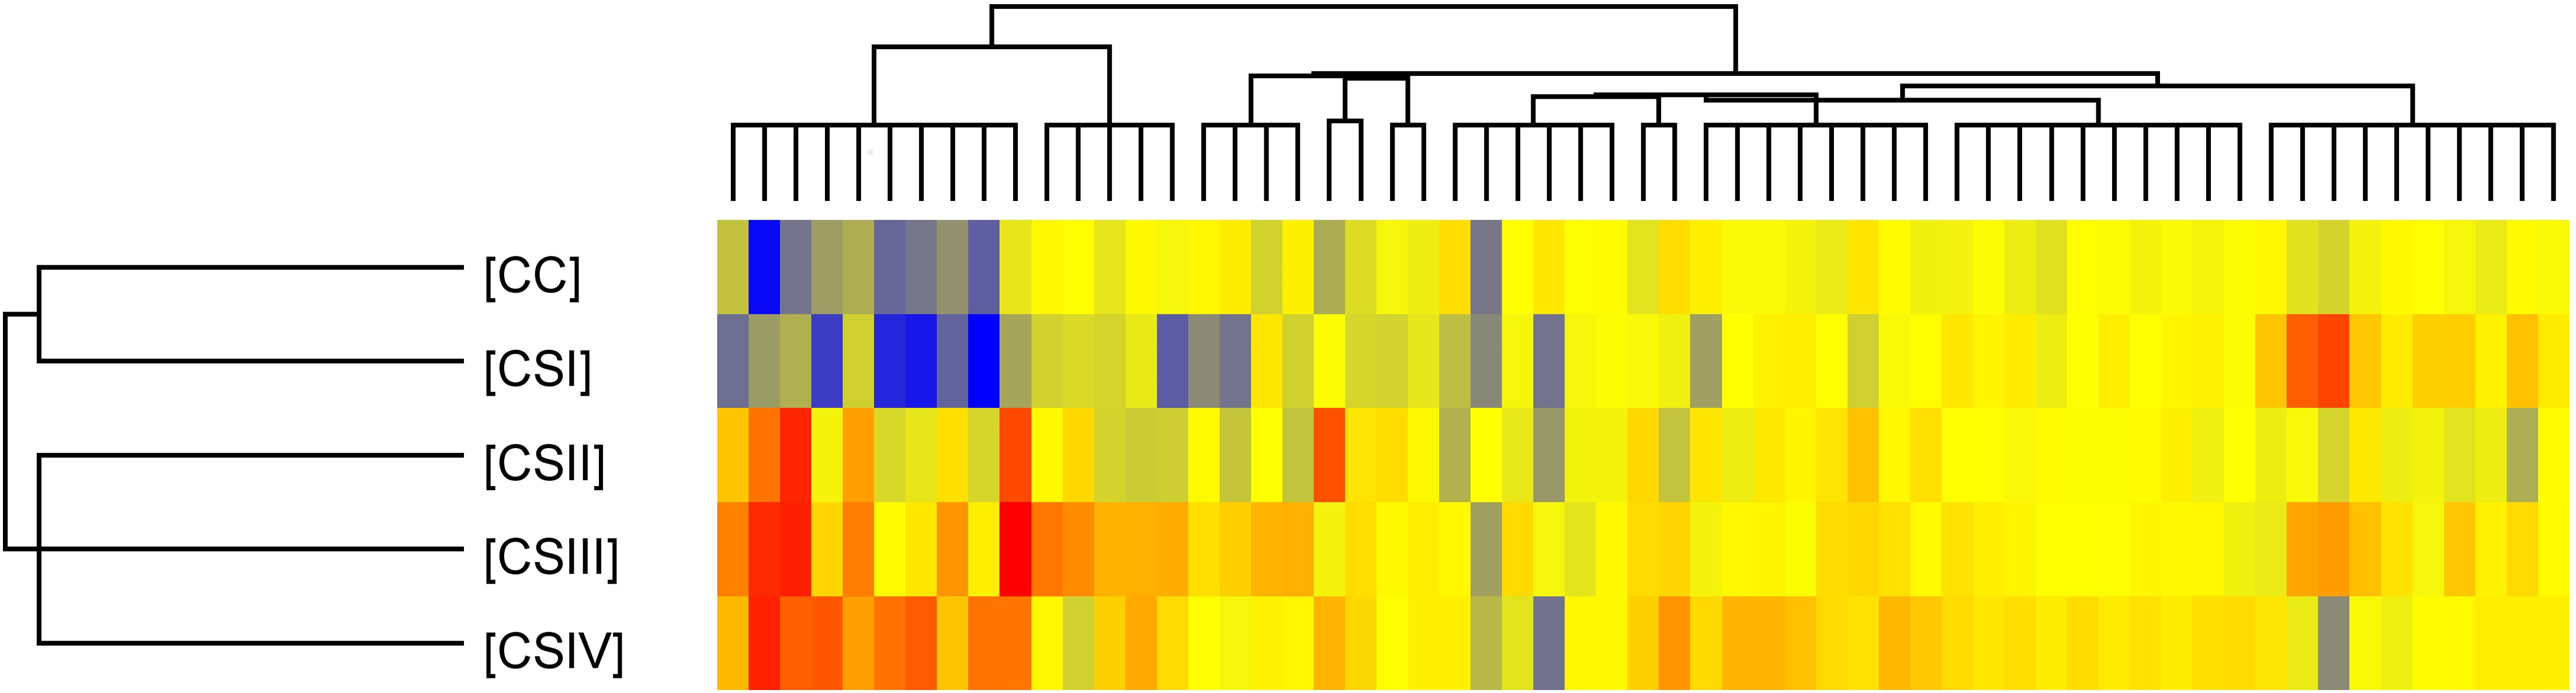
Number of significant mRNAs in ANOVA test and Tukey post hoc test with Benjamini-Hochberg correction of inflammatory response pathway in different stage of CRC tissues
Explanation: Three panels of mRNAs: (A) based on GeneCard database (additionally presented SuperPath of 30 genes related to 59 mRNAs) and (B) – based on NCBI Gene database, and (C) – based on Affymetrix database; CRC (colorectal cancer) in fourth clinical stages (CS) and control colon (CC) tissues; ANOVA – one-way analysis of variance;
The criteria for exclusion from the study group included patients: diagnosed with a form of cancer other than CRC, with unclear histological confirmation of CRC, re-operated on due to the underlying disease, with genetic, metabolic or systemic conditions (as obesity, hyperlipidaemia, hyperglycaemia), after previous radio- and/or chemotherapy and undergoing or after hormone replacement therapy completed within the 5 years prior to the operation. The criteria for inclusion were CRC in histopathological assessments of tumour material obtained in the colonoscopies and post-surgery of patients in all stages of disease undergoing elective classical surgical procedures. The criteria for inclusion and exclusion found 37 study cases (18 CRCs and 19 controls), which come only from the Silesia area of Poland. Taking into consideration of the 7
The frozen postoperative control colon (CC) and CRC samples at different stage (CSI–CSIV) were homogenized. Total RNA was extracted using TRIzol
Microarray performance
Gene expression profiles were performed using an
The plate obtained from this process was scanned using GeneChip Scanner 3000 7G (Affymetrix). The data was processed for fluorescence signal values using the Affymetrix GeneChip Command Console Software (Affymetrix). Analysis of the 22,283 mRNA was performed and the degradation index of RNA was assessed using a 3’/5’ ratio (signal intensity ratio of the 3’ probe set over the 5’ probe set) of the GAPDH and ACTB (housekeeping genes probes: AFFXBioB_at, AFFXBioC_at, AFFXBioDn_at, AFFXCreX_at,AFFXr2EcBioB_at, AFFXr2EcBioC_at, AFFXr2EcBioD_at, AFFXr2P1cre_at). Then, the followingmRNA panels of probes (August 2017) in the “inflammatory response pathway” query: of 5376 sequences (3381 genes) and 59 mRNA (representing 30 genes) of SuperPath, signed in the GeneCards
Comparison the Venn diagrams results of differentially expressed genes (DEGs; Tukey post hoc,
0.05 and
2.0
FC
2.0) of fourth clinical stages (CS) of the CRC tissues compared to colon control (CC)
Comparison the Venn diagrams results of differentially expressed genes (DEGs; Tukey post hoc,
Explanation: The results from panels of 5376 (A) and 2598 (B), and 740 mRNAs (C) associated to term “inflammatory response pathway” in GeneCards and NCBI and Affymetrix database, respectively.
Differentially expressed genes associated with the inflammatory response pathway (5376 mRNAs) with significant changes in the early stage of CRC
Explanations: ID – number identified probe on HG-U133A chip; FDR – false discovery rate;
List of significant biological processes in inflammatory response pathway (panel A; 874 significant mRNAs in the CRC, 
Venn diagrams of differentially expressed genes in the CRC. (Explanations: DEGs involved in the inflammatory response pathway at four clinical stages (CS) of the CRC tissues compared to control colon (CC) in the results of 5376 (A) and 2598 (B), and 740 mRNAs (C) belonging to GeneCards and NCBI and NetAffx database, respectively).
Normalized intensities of distinguished gene expression: LCK (A), GLNY (B), SLC6A6 (C), LAMP2 (D). (Explanations: Expression of genes are presented as normalized values, mean and standard error; whiskers show the 95% confidence interval).
Statistical analysis of the obtained data was performed using Statistica 12 software (StatSoft), Excel 2006 (Microsoft) and GeneSpring 13.0 software (Agilent Technologies). Values of 22,283 fluorescence signals of mRNA for the each HG-U133A chip were normalized using the RMA (Robust Multichip Average) method. Microarray quality control tests were carried out. The Shapiro-Wilk test was used to check the normality of the data distribution in selected panels of genes. Similarities and differences between samples were checked by the Self Organizing Map (SOM). Differentially expressed genes (DEGs) were determined using a one-way ANOVA test with asymptotic computation of
Results
To obtain normally distributed data the fluorescence signals were log-transformed. The similarities and differences between all 5 samples groups (CC, CSI, CSII, CSIII and CSIV) and genes were shown by implementing a SOM (Self Organising Map), the results can be seen in Fig. 1. A grouping algorithm was applied to both the tissues and the genes, revealing coherent patterns that suggest a high degree of gene expression in these tissues. The dendrogram shows similarities between CRC samples in different clinical stages and the heat map differences in expression of genes. The results indicate that the examined transcripts are divided into 5 groups differentiated by the stage of the cancer.
The next step was to perform comparative analysis of three mRNA panels consisting of panels A, B and C. The ANOVA and Tukey post hoc tests determined the number of statistically significant mRNAs in the examined panels of the “inflammatory response pathway”, the larger the sequences panel, the more statistically significant mRNAs are (Table 1). A similar trend was observed in a mutual comparison of transcriptomes between the groups at different stages of CRC and the control colon tissue.
Based on significant mRNAs (Table 1) an overrepresentation test was performed (Fig. 2). The obtained results show the following processes: response to stimulus, cellular processes, signal transduction, cell communication, response to stress, cell proliferation, cytokine – mediated signaling pathways and developmental, which have great significance in CRC carcinogenesis.
Additionally, based on the statistical analysis (the self-organizing map and one-way ANOVA combined with the post hoc Tukey test with the Benjamini-Hochberg correction) the obtained results were specified in a Venn diagram (the numbers of differentially expresses mRNAs in particular clinical stages of the CRC tissues compared to control colons are described within an ellipse), Fig. 3. The individual panels confirming a difference in the number of genes and in the DEGs are shown.
The overexpressed and downregulated genes in particular transcriptomes were mentioned in the Table 2, only genes with
All the distinguished genes are very important for the inflammatory response pathway in the CRC. But genes used for further analysis of potential biomarkers in the adenocarcinoma of CRC are shown in Table 3.
Selected DEGs from the early stage of CRC, namely CSI and CSII, are represented by LCK and GNLY, as well as, SLC6A6 and LAMP2 (Table 3). They have the features of potentially good markers. The values of FC for LCK and GNLY are much higher in the first stage of CRC development than in the controls, and this is visible in the subsequent decreases. However, in the case of SLC6A6 and LAMP2 which have a reduced expression in CSI, their value is strongly increasing in CSII.
Expression of each distinguished gene in fourth stages of CRC and healthy colon (CC) was presented on Fig. 4. Expression of each distinguished gene in fourth stages of CRC and healthy colon (CC) was presented on Fig. 4. Statistical significance was stated between CC and CSI for LCK (Fig. 4A;
Discussion
The presented study shows that the number of genes differs in various databases in spite of entering the same query (Table 1), thus making it an important factor for the identification of DEGs. Hence, the most extensive database result was used for the over-representation test, which allowed ongoing biological processes in the analysed samples to be recognized. There were 36 important biological processes identified. However only 8 were highlighted due to high statistical significance related to the ongoing inflammatory response in the analyzed CRC thus all have an effect on inflammation in the tumor microenvironment. Although these molecules may be attributed to different signaling pathways, they are not unreasonably incorporated into the inflammatory response pathway. Specific genes that differentiate subsequent stages of the CRC were selected from all the database panels shown (FC
The analysis of the Venn diagram results (Table 2) allowed four genes which can be good diagnostic and/or therapeutic markers of early stage CRC adenocarcinoma to be chosen. Amongst these genes are LCK, GNLY, SLC6A6 and LAMP2 (Table 3).
The LCK gene encoding lymphocyte-specific protein tyrosine kinase belongs to the SRC family which consists of such genes as SRC, FYN, YES, LYN, HCK, FGR and BLK. The gene plays a crucial role during signal transduction after T-cell receptor or FGFR2 activation. Furthermore, the FGF receptor 2 was down-regulated in the analysed tissue. Moreover, the LYN (up-regulated in CSII; Table 2, panel B) can activate FGFR2 and mediate cell division, growth and differentiation [31]. These results comply with other studies where FGFR2 expression is changed, however, strong expression was at the invasive front of CRC [23].
After activation, the LCK interacts with a large number of molecules among which are CD55, LYN and KIT. Whereas induced expression of CD55 is correlated with poor prognosis of CRC patient [9]. In turn, LYN expression is correlated with patient survival [11]. However, KIT expression in most cancers is reduced due to mutations in this gene [37]. All of these molecules are visible in our studies (Table 2) as DEGs.
Studies performed on LCK-knockout mice show a dramatic reduction in the number of peripheral T-cells. Furthermore, defective expression of LCK causes severe combined immunodeficiency in humans, but the oncogenic potential of LCK is visible through dysregulated expression in various cancers [1]. In non-small-cell lung cancer, LCK expression was determined as a good prognostic factor [5]. The observed overexpression of LCK (FC
In the advanced stages of CRC (CS IV), the GNLY gene (granulysin, cytolytic protein), which is present in cytotoxic T cells and natural killer cells, was down-regulated [13], similar to our results. In gastric carcinoma its protein is a prognostic factor and was observed only in clinical stage IV [27]. Camus et al. 2009 indicated that the co-expression of GNLY and Th1 adaptive immune responses (IRF1) accurately predicted patient survival independently to the metastatic status and high intratumoral VEGF mRNA expression. Furthermore, it was associated with significantly reduced survival rates in CRC patients expressing high mRNA levels of granulysin [4]. Our results showed the high expression of GLNY in the CSI, moderate in II and III and low in IV (Table 3), therefore it can be a “good” indicator of prognosis. This gene encodes a protein with antibacterial properties. Due to the different etiology of CRC (changed intestinal microbiome) and, among other things, many subtypes of this tumour, the gene may be a key biomarker. Nevertheless, in this case, supplementary studies at protein level should be carried out.
In contrast to the previously presented genes, the SLC6A6 expression is reduced in the CSI and is rapidly rising in CSII and afterwards this stops and it maintains its level in advanced clinical stages. The gene plays an important role in cell survival and maintenance [42]. In large B cell lymphoma its expression is a robust prognostic factor [17]. Furthermore, it has a neurotransmitter transporter function through which it mediates the uptake of 5-aminolevulinic acid by cancerous cells and causes the accumulation of protoporphyrin IX and cell photodamage [36]. The lack of reports about SLC6A6 in CRC tissues indicate that our findings are the first to show its relation to control tissues and its potential as a biomarker in colorectal adenocarcinoma.
LAMP2 is a not well-known gene encoding membrane glycoprotein which provides selectins with a carbohydrate ligand. Its high expression causes poor prognosis in patients with esophageal squamous cell carcinoma and correlates with tumor histology [19]. In prostate cancer LAMP2 was indicated as a potential biomarker and target for the neuroendocrine subtype [24]. Furthermore, the expression of LAMP2 was significantly higher in salivary gland adenoid cystic carcinoma [12]. Through elevated expression of LAMP2 in breast tumour tissue, the survival mechanism via chaperone-mediated autophagy is observed [26]. Our findings are the first to indicate LAMP2 as a potential biomarker in CRC.
Additional confirmation of the gene expression results (Fig. 4) indicate the statistical significance of the differences between the control and CRC in the early stages.
The limitation of this work is a small group of patients meeting the inclusion criteria for the study. In addition, this group comes from one surgical and geographical center. In turn, this can be an advantage, because the group is highly homogeneous. An additional limitation is the lack of independent validation and validation of selected genes for individual stages of CRC. However, each gene has already been mentioned or analysed in another studies regarding CRC [8, 25, 38, 42]. These genes are known to be expressed in colorectal cancer, and their importance is described but not in the context of potential biomarkers. Another limitation but perhaps an advantage is that the analysis of the microarrays in the search for biomarkers only concerns the inflammatory response pathway. The limitation of this work is also that the highlighted genes were not estimated in the peripheral blood of patients.
Both LCK and GNLY are associated with a lymphocytic inflammatory response and have a similar expression in colorectal cancer tissue samples, but differ in their role. The first one is involved in T lymphocyte activation and maturation and the second in the placing of cytotoxic granules of T cells and encoding protein which has antibacterial properties. Their expression is elevated in stage I but in stage IV it is strongly reduced. In turn, SLC6A6 and LAMP2 are down-regulated in stage I, and in stage II they are overexpressed. All of the distinguished genes indicate significant differences between control colon and clinical stage I or II of the CRC.
In conclusion, the mentioned genes are good candidates to become potential diagnostic biomarkers of the early stage of colorectal adenocarcinoma.
Footnotes
Acknowledgments
This study was supported by the Medical University of Silesia statutory work (KNW-1-013/K/7/0 and KNW-1-019/K/6/0). This research was supported in part by PL-Grid Infrastructure.