CD105 is recently described as a cancer stem cell (CSC) marker.
OBJECTIVE:
The present study was aimed to investigate the expression and prognostic significance of the CSC marker CD105 in different histological subtypes of renal cell carcinoma (RCC).
METHODS:
Expression of CD105 was evaluated using immunohistochemistry in RCC samples on tissue microarrays including clear cell RCCs (ccRCCs), papillary, and chromophobe RCCs. The association between CD105 expression and clinicopathological features as well as survival outcomes was determined.
RESULTS:
In ccRCC, increased tumoral cytoplasmic and endothelial expression of CD105 were significantly associated with advanced stage, renal vein invasion, and microvascular invasion (MVI). In addition, MVI was associated with a worse overall survival (OS). Moreover, in multivariate analysis tumor stage and nuclear grade were independent prognostic factors for OS both in case of tumoral cytoplasmic and endothelial CD105 expression. Additionally, CD105 expression was found to be a predictor of worse OS in univariate analysis. However, in papillary and chromophobe RCC, no significant association was found between CD105 expression and clinicopathological parameters or prognosis.
CONCLUSIONS:
We showed that CD105 expression was associated with more aggressive tumor behavior, more advanced disease, and worse prognosis in ccRCC but not in the other RCC subtypes.
Since cancer stem cells (CSCs) were introduced in solid tumors in the early 2000s [1, 2], targeting of CSCs has become an important aim. Therefore, finding the molecular markers to isolate and characterize the CSCs among the tumor cells are urgently needed.
Renal cell carcinoma (RCC) accounts for 90% of adult renal malignancies and is the most lethal urological cancer with an annually increasing incidence [3, 4]. It is estimated that there will be 63,990 new cases of RCC in the United States and 14,400 deaths in 2017 [4]. RCC is divided into several histological subtypes. Clear cell as the most common subtype, comprises 70% of RCC cases, while papillary and chromophobe RCC are 10% to 15% and 5% of RCC cases, respectively [5].
CD105 (endoglin) is a transmembrane glycoprotein and the receptor for transforming growth factor (TGF). CD105 regulates TGF- signaling by interacting with TGF- receptors I and/or II. Several studies have shown that endoglin contributes to the development of blood vessels and angiogenesis and is essential for tumor growth and development of metastasis. In addition, CD105 is a prominent marker for mesenchymal stem cells (MSCs) [6, 7].
CD105 has been introduced as a potential prognostic marker in RCC. However, the results are inconclusive and conflicting [8, 9]. Recently, CD105 has been described as a CSC marker for RCC by Bussolati and her colleagues who first isolated a population of tumor-initiating cells by means of cell sorting using CD105 marker from patient s’ specimens after radical nephrectomy. These cells displayed tumor-initiating ability and could generate serially transplantable carcinomas. Moreover, CD105 cells had much stronger features of CSCs compared with CD105 cells. The CD105 renal CSCs expressed mesenchymal stem cell markers such as CD44, CD90, CD146, CD73, CD29, embryonic stem cells markers such as Nanog, Oct4, Musashi, Nestin, and embryonic renal marker Pax-2 but lacked differentiated epithelial markers. Functionally, these cells were able to generate spheres in a non-adhesive culture system [10, 11]. In addition, CSCs have been identified and isolated using CD105 from the various RCC cell lines including 786-O, SMKTR2, SMKTR3, 769-P, Caki-1, Caki-2, ACHN, and RCC-6 [12]. A very recent study by Hu at al. on the CD105 population in human RCC xenograft models demonstrated that xenograft tumor-derived CD105 subpopulation displays stem-like characteristics with increased self-renewal compared to parental cells and also, CD105 cells were more resistant to chemotherapeutic agents. They concluded that CD105 is not only a biomarker for renal CSCs but also confers self-renewal capacity and contributes to chemoresistance in RCC [13].
An immunohistochemical study, which was carried out on paraffin-embedded tumor samples derived from 102 ccRCC patients showed that expression of CD105 in the cytoplasm of tumor cells correlates with Fuhrman nuclear grade and tumor stage and tumoral CD105 expression is also an independent prognostic factor in these patients [14]. Limited information is available on the association of CD105 expression as a CSC marker, in the RCC patients and the clinicopathological characteristics.
RCC tends to be a highly vascular tumor and previous studies have reported the presence of microvascular invasion (MVI) in up to 45% of RCCs [15]. Microvascular invasion has been considered as a predictive factor of potential spread of tumor cells, and also has been identified as an independent risk factor for poor prognosis in many solid tumors such as RCC [16]. Since CSCs play an important role in tumor development and progression [17, 18], investigations on the possible association between expression of CD105 as a CSC marker and microvascular invasion (MVI) as well as lymph node invasion (LNI) is required. Therefore, we hypothesized that cumulative expression of CD105 and also the presence of MVI and LNI can predict the outcome in patients with RCC after radical nephrectomy. Additionally, given the importance of histopathologic subtype in the treatment planning and targeted therapy of RCC, further investigation is required to clarify the role of CD105 as an independent prognostic marker in different subtypes of RCC. Therefore, the current study was designed as the first attempt to investigate the expression and prognostic value of CD105 in a series of well-defined RCC samples including clear cell, type I and II papillary, and chromophobe RCCs using the tissue microarray (TMA) technique. Furthermore, the possible association between expression level of CD105 among various subtypes of RCC was examined.
Patients and tumor pathological characteristic of various subtypes of RCC
Patients and tumor characteristics
Total samples
RCC
N (%)
Clear cell RCC N (%)
Papillary RCC N (%)
Chromophobe
Type I
Type II
RCC N (%)
Number of tumor samples
186
120 (64.5)
18 (9.7)
18 (9.7)
30 (16.1)
Mean age
Years (Range)
55 (25–82)
57 (30–82)
55 (33–76)
53 (25–73)
49 (27–76)
Mean age
85 (45.7)
60 (50.0)
15 (83.3)
9 (50.0)
15 (50.0)
Mean age
101 (54.3)
60 (50.0)
3 (16.7)
9 (50.0)
15 (50.0)
Gender
Male
132 (71.0)
83 (69.2)
15 (83.3)
15 (83.3)
19 (63.3)
Female
54 (29.0)
37 (30.8)
3 (16.7)
3 (16.7)
11 (36.7)
(Male/Female)
2.4
2.2
5
5
1.7
Tumor size (cm)
0–4
35 (18.8)
26 (21.7)
4 (22.2)
2 (11.1)
2 (6.7)
4.1–7
64 (34.4)
39 (32.5)
5 (27.8)
7 (38.9)
13 (43.3)
7.1–10
48 (25.8)
37 (30.8)
3 (16.7)
3 (16.7)
5 (16.7)
10.1
39 (21.0)
18 (15.0)
6 (33.3)
6 (33.3)
10 (33.3)
Histological grade
I
0 (0.0)
0 (0.0)
0 (0.0)
0 (0.0)
0 (0.0)
II
100 (53.8)
84 (70.0)
13 (72.2)
4 (22.2)
0 (0.0)
III
49 (26.3)
29 (24.2)
5 (27.8)
14 (77.8)
0 (0.0)
IV
7 (3.8)
7 (5.8)
0 (0.0)
0 (0.0)
0 (0.0)
Primary tumor (PT) stage
pT1
43 (23.1)
32 (26.7)
6 (33.3)
1 (5.6)
4 (13.3)
pT2
20 (10.8)
11 (9.2)
6 (33.3)
1 (5.6)
2 (6.7)
pT3
107 (57.5)
68 (56.7)
5 (27.8)
11 (61.1)
23 (76.7)
pT4
16 (8.6)
9 (7.5)
1 (5.6)
5 (27.8)
1 (3.3)
Microvascular invasion (MVI)
Present
41 (22.0)
23 (19.2)
2 (11.1)
6 (33.3)
10 (33.3)
Absent
145 (78.0)
97 (80.8)
16 (88.9)
12 (66.7)
20 (66.7)
Lymph node invasion (LNI)
Involved
13 (7.0)
8 (6.7)
1 (5.6)
4 (22.2)
0 (0.0)
None
167 (89.8)
109 (90.8)
15 (83.3)
13 (72.2)
30 (100.0)
Not identified
6 (3.2)
3 (2.5)
2 (11.1)
1 (5.6)
0 (0.0)
Renal vein invasion
Present
12 (6.5)
10 (8.3)
0 (0.0)
1 (5.6)
0 (0.0)
Absent
174 (93.5)
110 (97.7)
18 (100.0)
17 (94.4)
30 (100.0)
Tumor necrosis
Present
75 (40.3)
39 (32.5)
11 (61.1)
15 (83.3)
10 (33.3)
Absent
109 (58.6)
81 (67.5)
7 (38.9)
3 (16.7)
18 (60.0)
Not identified
2 (1.1)
0 (0.0)
0 (0.0)
0 (0.0)
2 (6.7)
Renal sinus fat invasion
Present
107 (57.5)
65 (54.2)
4 (22.2)
14 (77.8)
24 (80.0)
Absent
79 (42.5)
55 (45.8)
14 (77.8)
4 (22.2)
6 (20.0)
Renal pelvis invasion
Present
15 (8.1)
8 (6.7)
0 (0.0)
6 (33.3)
0 (0.0)
Absent
171 (91.9)
112 (93.3)
18 (100.0)
12 (66.7)
30 (100.0)
Perirenal fat invasion
Present
34 (18.3)
21 (17.5)
2 (11.1)
3 (16.7)
7 (23.3)
Absent
152 (81.7)
99 (82.5)
16 (88.9)
15 (83.3)
23 (76.7)
Gerota’s fascia invasion
Present
4 (2.2)
4 (3.3)
0 (0.0)
0 (0.0)
0 (0.0)
Absent
182 (97.8)
116 (96.7)
18 (100.0)
18 (100.0)
30 (100.0)
Distant metastasis
Present
36 (19.4)
28 (93.3)
0 (0.0)
4 (22.2)
3 (10.0)
Absent
150 (80.6)
92 (76.7)
18 (100.0)
14 (77.8)
27 (90.0)
Tumor recurrence
Yes
27 (14.5)
21 (17.5)
0 (0.0)
3 (16.7)
2 (6.7)
No
159 (85.5)
99 (82.5)
18 (100.0)
15 (83.3)
28 (93.3)
RCC indicates Renal Cell Carcinoma.
Material and methods
Tumoral cytoplasmic CD105 expression (intensity of staining, percentage of positive tumor cells, and H-score) in various subtypes of RCC ( value; Pearson’s test)
Scoring system
Total samples N (%)
RCC
Clear cell RCC
Papillary RCC N (%)
Chromophobe RCC
-value
N (%)
(Type I and II)
N (%)
Intensity of staining
No staining (0)
15 (8.1)
9 (7.5)
1 (2.8)
5 (16.7)
0.001
Weak ( 1)
112 (60.2)
55 (45.8)
33 (91.7)
24 (80.0)
Moderate ( 2)
43 (23.1)
40 (33.3)
2 (5.6)
1 (3.3)
Strong ( 3)
16 (8.6)
16 (13.3)
0 (0.0)
0 (0.0)
Percentage of positive cells
25%
27 (14.5)
12 (10)
5 (13.9)
10 (33.3)
0.006
25–50%
31 (16.7)
26 (21.7)
1 (2.8)
4 (13.3)
51–75%
20 (10.8)
11 (9.2)
6 (16.7)
3 (10.0)
75%
108 (58.1)
71 (59.2)
24 (66.7)
13 (43.3)
H-score
Low ( 100)
138 (74.2)
74 (61.7)
34 (94.4)
17 (56.7)
0.001
High ( 100)
48 (25.8)
46 (38.3)
2 (5.6)
13 (43.3)
Total
186
120
36
30
Values in bold are statistically significant. RCC indicates Renal Cell Carcinoma. H-score indicates histological score.
Patient characteristics and tumor samples
A total of 186 paraffin-embedded tissues from RCC clinical tumor samples were included in this study. These specimens were received from the Hasheminejad hospital, a major university-based referral urology-nephrology center in Tehran, Iran, in the time period of 2010 to 2015. All samples were collected from patients who had undergone radical nephrectomy and had no history of radiation therapy. These samples include multiple subtypes of RCC including clear cell, type I and II papillary, and chromophobe RCC. These tissue specimens were formalin-fixed and paraffin-embedded using a routine pathological tissue processing technique. The hematoxylin and eosin(H & E) stained slides and medical archival records were retrieved to obtain clinicopathological parameters including age, gender, tumor size (maximum tumor diameter), tumor stage, and nuclear grade. In addition, the presence of necrosis, distant metastasis, the involvement of regional lymph nodes, renal vein, sinus and pelvis, Gerota’s fascia, and microvascular invasion (MVI) were recorded. Information about patients’ outcomes including the time between radical nephrectomy and cancer-related death or last follow-up (if death did not occur) and tumor recurrence were also recorded. The stage was defined based on the pTNM classification for renal cell carcinoma [19].
Immunohistochemistry staining
Representative tissue cores from formalin-fixed and paraffin-embedded RCC tumors were selected by an experienced pathologist and collected in a tissue microarray (TMA), as recently published [20].
Briefly, all TMA sections were deparaffinized at 60C for 20 minutes and dehydrated with graded alcohol. Endogenous peroxides and non-reactive staining were blocked with 3% HO for 20 minutes at room temperature. After washing the tissue sections for three times, antigen retrieval was performed by immersing the tissues in Tris-EDTA (pH 9.0) for 10 minutes in an autoclave. The tissue sections were incubated with primary antibody monoclonal anti human CD105 (ab169545, abcam, dilution: 1/900), overnight at 4C. TMA slides were then incubated with anti-rabbit/anti-mouse Envision (Dako, Denmark) as a secondary antibody for 30 minutes. Staining patterns were visualized by exposure to 3, 3-diaminobenzidine (DAB, Dako) to achieve visualization of the antigen and counterstaining with hematoxylin (Dako). Finally, the slides were dehydrated in alcohol, cleared in xylenes (Dako), and mounted for examination. In each run of the experiment, human normal kidney tissue was used as a positive control and for a negative control, the primary antibody was replaced with Tris-buffered saline.
The association between tumoral cytoplasmic and endothelial CD105 expression and clinicopathological parameters of clear cell RCC ( value; Pearson’s test)
Patients and tumor
Total no.
Tumoral cytoplasmic CD105 expression
-value
Endothelial CD105 expression
characteristics
cases (120)
H-score low ( 100)
H-score high ( 100)
Low
Moderate
High
-value
Clear cell RCC
120 (64.5)
74 (61.7)
46 (38.3)
29 (24.2)
23 (19.2)
68 (56.7)
Tumor size (cm)
0–4
26 (21.7)
16 (21.6)
10 (21.7)
0.339
13 (44.8)
5 (21.7)
8 (11.8)
0.003
4.1–7
39 (32.5)
28 (37.8)
11 (23.9)
11 (37.9)
7 (30.4)
21 (30.9)
7.1–10
37 (30.8)
19 (25.7)
18 (39.1)
5 (17.2)
8 (34.8)
24 (35.3)
10.1
18 (15.0)
11 (14.9)
7 (15.2)
0 (0.0)
3 (13.0)
15 (22.1)
Histological grade
I
0 (0.0)
0 (0.0)
0 (0.0)
0.353
0 (0.0)
0 (0.0)
0 (0.0)
0.010
II
84 (70.0)
55 (74.3)
29 (63.0)
27 (93.1)
16 (69.6)
41 (60.3)
III
29 (24.2)
16 (21.6)
13 (28.3)
2 (6.9)
7 (30.4)
20 (29.4)
IV
7 (5.8)
3 (4.1)
4 (8.7)
0 (0.0)
0 (0.0)
7 (10.3)
Primary tumor (PT) stage
pT1
32 (26.7)
28 (37.8)
4 (8.7)
0.001
25 (86.2)
7 (30.4)
0 (0.0)
0.001
pT2
11 (9.2)
8 (10.8)
3 (6.5)
3 (10.3)
8 (34.8)
0 (0.0)
pT3
68 (56.7)
35 (47.3)
33 (71.7)
1 (3.4)
8 (34.8)
59 (86.8)
pT4
9 (7.5)
3 (4.1)
6 (13.0)
0 (0.0)
0 (0.0)
9 (73.2)
Microvascular invasion
(MVI)
Present
23 (19.2)
7 (9.5)
16 (34.8)
0.001
0 (0.0)
0 (0.0)
23 (33.8)
0.001
Absent
97 (80.8)
67 (90.5)
30 (65.2)
29 (100.0)
23 (100.0)
45 (66.2)
Renal vein invasion
Present
10 (8.3)
3 (4.1)
7 (15.2)
0.031
0 (0.0)
0 (0.0)
10 (14.7)
0.015
Absent
110 (91.7)
71 (95.9)
39 (84.8)
29 (100.0)
23 (100.0)
58 (85.3)
Renal sinus fat invasion
Present
65 (54.2)
33 (44.6)
32 (69.6)
0.008
1 (3.4)
7 (30.4)
57 (83.8)
0.001
Absent
55 (45.8)
41 (55.4)
14 (30.4)
28 (96.6)
16 (69.6)
11 (16.2)
Renal pelvis invasion
Present
8 (6.7)
2 (2.7)
6 (13.0)
0.027
0 (0.0)
0 (0.0)
8 (11.8)
0.038
Absent
112 (93.3)
72 (97.3)
40 (87.0)
29 (100.0)
23 (100.0)
60 (88.2)
Perirenal fat invasion
Present
21 (17.5)
11 (14.9)
10 (21.7)
0.335
0 (0.0)
2 (8.7)
19 (27.9)
0.002
Absent
99 (82.5)
63 (85.1)
36 (78.3)
29 (100.0)
21 (91.3)
49 (72.1)
Evaluation of immunostaining
Immunostaining of CD105 was independently evaluated by two pathologists (M.A. and M.A.) who were blinded to patient outcome and pathological information. A consensus was achieved for all samples. The intensity of staining was scored by applying a semi-quantitative system ranging from negative to strong as follows: 0 negative, 1 weak, 2 moderate, and 3 strong. The percentage of positive cells was categorized according to the positive tumor cells as follows: Group 1: less than 25% positive cells, Group 2: 25% to 50% positive cells, Group 3: 51% to 75% positive cells, and Group 4: more than 75% positive cells. For comparing all the available data, an overall histochemical score (H-score) was assigned to each case by multiplying the intensity score by the percentage of positive cells, which yielded a range from 0 to 300. The mean of the three cores was calculated as the final score. In this study, a cutoff point of 100 was chosen based on the median H-score to categorize samples as high or low tumoral cytoplasmic CD105 expression. Endothelial CD105 expression was assessed by the peri and intra tumoral vascular density (MVD). Tumors were classified into three groups depending on the number of vessels (endothelial cells) positive for the CD105 antibody: low 20 vessels in each core (0.6 mm), moderate 20–40 vessels, and high 40 vessels in each core.
Statistical analysis
All data were analyzed using the “statistical software SPSS, version 20.0. Armonk, NY: IBM Corp”. The comparisons of CD105 expression in ccRCC, papillary, and chromophobe RCC samples were done using Kruskal-Wallis and Mann-Whitney tests, for pairwise comparison between groups. Moreover, Pearson’s test was used to analyze the significance of association between CD105 expression and clinicopathological parameters. Overall survival (OS) curves were constructed using the Kaplan-Meier method and log-rank test was used to compare the estimated curves between groups. The Cox proportional hazards regression model was applied to determine which variables influenced the OS. Variables that significantly influenced survival in univariate analysis were included in multivariable analysis. A value of 0.05 was considered statistically significant.
Results
Patient characteristics
The sample population comprised of a total of 186 RCC patients including 120 (64.5%) clear cell RCC (ccRCC), papillary RCC, type I (18, 9.7%) and type II (18, 9.7%), and 30 (16.1%) chromophobe RCCs. The patients’ clinicopathological features are summarized in Table 1 both in respect to the total samples and the subtypes of RCC. It was agreed that chromophobe RCC should not be graded [15].
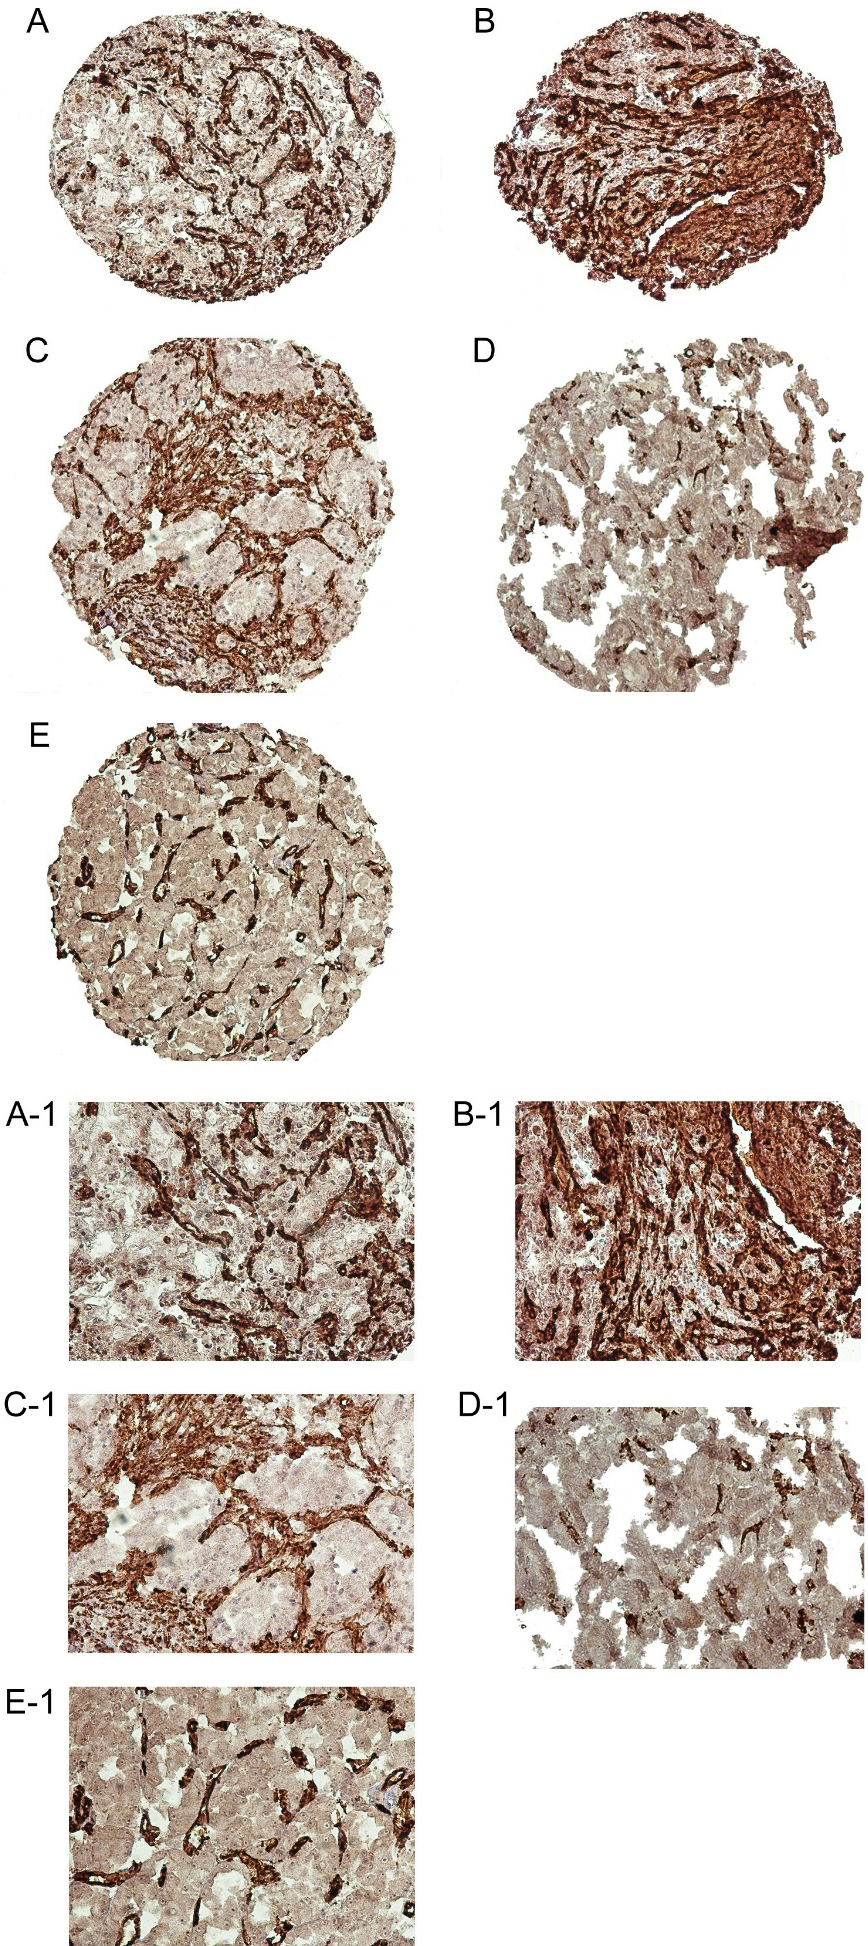
Immunohistochemical analysis of CD105 expression in renal cell carcinoma (RCC) samples. CD105 expression in clear cell RCC: low expression (A, A-1) and high expression (B, B-1). CD105 expression in papillary RCC: type I (C, C-1) and type II (D, D-1), and in chromophobe RCC (E, E1). Figures are shown with a magnification of 100 and 200.
Comparison of CD105 expression in RCC subtypes
CD105 was expressed at variety of intensities in cytoplasm of RCC samples and angiogenic endothelial cells (Fig. 1). In normal kidney tissue, there was no staining in tubules, but staining was seen in all endothelial cells, tubule capillaries and glomerular endothelial cells.
Patients were classified into two groups regarding tumoral cytoplasmic CD105 expression based on a cutoff as described earlier. Of 186 RCC samples stained for CD105, 15 (8.1%) did not show any staining, whereas weak, moderate, and strong intensities were observed in 112 (60.2%), 43 (23.1%), and 16 (8.6%) cases, respectively. Evaluation of CD105 expression in patients with RCC demonstrated that low expression of CD105 was found in 138 (74.2%), while high expression was found in 48 (25.8%) of RCC samples. CD105 expression based on the H-score in different subtypes is shown in Table 2.
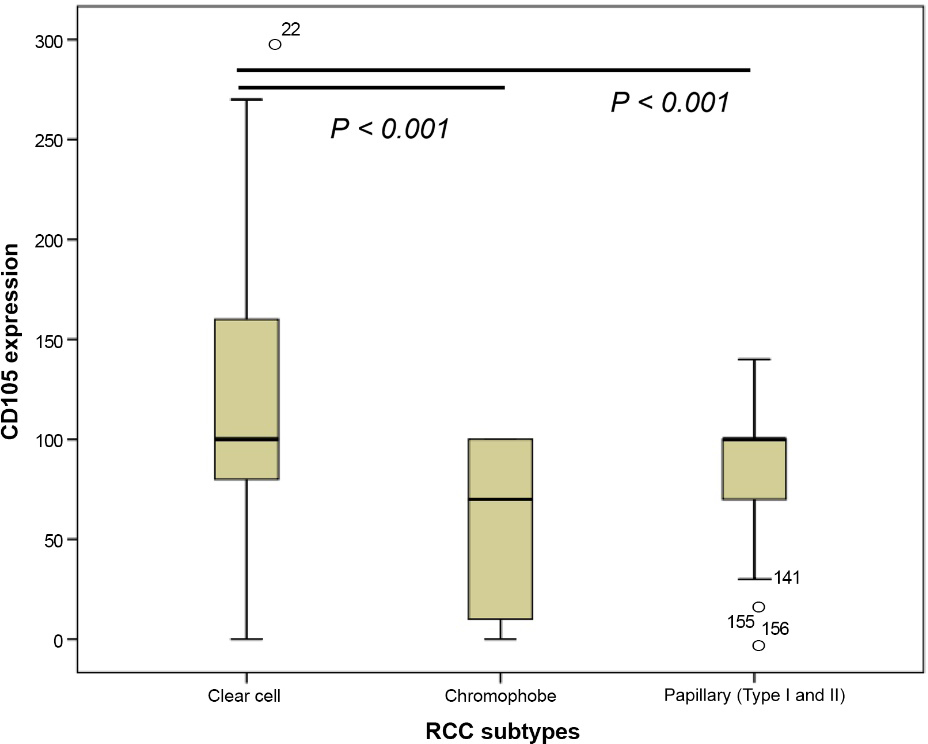
The median of the expression levels of CD105 in each subtype of RCC was as follows: ccRCC, 114; papillary RCC (Type I and II), 100; and chromophobe RCC, 58. The nonparametric Kruskal-Wallis & Mann-Whitney tests were used to compare differences between median of CD105 expression among the three subtypes. The results of Kruskal-Wallis showed a statistically significant difference between the median levels of CD105 expressions in different RCC subtypes ( 0.001). With the Mann-Whitney test, significant differences in the median levels of CD105 expression were observed between the ccRCC and type I and II papillary samples and also ccRCC and chromophobe RCC ( 0.001) (Fig. 2). Pearson’s chi-square test was performed to examine the association between CD105 expression and RCC subtypes (Pearson’s was significant for all groups) (Table 2).
Additionally, patients were classified into threegroups regarding endothelial CD105 expression as described above. Evaluation of endothelial CD105 expression in patients with RCC demonstrated a low endothelial expression of CD105 in 53 (28.5%), a moderate expression in 65 (34.9%), and high expression in 68 (36.6%) RCC samples, respectively. Of 120 ccRCC samples, 29 (24.2%) had low, 23 (19.2%) moderate, and 68 (56.7%) had high endothelial expression. Of 36 papillary tumor samples (type I and II), 16 (44.4%) had low, 17 (47.2) moderate and 3 (8.3) had high endothelial CD105 expression. Among 30 chromophobe RCC samples, 17 (56.7%) cases had low endothelial CD105 expression, and 13 (43.3%) cases had moderate expression. No sample was found with high endothelial CD105 expression in this subtype. Pearson’s chi-square test showed a statistically significant difference between endothelial CD105 expression and the various RCC subtypes ( 0.001).
Analysis of levels of cytoplasmic CD105 expression in different renal cell carcinoma (RCC) subtypes including clear cell RCC (ccRCC), chromophobe, and papillary RCC (Type I and II) using Mann-Whitney test. On the basis of the standard definitions, each box-plot shows the median (bold line), interquartile line (box), and outlier observation (circle). The results of Mann-Whitney test showed that statistical significant differences in the levels of cytoplasmic CD105 expression between the ccRCC and type I and II papillary RCC and also ccRCC and chromophobe RCC (0.001).
Association of CD105 expression with clinicopathological parameters in various subtypes of RCC
Clear cell RCC
3.3.1.1 Tumoral cytoplasmic CD105 expression
A significant association was observed between tumoral cytoplasmic CD105 expression and tumor stage ( 0.001), MVI ( 0.001), and invasion of the renal vein ( 0.031). The association between tumoral cytoplasmic CD105 expression and clinicopathological parameters are shown in Table 3. No significant association was found between tumoral cytoplasmic expression of CD105 and other clinicopathological features in ccRCC patients including lymph node invasion (LNI) ( 0.087). In addition a statistical significant association was found between the MVI and advanced stage ( 0.001).
The results of the Kruskal-Wallis & Mann-Whitney tests showed statistically significant differences ( 0.001) in the median levels of CD105 expression in various stages (I–IV). The median of the expression levels of CD105 was 87 in stage I, 104 in stage II, 121 in stage III, and 167 in stage IV. Additionally, highly significant differences was found in the median levels of CD105 expression among stages I and III as well as I and IV (in all, 0.001) (Fig. 3A).
The Kruskal-Wallis & Mann-Whitney tests also showed statistically significant difference between the median levels of CD105 expression and MVI ( 0.001) and invasion of the renal vein ( 0.032) (Fig. 3B and C).
For more investigation on the role of MVI, Kaplan-Meier survival analysis was applied to compare OS with reference to MVI in ccRCC. The mean OS time for patients with positive and negative MVI was 47(SD 7) and 72 (SD 2) months, respectively. The results demonstrated statistically significant difference in the OS and between patients with and without MVI (Log-rank test: 0.001) (Fig. 4).
Box plot analysis of cytoplasmic CD105 expression levels in histological stage I to IV (A), microvascular invasion (MVI) (B), and renal vein (C) in clear cell RCC (ccRCC) using Mann-Whitney test. On the basis of the standard definitions, each box-plot shows the median (bold line), interquartile lines (box), and outlier observation (circle). The result of Mann-Whitney test showed that there was a statistically significant association between cytoplasmic expression of CD105 and low and high stages ( 0.001), MVI ( 0.001), and renal vein involvement ( 0.032).
Kaplan-Meier curve for overall survival (OS) in patients with and without microvascular invasion (MVI) in clear cell RCC patients. Kaplan-Meier survival analysis showed that patients with MVI had significantly worse OS compared to the patients without MVI.
3.3.1.2 Endothelial CD105 expression
The association between endothelial CD105 expression and clinicopathological parameters in clear cell RCC is shown in Table 3. A highly significant association was found between endothelial CD105 expression and tumor stage and MVI ( 0.001).
Papillary (type I & II) and chromophobe RCC
In type I and II papillary and chromophobe RCC samples, there were no significant associations between the levels of tumoral cytoplasmic and endothelial CD105 expression and any important histopathological parameters (Tables 4–6).
Prognostic value of CD105 expression for clinical outcome in clear cell RCC
One hundred twenty ccRCC samples were included in this study, of which 86 (71.7%) patients had no history of recurrence, metastasis or disease related death, while 34 (28.3%) of patients were positive for these events. Metastasis and recurrence occurred in 28 (23.3%) and 21 (17.5%) patients, respectively. During the follow-up period, disease-related death was observed in 20 patients (16.7%). The median follow-up duration was 46 months; ranging from 1–79 months.
Tumoral cytoplasmic CD105 expression
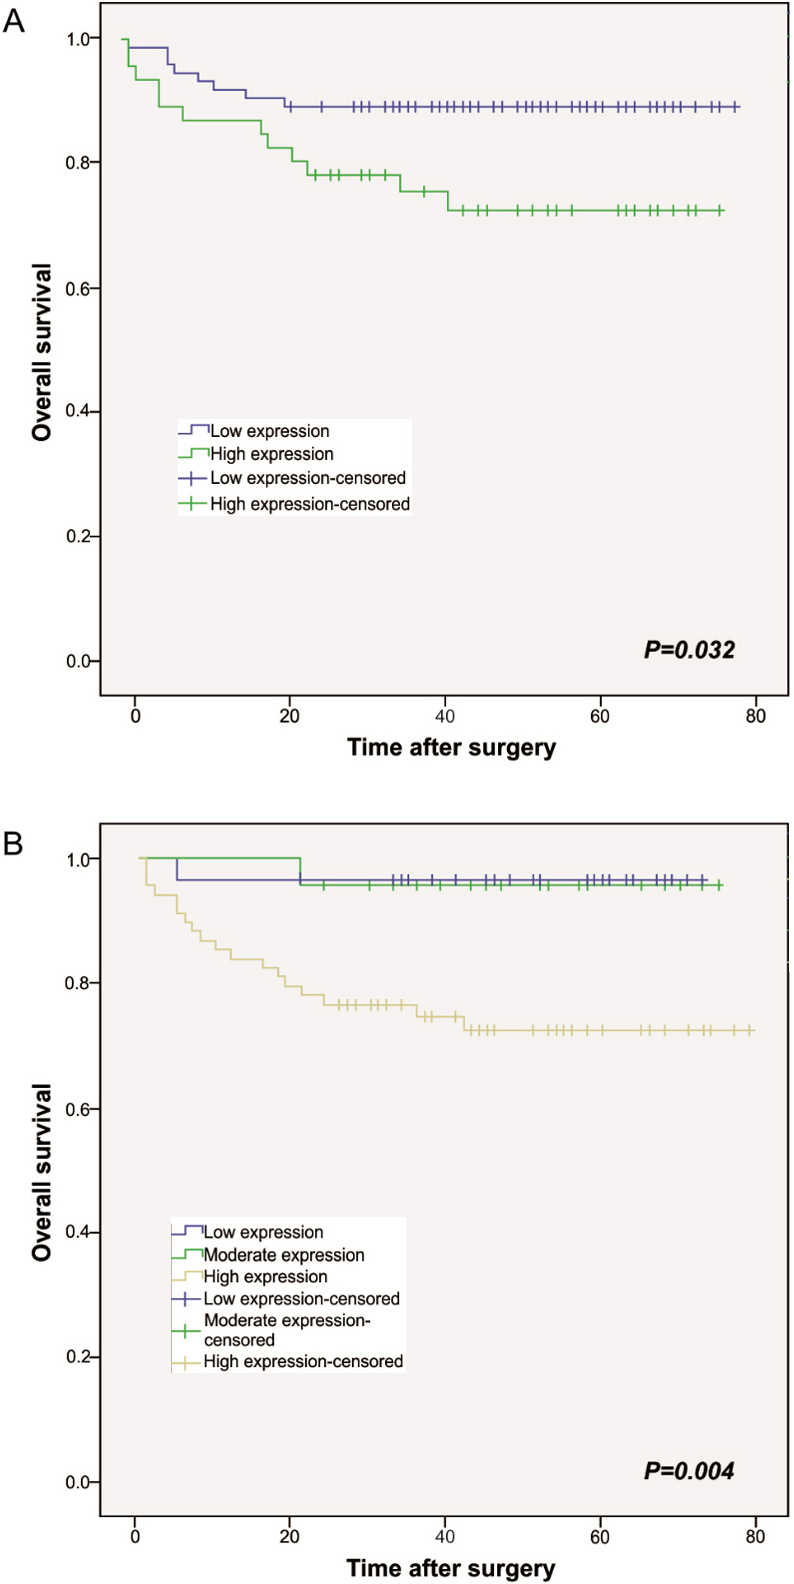
We applied Kaplan-Meier survival analysis to compare OS based on tumoral cytoplasmic CD105 expression in ccRCC. The mean OS time for the patients with high and low levels of tumoral cytoplasmic CD105 expression were 60 (SD 4) and 71 (SD 2) months, respectively. The results demonstrated significant difference in OS amongst the patients with high and low levels tumoral cytoplasmic CD105 expression (Log-rank test: 0.032) (Fig. 5A).
To further investigate the clinical usefulness of tumoral cytoplasmic CD105 expression in ccRCC, 5-year OS was compared based on tumoral cytoplasmic CD105 expression. The 5-year OS for patients with high and low tumoral cytoplasmic expression of CD105 was 72% and 89%, respectively ( 0.046).
The association between tumoral cytoplasmic and endothelial CD105 expression and clinicopathological parameters of papillary RCC type I ( value; Pearson’s test)
Patients and tumor
Total no. cases
Tumoral cytoplasmic
-value
Endothelial CD105 expression
characteristics
(18) type I
CD105 expression
H-score low
H-score high
Low
Moderate
High
-value
( 100)
( 100)
Papillary RCC
18 (9.7)
17 (94.4)
1 (5.6)
9 (50.0)
8 (44.4)
1 (5.6)
Mean age (years), (range)
55 (33–76)
Mean age
15 (83.3)
10 (58.8)
0 (0.0)
0.250
5 (55.6)
4 (50.0)
1 (100.0)
0.638
Mean age
3 (16.7)
7 (41.2)
1 (100.0)
4 (44.4)
4 (50.0)
0 (0.0)
Gender
Male
15 (83.3)
14 (82.4)
1 (100.0)
0.645
6 (66.7)
8 (100.0)
1 (100.0)
0.165
Female
3 (16.7)
3 (17.6)
0 (0.0)
3 (33.3)
0 (0.0)
0 (0.0)
Tumor size (cm)
0–4
4 (22.2)
3 (17.6)
1 (100.0)
0.295
3 (33.3)
1 (12.5)
0 (0.0)
0.556
4.1–7
5 (27.8)
5 (29.4)
0 (0.0)
1 (11.1)
3 (37.5)
1 (100.0)
7.1–10
3 (16.7)
3 (17.6)
0 (0.0)
2 (22.2)
1 (12.5)
0 (0.0)
10.1
6 (33.3)
6 (35.3)
0 (0.0)
3 (33.3)
3 (37.5)
0 (0.0)
Histological grade
I
0 (0.0)
0 (0.0)
0 (0.0)
0.523
0 (0.0)
0 (0.0)
0 (0.0)
0.250
II
13 (72.2)
12 (70.6)
1 (100.0)
7 (77.8)
6 (75.0)
0 (0.0)
III
5 (27.8)
5 (29.4)
0 (0.0)
2 (22.2)
2 (25.0)
1 (100.0)
IV
0 (0.0)
0 (0.0)
0 (0.0)
0 (0.0)
0 (0.0)
0 (0.0)
Primary tumor (PT) stage
pT1
6 (33.3)
5 (29.4)
1 (100.0)
0.548
3 (33.3)
3 (37.5)
0 (0.0)
0.546
pT2
6 (33.3)
6 (35.3)
0 (0.0)
4 (44.4)
1 (12.5)
1 (100.0)
pT3
5 (27.8)
5 (29.4)
0 (0.0)
2 (22.2)
3 (37.5)
0 (0.0)
pT4
1 (5.6)
1 (5.9)
0 (0.0)
0 (0.0)
1 (12.5)
0 (0.0)
Microvascular invasion (MVI)
Present
2 (11.1)
2 (11.8)
0 (0.0)
0.716
1 (11.1)
1 (12.5)
0 (0.0)
0.932
Absent
16 (88.9)
15 (88.2)
1 (100.0)
8 (88.9)
7 (87.5)
1 (100.0)
Lymph node invasion (LNI)
Involved
1 (5.6)
1 (5.9)
0 (0.0)
0.900
0 (0.0)
1 (12.5)
0 (0.0)
0.825
None
15 (83.3)
14 (82.4)
1 (100.0)
8 (88.9)
6 (75.0)
1 (100.0)
Not identified
2 (11.1)
2 (11.8)
0 (0.0)
1 (11.1)
1 (12.5)
0 (0.0)
Renal vein invasion
Present
0 (0.0)
0 (0.0)
0 (0.0)
–*
0 (0.0)
0 (0.0)
0 (0.0)
–
Absent
18 (100.0)
17 (100.0)
1 (100.0)
9 (100.0)
8 (100.0)
1 (100.0)
Tumor necrosis
Present
11 (61.1)
11 (64.7)
0 (0.0)
0.197
6 (66.7)
4 (50.0)
1 (100.0)
0.557
Absent
7 (38.9)
6 (35.3)
1 (100.0)
3 (33.3)
4 (50.0)
0 (0.0)
Renal sinus fat invasion
Present
4 (22.2)
4 (23.5)
0 (0.0)
0.582
2 (22.2)
2 (25.0)
0 (0.0)
0.852
Absent
14 (77.8)
13 (76.5)
1 (100.0)
7 (77.8)
6 (75.0)
1 (100.0)
Renal pelvis invasion
Present
0 (0.0)
0 (0.0)
0 (0.0)
–
0 (0.0)
0 (0.0)
0 (0.0)
–
Absent
18 (100.0)
17 (100.0)
1 (100.0)
9 (100.0)
8 (100.0)
1 (100.0)
Perirenal fat invasion
Present
2 (11.1)
2 (11.8)
0 (0.0)
0.716
1 (11.1)
1 (12.5)
0 (0.0)
0.932
Absent
16 (88.9)
15 (88.2)
1 (100.0)
8 (88.9)
7 (87.5)
1 (100.0)
Gerota’s fascia invasion
Present
0 (0.0)
0 (0.0)
0 (0.0)
–
0 (0.0)
0 (0.0)
0 (0.0)
–
Absent
18 (100.0)
17 (100.0)
1 (100.0)
9 (100.0)
8 (100.0)
1 (100.0)
Distant metastasis
Present
0 (0.0)
0 (0.0)
0 (0.0)
–
0 (0.0)
0 (0.0)
0 (0.0)
–
Absent
18 (100.0)
17 (100.0)
1 (100.0)
9 (100.0)
8 (100.0)
1 (100.0)
Tumor recurrence
Yes
0 (0.0)
0 (0.0)
0 (0.0)
–
0 (0.0)
0 (0.0)
0 (0.0)
–
No
18 (100.0)
17 (100.0)
1 (100.0)
9 (100.0)
8 (100.0)
1 (100.0)
* : No statistical are computed because the parameter is constant.
The association between tumoral cytoplasmic and endothelial CD105 expression and clinicopathological parameters of papillary RCC type II ( value; Pearson’s test)
Patients and tumor
Total no. cases
Tumoral cytoplasmic
-value
Endothelial CD105 expression
characteristics
(18) type II
CD105 expression
H-score low
H-score high
Low
Moderate
High
-value
( 100)
( 100)
Papillary RCC
18 (9.7)
17 (94.4)
1 (5.6)
7 (38.9)
9 (50.0)
2 (11.1)
Mean age (years), (range)
53 (25–73)
Mean age
9 (50.0)
9 (52.9)
0 (0.0)
0.303
4 (57.1)
5 (55.6)
0 (0.0)
0.324
Mean age
9 (50.0)
8 (47.1)
1 (100.0)
3 (42.9)
4 (44.4)
2 (100.0)
Gender
Male
15 (83.3)
14 (82.4)
1 (100.0)
0.645
6 (85.7)
7 (77.8)
2 (100.0)
0.730
Female
3 (16.7)
3 (17.6)
0 (0.0)
1 (14.3)
2 (22.2)
0 (0.0)
Tumor size (cm)
0–4
2 (11.1)
2 (11.8)
0 (0.0)
0.151
2 (28.6)
0 (0.0)
0 (0.0)
0.396
4.1–7
7 (38.9)
7 (41.2)
0 (0.0)
1 (14.3)
5 (55.6)
1 (50.0)
7.1–10
3 (16.7)
2 (11.8)
1 (100.0)
2 (28.6)
1 (11.1)
0 (0.0)
10.1
6 (33.3)
6 (35.3)
0 (0.0)
2 (28.6)
3 (33.3)
1 (50.0)
Histological grade
I
0 (0.0)
0 (0.0)
0 (0.0)
0.582
0 (0.0)
0 (0.0)
0 (0.0)
0.171
II
4 (22.2)
4 (23.5)
1 (100.0)
0 (0.0)
3 (33.3)
1 (50.0)
III
14 (77.8)
13 (76.5)
0 (0.0)
7 (100.0)
6 (66.7)
1 (50.0)
IV
0 (0.0)
0 (0.0)
0 (0.0)
0 (0.0)
0 (0.0)
0 (0.0)
Primary tumor (PT) stage
pT1
1 (5.6)
1 (5.9)
0 (0.0)
0.879
1 (14.3)
0 (0.0)
0 (0.0)
0.468
pT2
1 (5.6)
1 (5.9)
0 (0.0)
1 (14.3)
0 (0.0)
0 (0.0)
pT3
11 (61.1)
10 (58.8)
1 (100.0)
4 (57.1)
5 (55.6)
2 (100.0)
pT4
5 (27.8)
5 (29.4)
0 (0.0)
1 (14.3)
4 (44.4)
0 (0.0)
Microvascular invasion (MVI)
Present
6 (33.3)
5 (29.4)
1 (100.0)
0.146
3 (42.9)
3 (33.3)
0 (0.0)
0.526
Absent
12 (66.7)
12 (70.6)
0 (0.0)
4 (57.1)
6 (66.7)
2 (100.0)
Lymph node invasion (LNI)
Involved
4 (22.2)
4 (23.5)
0 (0.0)
0.816
1 (14.3)
3 (33.3)
0 (0.0)
0.563
None
13 (72.2)
12 (70.6)
1 (100.0)
5 (71.4)
6 (66.7)
2 (100.0)
Not identified
1 (5.6)
1 (5.9)
0 (0.0)
1 (14.3)
0 (0.0)
0 (0.0)
Renal vein invasion
Present
1 (5.6)
1 (5.9)
0 (0.0)
0.803
1 (14.3)
0 (0.0)
0 (0.0)
0.435
Absent
17 (94.4)
16 (94.1)
1 (100.0)
6 (85.7)
9 (100.0)
2 (100.0)
Tumor necrosis
Present
15 (83.3)
14 (82.4)
1 (100.0)
0.645
6 (85.7)
8 (88.9)
1 (50.0)
0.401
Absent
3 (16.7)
3 (17.6)
0 (0.0)
1 (14.3)
1 (11.1)
1 (50.0)
Renal sinus fat invasion
Present
14 (77.8)
13 (76.5)
1 (100.0)
0.582
5 (71.4)
8 (88.9)
1 (50.0)
0.428
Absent
4 (22.2)
4 (23.5)
0 (0.0)
2 (28.6)
1 (11.1)
1 (50.0)
Renal pelvis invasion
Present
6 (33.3)
6 (35.3)
0 (0.0)
0.467
4 (57.1)
2 (22.2)
0 (0.0)
0.193
Absent
12 (66.7)
11 (64.7)
1 (100.0)
3 (42.9)
7 (77.8)
2 (100.0)
Perirenal fat invasion
Present
3 (16.7)
3 (17.6)
0 (0.0)
0.645
2 (28.6)
1 (11.1)
0 (0.0)
0.518
Absent
15 (83.3)
14 (82.4)
1 (100.0)
5 (71.4)
8 (88.9)
2 (100.0)
Gerota’s fascia invasion
Present
0 (0.0)
0 (0.0)
0 (0.0)
–
0 (0.0)
0 (0.0)
0 (0.0)
–
Absent
18 (100.0)
17 (100.0)
1 (100.0)
7 (100.0)
9 (100.0)
2 (100.0)
Distant metastasis
Present
4 (22.2)
4 (23.5)
0 (0.0)
0.582
1 (14.3)
3 (33.3)
0 (0.0)
0.480
Absent
14 (77.8)
13 (76.5)
1 (100.0)
6 (85.7)
6 (66.7)
2 (100.0)
Tumor recurrence
Yes
3 (16.7)
3 (17.6)
0 (0.0)
0.645
0 (0.0)
3 (33.3)
0 (0.0)
0.165
No
15 (83.3)
14 (82.4)
1 (100.0)
7 (100.0)
6 (66.7)
2 (100.0)
* : No statistical are computed because the parameter is constant.
The association between tumoral cytoplasmic and endothelial CD105 expression and clinicopathological parameters of chromophobe RCC ( value; Pearson’s test)
Patients and tumor
Total no. cases
Tumoral cytoplasmic
-value
Endothelial CD105 expression
characteristics
30
CD105 expression
H-score low
H-score high
Low
Moderate
High
-value
( 100)
( 100)
Chromophobe RCC
30 (16.1)
17 (56.7)
13 (43.3)
17 (56.7)
13 (43.3)
0 (0.0)
Mean age (years), (range)
49 (27–76)
Mean age
15 (50.0)
10 (58.8)
8 (61.5)
0.880
8 (47.1)
7 (53.8)
0 (0.0)
0.713
Mean age
15 (50.0)
7 (41.2)
5 (38.5)
9 (52.9)
6 (46.2)
0 (0.0)
Gender
Male
19 (63.3)
10 (58.8)
9 (69.2)
0.558
10 (58.8)
9 (69.2)
0 (0.0)
0.558
Female
11 (36.7)
7 (41.2)
4 (30.8)
7 (41.2)
4 (30.8)
0 (0.0)
Tumor size (cm)
0–4
2 (6.7)
0 (0.0)
2 (15.4)
0.422
1 (5.9)
1 (7.7)
0 (0.0)
0.301
4.1–7
13 (43.3)
8 (47.1)
5 (38.5)
9 (52.9)
4 (30.8)
0 (0.0)
7.1–10
5 (16.7)
3 (17.6)
2 (15.4)
1 (5.9)
4 (30.8)
0 (0.0)
10.1
10 (33.3)
6 (35.3)
4 (30.8)
6 (35.3)
4 (30.8)
0 (0.0)
Primary tumor (PT) stage
pT1
4 (13.3)
3 (17.6)
1 (7.7)
0.200
3 (17.6)
1 (7.7)
0 (0.0)
0.311
pT2
2 (6.7)
0 (0.0)
2 (15.4)
2 (11.8)
0 (0.0)
0 (0.0)
pT3
23 (76.7)
14 (82.4)
9 (69.2)
11 (64.7)
12 (92.3)
0 (0.0)
pT4
1 (3.3)
0 (0.0)
1 (7.7)
1 (5.9)
0 (0.0)
0 (0.0)
Microvascular invasion (MVI)
Present
10 (33.3)
6 (35.3)
4 (30.8)
0.794
5 (29.4)
5 (38.5)
0 (0.0)
0.602
Absent
20 (66.7)
11 (64.7)
9 (69.2)
12 (70.6)
8 (61.5)
0 (0.0)
Lymph node invasion (LNI)
Involved
0 (0.0)
0 (0.0)
0 (0.0)
–*
0 (0.0)
0 (0.0)
0 (0.0)
–
None
30 (100.0)
17 (100.0)
13 (100.0)
17 (100.0)
13 (100.0)
0 (0.0)
Renal vein invasion
Present
0 (0.0)
0 (0.0)
0 (0.0)
–
0 (0.0)
0 (0.0)
0 (0.0)
–
Absent
30 (100.0)
17 (100.0)
13 (100.0)
17 (100.0)
13 (100.0)
0 (0.0)
Tumor necrosis
Present
10 (33.3)
7 (41.2)
3 (23.1)
0.187
0 (0.0)
0.423
Absent
18 (60.0)
10 (58.8)
8 (61.5)
5 (29.4)
5 (38.5)
0 (0.0)
Not identified
2 (6.7)
0 (0.0)
2 (15.4)
10 (58.8)
8 (61.5)
0 (0.0)
Renal sinus fat invasion
Present
24 (80.0)
13 (76.5)
11 (84.6)
0.580
13 (76.5)
11 (84.6)
0 (0.0)
0.580
Absent
6 (20.0)
4 (23.5)
2 (15.4)
4 (23.5)
2 (15.4)
0 (0.0)
Renal pelvis invasion
Present
0 (0.0)
0 (0.0)
0 (0.0)
–
0 (0.0)
0 (0.0)
0 (0.0)
–
Absent
30 (100.0)
17 (100.0)
13 (100.0)
17 (100.0)
13 (100.0)
0 (0.0)
Perirenal fat invasion
Present
7 (23.3)
5 (29.4)
2 (15.4)
0.368
4 (23.5)
3 (23.1)
0 (0.0)
0.977
Absent
23 (76.7)
12 (70.6)
11 (84.6)
13 (76.5)
10 (76.9)
0 (0.0)
Gerota’s fascia invasion
Present
0 (0.0)
0 (0.0)
0 (0.0)
–
0 (0.0)
0 (0.0)
0 (0.0)
–
Absent
30 (100.0)
17 (100.0)
13 (100.0)
17 (100.0)
13 (100.0)
0 (0.0)
Distant metastasis
Present
3 (10.0)
2 (11.8)
1 (7.7)
0.713
2 (11.8)
1 (7.7)
0 (0.0)
0.713
Absent
27 (90.0)
15 (88.2)
12 (92.3)
15 (88.2)
12 (92.3)
0 (0.0)
Tumor recurrence
Yes
2 (6.7)
1 (5.9)
1 (7.7)
0.844
1 (5.9)
1 (7.7)
0 (0.0)
0.844
No
28 (93.3)
16 (94.1)
12 (92.3)
16 (94.1)
12 (92.3)
0 (0.0)
* : No statistical are computed because the parameter is constant.
Kaplan-Meier curves for overall survival (OS) according to the tumoral cytoplasmic and endothelial expression levels of CD105 in clear cell RCC show that high tumor cytoplasmic (A) and endothelial expression (B) of CD105 was associated with shorter overall survival compared to the low expression of this marker.
Univariate and multivariate analyses were performed to assess the clinical significance of various parameters that might influence OS in patients with ccRCC. As summarized in Table 7, the tumoral cytoplasmic expression of CD105 ( 0.001), Fuhrman grade ( 0.001), tumor stage ( 0.001), and tumor size ( 0.003), were significant risk factors affecting the OS of ccRCC patients in univariate analysis. Other clinicopathologic variables were not significant factors affecting the OS of patients with ccRCC.
As shown in Table 8, statistically significant adverse prognostic factors for OS in multivariate analysis were the Fuhrman nuclear grade ( 0.007) and tumor stage ( 0.027). In addition, the tumoral cytoplasmic expression of CD105 was not a significant risk factor affecting the OS in multivariate analysis ( 0.492).
Univariate Cox regression analysis of potential prognostic factors for overall survival in patients with clear cell RCC
Covariate
Univariate analysis (Overall survival)
HR (95% CI)
-value
Tumoral cytoplasmic CD105 expression (H-score)
Low vs high
2.565 (1.048–6.276)
0.039
Endothelial CD105 expression
0.022
Low vs moderate
1.248 (0.078–19.946)
0.876
Low vs high
8.748 (1.167–65.563)
0.035
Age
1.324 (0.528–3.319)
0.549
Gender (M/F)
1.531 (0.626–3.746)
0.351
Tumor size (cm)
0–4
2.099 (1.289–3.418)
0.003
4.1–7
7.1–10
10.1
Histological grade
0.001
II vs III
9.523 (3.384–26.794)
0.001
II vs IV
5.888 (1.141–30.382)
0.034
Primary tumor (PT) stage
0.001
pT1 vs pT2
2.897 (0.181–46.322)
0.452
pT1 vs pT3
6.071 (0.789–46.692)
0.083
pT1 vs pT4
34.577 (4.134–289.201)
0.001
Microvascular invasion (MVI)
Present vs absent
0.184 (0.076–0.444)
0.001
Lymph node invasion (LNI)
0.028
Present vs absent
0.223 (0.074–0.668)
0.007
Present vs not identified
0 (0.00)
0.976
Renal vein invasion
Present vs absent
0.319 (0.107–0.956)
0.041
Tumor necrosis
Present vs absent
0.547 (0.227–1.320)
0.180
Renal sinus fat invasion
Present vs absent
0.483 (0.186–1.257)
0.136
Renal pelvis invasion
Present vs absent
0.195 (0.065–0.586)
0.004
Perirenal fat invasion
Present vs absent
0.218 (0.090–0.528)
0.001
Gerota’s fascia invasion
Present vs absent
0.195 (0.045–0.843)
0.029
Distant metastasis
Present vs absent
0.054 (0.018–0.161)
0.001
Tumor recurrence
Yes vs no
0.095 (0.038–0.235)
0.001
HR, hazard ratio; CI, confidence interval.
Multivariate Cox regression analysis of potential prognostic factors for overall survival in patients with clear cell RCC
Covariate
Multivariate analysis
Multivariate analysis
(Cytoplasmic CD105 expression)
(Endothelial CD105 expression)
HR (95% CI)
-value
HR (95% CI)
-value
Tumoral cytoplasmic CD105
expression (H-score)
Low vs high
1.399 (0.537–3.644)
0.492
–
–
Endothelial CD105 expression
0.869
Low vs moderate
–
–
0.416 (0.016–11.025)
0.600
Low vs high
0.618 (0.001–1.572)
0.942
Tumor size (cm)
0–4
1.637 (0.910–2.942)
0.100
1.570 (0.886–2.781)
0.122
4.1–7
7.1–10
10.1
Histological grade
0.007
0.007
II vs III
5.567 (1.840–16.838)
0.002
5.484 (1.819–16.535)
0.003
II vs IV
2.036 (0.360–11.509)
0.421
1.910 (0.342–10.678)
0.461
Primary tumor (PT) stage
0.027
0.121
pT1 vs pT2
1.002 (0.051–19.766)
0.999
1.904 (0.069–52.732)
0.704
pT1 vs pT3
2.666 (0.270–26.285)
0.401
0.001 (0.001–1.091)
0.949
pT1 vs pT4
10.036 (1.027–98.023)
0.047
0.002 (0.001–3.927)
0.957
HR, hazard ratio; CI, confidence interval.
Endothelial CD105 expression
The Kaplan-Meier survival analysis demonstrated significant difference in OS in patients with high, moderate, and low endothelial expression of CD105 (Log-rank test: 0.004) (Fig. 5B). The mean OS time for the patients with high, moderate, and low levels of endothelial CD105 expression were 61 (SD 3), 73 (SD 2), and 71 (SD 2) months, respectively. The 5-year OS for the high, moderate, and low endothelial CD105 expressing patients were 72%, 96%, and 97%, respectively ( 0.005). Endothelial CD105 expression was a significant risk factor affecting the OS in univariate analysis but not in the multivariate analysis (Tables 7 and 8). The Fuhrman nuclear grade ( 0.007) was adverse prognostic factor for OS in multivariate analysis (Table 8).
Papillary (type I & II) and chromophobe RCC
In type II papillary and chromophobe RCC patients, Kaplan-Meier survival analysis failed to show any statistical significant relationship between tumoral cytoplasmic and endothelial CD105 expression and the OS. In addition, univariate and multivariate analyses demonstrated that the listed clinicopathologic variables were not factors that might significantly affect the OS in type I and II papillary and chromophobe RCC patients.
Discussion
CD105 is a tumor marker expressed in vascular endothelial cells and strongly correlates with processing of new blood vessel formation [6]. In addition, high tumor micro vessel density (MVD) as assessed by CD105 immunohistochemistry shown to be associated with poor prognosis in several solid tumor types [7]. Recent studies have shown that CD105 is also expressed in tumor epithelial cells of RCC [21], human hepatocellular carcinoma (HHC) [22], and ovarian cancer [23]. Recently, CD105 has been described as a renal CSC marker [10]. Bussolati et al. and Hsieh et al. showed that the cell surface marker CD105 which is also one of the mesenchymal stem cell markers can be the marker of renal cell carcinoma as well as sarcomatoid renal cell carcinoma [10, 24]. The results by Bussolati et al. indicated CD105 were clonogenic, expressed several mesenchymal stem cell markers, embryonic stem cells markers and lacked differentiative markers, could differentiate in vitro into epithelial and endothelial cell types, and could generate in vivo serially transplantable tumors [10]. CD105 were also investigated to determine the prognostic value in RCC. In contrast, expression of CD105 in sections of formalin-fixed paraffin-embedded of RCC tumor samples was cytoplasmic. They concluded that CD105 was a predictor of patient’s outcomes than other clinicopathological factors [14]. In a new study by Hu at al. it has been shown that CD105 is essential for the maintenance of self-renewal and chemoresistance in renal CSCs [13]. According to the theory of CSCs, these subpopulations are responsible for driving tumor growth, progression, angiogenesis, resistance to chemotherapy agents, and radiotherapy [18]. A previous study on HCCs showed that CD90 papulation share features of metastatic vascular endothelial cells and express the vascular endothelial marker CD105 [25]. These results suggested that CD105 is not only a vascular endothelial cell marker but also can be a marker of CSCs with mesenchymal cell features [22].
In the current study, we showed highly significant association between the median of the cytoplasmic CD105 expression and RCC subtype including a significant difference in the median of the expression level of CD105 between ccRCC and papillary RCC cases (Type I and II) and also ccRCC and chromophobe RCC ( 0.001). In addition, a significant association was found between cytoplasmic and endothelial CD105 expression and RCC subtypes. Moreover, by analyzing the three subtype of RCC, we found that ccRCC and papillary RCC would have a higher level of tumoral cytoplasmic CD105 expression compared to chromophobe RCC. It might be due to their origin which ccRCC and papillary RCC are derived from the proximal epithelial tubule cells, while chromophobe RCC is derived from a distal epithelial tubule cells [26].
In this study, we showed that tumoral cytoplasmic and endothelial expression of CD105 was significantly associated with advanced pathological stage in ccRCC. Importantly, we observed that the median of the tumoral cytoplasmic CD105 expression was higher in advanced stages (stage III and stage IV) in comparison with lower stages (stage I and stage II), which shows the association of cytoplasmic CD105 expression with tumor aggressiveness in ccRCC. In addition, we found that the tumor stage and Fuhrman nuclear grade were independent prognostic predictors for OS in the multivariate analysis in both tumoral cytoplasmic and endothelial CD105 expression. Our results regarding endothelial CD105 expression are consistent with those of previous studies in ccRCC cases [8, 14, 27]. It is shown that vascular endothelial CD105 expression strongly correlates with angiogenesis [7] and also CSCs are associated with angiogenesis during the growth and development of tumors [28]. The study of Saroufim et al. [14] investigating cytoplasmic CD105 expression in renal cancer, the tumor stage was found to be a significant predictor of the OS in the univariate analysis but not in the multivariate analysis. Our different results may be due to a larger number of subjects compared to the aforementioned study. The tumor stage and nuclear grade are the most reliable prognostic factors in RCC and tumors with a high Fuhrman nuclear grade have a more aggressive phenotype and also are associated with local invasion and distant metastasis [29]. Furthermore, we showed for the first time, a significant association between endothelial CD105 expression and tumor size. Also, tumor size was found to be a prognostic indicator in univariate analysis, in contrast with a previous study which could not find any significant association between endothelial CD105 expression and tumor size [9]. Investigations have shown that tumor size has important clinical and pathologic implications in RCC patients and is significantly associated with risk of metastasis [30, 31].
In our study, an association was found between higher level of tumor cytoplasmic and endothelial CD105 expression and MVI as well as renal vein in ccRCC which have very important clinical indications. It is shown that RCC patients demonstrating MVI or a high degree of angiogenesis are at high risk for developing metastatic disease [32], therefore, MVI is related to cancer progression and survival in RCC and has a more significant on prognosis compared to the macroscopic renal vein or vena cava invasion following surgical tumor resection [33, 34]. The results of survival analysis showed a statistical significant relationship between patients with MVI and worse OS and higher stage. It has been reported that tumor vasculature may have a role in supporting and maintaining cancer stem cells [17, 35].
LNI is also one of the other most important prognostic factors in RCC. A previous study showed that LNI provided the strongest prognostic information for patients without MVI after radical nephrectomy [36]. In our study, we did not find any association between cytoplasmic expression of CD105 and LNI as well as survival outcomes.
In addition, significant association was found between the level of tumor cytoplasmic and endothelial CD105 expression and renal sinus involvement showing that CD105 protein expression is related to the degree of malignancy in ccRCC [37].
In this study, overall survival rate of ccRCC patients with high tumoral cytoplasmic and endothelial CD105 expression was significantly lower compared to the patients with low CD105 expression ( 0.032, 0.004, respectively) in univariate analysis. In addition, ccRCC patients who expressed higher level of CD105 in tumor cytoplasm and endothelial blood vessels had shorter 5-year overall survival compared with those with low expression. However, the pattern of CD105 expression was not a significant predictor of survival in multivariate analysis; i.e. CD105 expression was not found to be an independent prognostic factor for predicting ccRCC patient’s OS. That is likely due to low numbers of events therefore, a lengthier follow up is still needed. A previous study concluded that CD105 is an independent prognostic marker in these patients [14]. Therefore, we determined that higher levels of tumor cytoplasmic and endothelial CD105 expression was associated with increased tumor aggressiveness, more advanced disease, and poor prognosis in ccRCC. It is proposed that these clinical findings are related to the characteristics of cancer stem cells, as increased numbers of CSCs can contribute to an aggressive tumor behavior in various cancers and is significantly associated with metastatic potential [18, 38]. In addition, studies showed that CSC markers are associated with tumor progression in many solid tumors [39].
Additionally, we did not find any association betw- een cytoplasmic and endothelial expression of CD105 and various clinicopathological features or survival data in the examined type I and II papillary and chromophobe RCC which are less frequent than the ccRCC subtype. Our result is in agreement with a recent study by Matak et al. who demonstrated that CD105/CD133 cannot be validated as cancer stem cell markers in papillary RCC cell lines [40]. Our study, is the first report showing cytoplasmic expression of CD105 in chromophobe RCC.
Several previous studies have shown that anti-CD105/endoglin monoclonal antibody can effectively reduce or suppress angiogenesis, tumor growth and metastasis in SCID mice [41]. TRC105, a novel chim- eric IgG1 monoclonal antibody that binds CD105, currently is being evaluated in phase-Ib clinical studies in patients with advanced solid tumors. Ongoing clinical trials are testing TRC105 in combination with bevacizumab in glioblastoma, and together with VEGFR TKIs in RCC, hepatocellular carcinoma, and soft tissue sarcomas [42]. Results of the current study showing the differential expression of CD105 in the tumor cytoplasm and endothelial vessels of various subtypes of RCC provides important information regarding the etiology of tumor aggressiveness and prognosis in these tumors which may help in finding new therapeutic strategies for various subtypes of RCC possibly using CD105 as a therapeutic target.
Conclusion
In summary, our results revealed that there is a statistically significant difference between tumor cytoplasmic and endothelial CD105 expression in various subtypes of RCC. We showed that tumor stage and nuclear grade were independent prognostic variables for OS in ccRCC patients. In addition, higher level of tumor cytoplasmic and endothelial CD105 expression was associated with MVI and MVI correlated with advanced stage. Moreover, we found that higher expression levels of tumor cytoplasmic and endothelial CD105 were associated with more aggressive behavior, tumor progression, and poor OS in ccRCC subtype. However, such associations were not found in type I and II papillary and chromophobe RCC. Therefore, we consider the CD105 CSC marker as a useful prognostic molecular marker and potentially a target molecule for targeted therapy only in ccRCC, but possibly not in other subtypes of RCC.
Footnotes
Acknowledgments
This article is part of a PhD thesis (number: 93-03-12-25153) and was written by Leili Saeednejad Zanjani PhD student and Dr. Zahra Madjd at Oncopathology Research Centre and was supported by a grant from Iran University of Medical Sciences.
Conflict of interest
The authors declare that they have no conflict of interest.
References
1.
Al-HajjM. and ClarkeM.F., Self-renewal and solid tumor stem cells, Oncogene23 (2004), 7274.
2.
SinghS.K.HawkinsC.ClarkeI.D. and SquireJ.A., Identification of human brain tumour initiating cells, Nature432 (2004), 396.
3.
MotzerR.J.JonaschE.AgarwalN.BeardC.BhayaniS.BolgerG.B.ChangS.S.ChoueiriT.K.CostelloB.A. and DerweeshI.H., Kidney cancer, version 3.2015, Journal of the National Comprehensive Cancer Network13 (2015), 151–159.
4.
SiegelR.MillerK. and JemalA., Cancer Statistics, 2017, CA: A Cancer Journal for Clinicians67 (2017), 7–30.
5.
EbleJ., Classification of tumours: Pathology and genetics of tumours of the urinary system and male genital organs, World Health Organization Classification of Tumours (2004), 255–257.
6.
DuffS.E.LiC.GarlandJ.M. and KumarS., CD105 is important for angiogenesis: Evidence and potential applications, The FASEB Journal17 (2003), 984–992.
7.
DallasN.A.SamuelS.XiaL.FanF.GrayM.J.LimS.J. and EllisL.M., Endoglin (CD105): A marker of tumor vasculature and potential target for therapy, Clinical Cancer Research14 (2008), 1931–1937.
8.
SandlundJ.HedbergY.BerghA.GrankvistK.LjungbergB. and RasmusonT., Endoglin (CD105) expression in human renal cell carcinoma, BJU International97 (2006), 706–710.
9.
DubinskiW.GabrilM.IakovlevV.V.ScorilasA.YoussefY.M.FaragallaH.KovacsK.RotondoF.MetiasS. and ArsaniousA., Assessment of the prognostic significance of endoglin (CD105) in clear cell renal cell carcinoma using automated image analysis, Human Pathology43 (2012), 1037–1043.
10.
BussolatiB.BrunoS.GrangeC.FerrandoU. and CamussiG., Identification of a tumor-initiating stem cell population in human renal carcinomas, The FASEB Journal22 (2008), 3696–3705.
11.
BussolatiB.DekelB.AzzaroneB. and CamussiG., Human renal cancer stem cells, Cancer Letters338 (2013), 141–146.
12.
KhanM.I.CzarneckaA.M.HelbrechtI.BartnikE.LianF. and SzczylikC., Current approaches in identification and isolation of human renal cell carcinoma cancer stem cells, Stem Cell Research & Therapy6 (2015), 178.
13.
HuJ.GuanW.LiuP.DaiJ.TangK.XiaoH.QianY.SharrowA.C.YeZ. and WuL., Endoglin Is Essential for the Maintenance of Self-Renewal and Chemoresistance in Renal Cancer Stem Cells, Stem Cell Reports9 (2017), 464–477.
14.
SaroufimA.MessaiY.HasmimM.RiouxN.IacovelliR.VerhoestG.BensalahK.PatardJ.AlbigesL. and AzzaroneB., Tumoral CD105 is a novel independent prognostic marker for prognosis in clear-cell renal cell carcinoma, British Journal of Cancer110 (2014), 1778.
15.
DelahuntB.ChevilleJ.C.MartignoniG.HumphreyP.A.Magi-GalluzziC.McKenneyJ.EgevadL.AlgabaF.MochH. and GrignonD.J., The International Society of Urological Pathology (ISUP) grading system for renal cell carcinoma and other prognostic parameters, The American Journal of Surgical Pathology37 (2013), 1490–1504.
16.
HuangH.PanX.-W.HuangY.XuD.-F.CuiX.-G.LiL.HongY.ChenL.GaoY. and YinL., Microvascular invasion as a prognostic indicator in renal cell carcinoma: A systematic review and meta-analysis, International Journal of Clinical and Experimental Medicine8 (2015), 10779.
17.
LiS. and LiQ., Cancer stem cells and tumor metastasis, International Journal of Oncology44 (2014), 1806–1812.
18.
NguyenL.V.VannerR.DirksP. and EavesC.J., Cancer stem cells: An evolving concept, Nature Reviews Cancer12 (2012), 133.
19.
TrpkovK.GrignonD.J.BonsibS.M.AminM.B.BillisA.Lopez-BeltranA.SamaratungaH.TamboliP.DelahuntB. and EgevadL., Handling and staging of renal cell carcinoma: The International Society of Urological Pathology Consensus (ISUP) conference recommendations, The American Journal of Surgical Pathology37 (2013), 1505–1517.
20.
RastiA.AbolhasaniM.ZanjaniL.S.AsgariM.MehrazmaM. and MadjdZ., Reduced expression of CXCR4, a novel renal cancer stem cell marker, is associated with high-grade renal cell carcinoma, Journal of Cancer Research and Clinical Oncology143 (2017), 95–104.
21.
ChengB.YangG.JiangR.ChengY.YangH.PeiL. and QiuX., Cancer stem cell markers predict a poor prognosis in renal cell carcinoma: A meta-analysis, Oncotarget7 (2016), 65862–65875.
22.
NomuraY.YamashitaT.OishiN.NioK.HayashiT.YoshidaM.HayashiT.HashibaT.AsahinaY. and OkadaH., De novo emergence of mesenchymal stem-like CD105+ cancer cells by cytotoxic agents in human hepatocellular carcinoma, Translational Oncology10 (2017), 184–189.
23.
ZiebarthA.J.NowsheenS.StegA.D.ShahM.M.KatreA.A.DobbinZ.C.HanH.-D.Lopez-BeresteinG.SoodA.K. and ConnerM., Endoglin (CD105) contributes to platinum resistance and is a target for tumor-specific therapy in epithelial ovarian cancer, Clinical Cancer Research19 (2013), 170–182.
24.
HsiehC.-H.HsiungS.-C.YehC.-T.YenC.-F.ChouY.-H.W.LeiW.-Y.PangS.-T.ChuangC.-K. and LiaoS.-K., Differential expression of CD44 and CD24 markers discriminates the epitheliod from the fibroblastoid subset in a sarcomatoid renal carcinoma cell line: Evidence suggesting the existence of cancer stem cells in both subsets as studied with sorted cells, Oncotarget8 (2017), 15593.
25.
BenettiA.BerenziA.GambarottiM.GarrafaE.GelatiM.DessyE.PortolaniN.PiardiT.GiuliniS.M. and CarusoA., Transforming growth factor-β1 and CD105 promote the migration of hepatocellular carcinoma-derived endothelium, Cancer Research68 (2008), 8626–8634.
26.
CohenH.T. and McGovernF.J., Renal-cell carcinoma, New England Journal of Medicine353 (2005), 2477–2490.
27.
YagasakiH.KawataN.TakimotoY. and NemotoN., Histopathological analysis of angiogenic factors in renal cell carcinoma, International Journal of Urology10 (2003), 220–227.
28.
LanJ.LiJ.JuX.ZhouY.QiY.RenY.ZouH.WangL.LiM. and PangL., Relationship between microvessel density and cancer stem cells in tumor angiogenesis: A meta-analysis, Biomarkers in Medicine10 (2016), 919–932.
29.
KanaoK.MizunoR.KikuchiE.MiyajimaA.NakagawaK.OhigashiT.NakashimaJ. and OyaM., Preoperative prognostic nomogram (probability table) for renal cell carcinoma based on TNM classification, The Journal of Urology181 (2009), 480–485.
30.
ThompsonR.H.HillJ.R.BabayevY.CroninA.KaagM.KunduS.BernsteinM.ColemanJ.DalbagniG. and TouijerK., Metastatic renal cell carcinoma risk according to tumor size, The Journal of Urology182 (2009), 41–45.
31.
HerrlingerA.SchottG.SchafhauserW. and SchrottK., The significance of tumor diameter in renal cell carcinoma, Der Urologe Ausg A31 (1992), 70–75.
32.
DekelY.KorenR.KugelV.LivneP.M. and GalR., Significance of angiogenesis and microvascular invasion in renal cell carcinoma, Pathology & Oncology Research8 (2002), 129–132.
33.
LangH.LindnerV.SaussineC.HavelD.FaureF. and JacqminD., Microscopic venous invasion: A prognostic factor in renal cell carcinoma, European Urology38 (2000), 600–605.
34.
LangH.LindnerV.LetourneuxH.MartinM.SaussineC. and JacqminD., Prognostic value of microscopic venous invasion in renal cell carcinoma: Long-term follow-up, European Urology46 (2004), 331–335.
35.
BaoS.WuQ.SathornsumeteeS.HaoY.LiZ.HjelmelandA.B.ShiQ.McLendonR.E.BignerD.D. and RichJ.N., Stem cell-like glioma cells promote tumor angiogenesis through vascular endothelial growth factor, Cancer Research66 (2006), 7843–7848.
36.
ZubacD.P.BostadL.SeidalT.Wentzel-LarsenT. and HaukaasS.A., The prognostic relevance of interactions between venous invasion, lymph node involvement and distant metastases in renal cell carcinoma after radical nephrectomy, BMC Urology8 (2008), 19.
37.
GrignonD. and PanerG.P., Renal cell carcinoma and the renal sinus, Advances in Anatomic Pathology14 (2007), 63–68.
38.
XiaP., Surface markers of cancer stem cells in solid tumors, Current Stem Cell Research & Therapy9 (2014), 102–111.
39.
HermannP.C.BhaskarS.CioffiM. and HeeschenC., Cancer stem cells in solid tumors, in: Seminars in Cancer Biology, Elsevier, 2010, 77–84.
40.
MatakD.BrodaczewskaK.K.SzczylikC.KochI.MyszczyszynA.LipiecM.LewickiS.SzymanskiL.ZdanowskiR. and CzarneckaA.M., Functional significance of CD105-positive cells in papillary renal cell carcinoma, BMC Cancer17 (2017), 21.
41.
SeonB.K.MatsunoF.HarutaY.KondoM. and BarcosM., Long-lasting complete inhibition of human solid tumors in SCID mice by targeting endothelial cells of tumor vasculature with antihuman endoglin immunotoxin, Clinical Cancer Research3 (1997), 1031–1044.
42.
GordonM.S.RobertF.MateiD.MendelsonD.S.GoldmanJ.ChioreanE.G.StrotherR.M.SeonB.K.FiggW. and PeerC.J., An open label phase 1b dose escalation study of TRC105 (anti-endoglin antibody) with bevacizumab in patients with advanced cancer, Clinical Cancer Research (2014), clincanres–1143.