The association of chemotherapy-associated hemoglobin and survival of colorectal cancer (CRC) receiving adjuvant chemotherapy is uncertain. We sought to explore the prognostic value of chemotherapy-associated hemoglobin in CRC receiving adjuvant chemotherapy and the best cut point affecting prognosis.
METHODS:
Three hundred and twenty stage II and III CRC patients receiving adjuvant FOLFOX chemotherapy from March 2003 to March 2012 were enrolled. The associations between chemotherapy-associated hemoglobin (the absolute levels of post-chemotherapy) or chemotherapy-associated hemoglobin change (change between the pre- and post-chemotherapy hemoglobins) and disease free survival (DFS) or overall survival (OS) of CRC, and the best cut point were investigated.
RESULTS:
Log rank test showed the best cut points for chemotherapy-associated hemoglobin and chemotherapy-associated hemoglobin change were respectively 90 g/L, 30 g/L. Cox regression model showed chemotherapy-associated hemoglobin 90 g/L was the independent prognostic factor for DFS (HR, 2.221; 95% CI 1.157–4.262), OS (HR, 2.058; 95% CI 1.009–4.197), respectively, but no association of chemotherapy-associated hemoglobin change 30g/L and DFS (HR, 2.063; 95% CI 0.929–4.583), OS (HR, 1.386; 95% CI 0.553–3.471) was found.
CONCLUSIONS:
Chemotherapy-associated hemoglobin 90 g/L has a significant prognostic value in CRC receiving adjuvant chemotherapy, which is a significant biomarker in the individualized management and may suggest the simple indication for the treatment of anemia in adjuvant chemotherapy in CRC.
Combination of fluorouracil (5-Fu), leucovorin (LV) and oxaliplatin chemotherapy (FOLFOX), which has been widely accepted as the standard adjuvant chemot- herapy for stage III and stage II colorectal cancer (CRC), has reduced the risk of relapse after surgery and improved survival significantly [1]. However, the responses to chemotherapy vary in different subpopulations. Thus, approximately 20%–40% patients receiving adjuvant chemotherapy after a curative operation experience recurrence [2, 3, 4, 5]. It is important to identify the risk factors which impact recurrence and survival of CRC patients receiving adjuvant chemotherapy.
As a frequent finding, anemia occurs in 18%–70% of cancer patients [6, 7, 8]. In Chinese population, the normal hemoglobin levels are 120–160 g/L in male, 110–150 g/L in female, respectively [9]. Chemotherapy-induced anemia, which is a common complication in chemotherapy, occurs in 30%–70% of cancer patients receiving chemotherapy [10, 11, 12]. The National Cancer Institute Common Terminology Criteria for Adverse Events version 4.0 (NCI-CTCAE 4.0) for the assessment of therapy induced anemia including chemotherapy-induced anemia in CRC included the following (https://ctep.cancer.gov/protocolDevelopm-ent/electronic_applications/ctc.htm): grade 1 (mild), 100 g/L to within normal limits; grade 2 (moderate), 80–100 g/L; grade 3 (severe), 65–80 g/L; and grade 4 (life threatening), less than 65 g/L. Anemia contributes to tumor progression in different types of cancer [7, 13, 14, 15]. Most of the reports focused on the impact of preoperative anemia on cancer, but the association of chemotherapy-associated hemoglobin and survival of colorectal cancer receiving adjuvant chemotherapy is uncertain. Herein, we investigated the prognostic relationship between chemotherapy-associated hemoglobin and survival of CRC patients receiving adjuvant FOLFOX chemotherapy. Moreover, we selected the best cut point of chemotherapy-associated hemoglobin which impacted the clinical outcome to guide the individualized management in CRC receiving chemotherapy.
Materials and methods
Patient selection
Stage II and III pathology-proven CRC patients from March 2003 to March 2012 in the Second Affiliated Hospital of Guangzhou Medical University, who received adjuvant FOLFOX chemotherapy, were enrolled in our retrospective study. The deadline of follow up was April 2013. Stage II CRC patients receiving adjuvant FOLFOX chemotherapy only included those who had at least one of the following high risk factors: T4, tumor perforation, bowel obstruction, poorly differentiated tumor, venous invasion, or less than 10 lymph nodes examined, or those who had the intention to receive chemotherapy when they were informed of the efficacy and risk of chemotherapy. The exclusion criteria included the following: anemia induced by other factors such as hematologic diseases, chronic renal diseases, folate deficiency; primary prophylactic treatment of iron supplements, transfusion, or erythropoiesis-stimulating agents (ESAs) administration following chemotherapy. Other inclusion and exclusion criteria were defined in our previous report [15] – inclusion criteria: At least 3 cycles of adjuvant chemotherapy, no tumor recurrence during chemotherapy, WHO performance status (PS) 0–1, adequate pretreatment renal (pretreatment creatinine clearance 60 mL/min), and hepatic functions (pretreatment bilirubin 1.5 upper limit of normal, pretreatment alanine aminotransferase and/or aspartate aminotransferase 2.5 upper limit of normal), adequate baseline bone marrow (absolute baseline neutrophil counts 2.0 10 cells/L, absolute baseline lymphocyte counts 1.0 10 cells/L, baseline platelet counts 100 10 cells/L); exclusion criteria: biologic or immunotherapy, concomitant or neoadjuvant radiotherapy, previous systemic chemotherapy or neoadjuvant chemotherapy, primary prophylactic administration of granulocyte colony-stimulating factor (G-CSF) following chemotherapy, previous malignancies other than colorectal cancer, documented human immunosuppression.
Ethics statement
The study conforms with the principles expressed in the Declaration of Helsinki. The study was approved by the institutional review boards of the Second Affiliated Hospital of Guangzhou Medical University and the institutional review boards of the Second Affiliated Hospital of Nanchang University. All participants signed an informed consent approved by the institutional Review Boards.
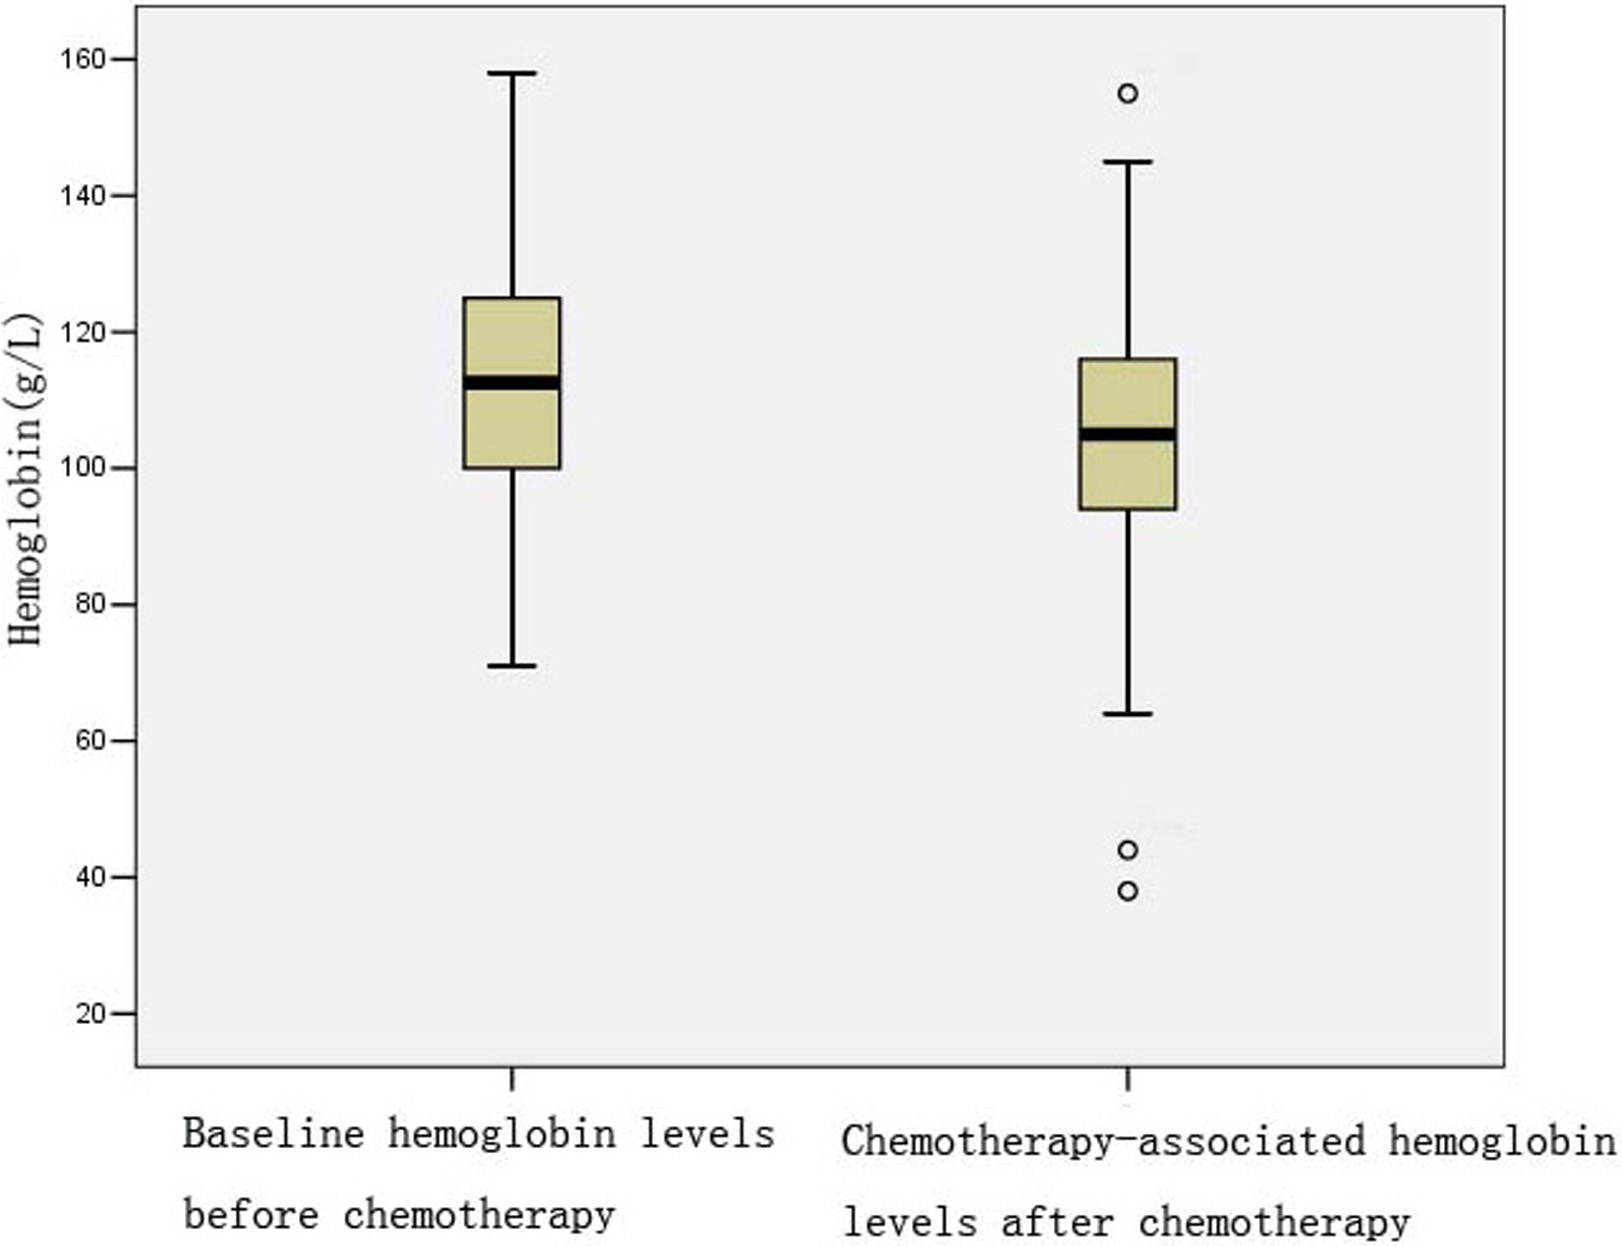
Hemoglobin levels at baseline and after chemotherapy.
FOLFOX treatment and data collection
The FOLFOX regimen consisted of a 2-h intrav- enous infusion of 85 mg/m oxaliplatin and 400 mg/m LV, followed by 400 mg/m bolus 5-FU plus a 46-h intravenous infusion of 2400 mg/m 5-FU, repeated every 2 weeks. Chemotherapy was delayed due to severe toxicity and the doses of oxaliplatin and 5-FU were reduced by 15% in subsequent cycles. Chemotherapy was discontinued due to unacceptable toxicity.
From the medical records we collected the data of pretreatment albumin, pretreatment carcinoembryonic antigen (CEA), differentiation, sex, age, location, stage, lymphocyte, hemoglobin. The evaluation of WHO PS, lymphocyte and hemoglobin test was performed before each next chemotherapy cycle. The nadir lymphocytes, hemoglobin after chemotherapy were recorded in our study. Chemotherapy-associated hemoglobin The absolute levels of nadir hemoglobin after chemotherapy. The chemotherapy-associated he- moglobin change the baseline hemoglobin prior to chemotherapy minus the absolute levels of nadir hemoglobin after chemotherapy. Albumin, CEA, and stage were defined as our previous report [16]: Albumin was divided into the following two groups: or 35 g/L, CEA was divided into the following two groups: or 10 ng ml, staging was performed according to the American Joint Committee on Cancer (AJCC, seventh edition). Our previous report has shown chemotherapy-associated lymphopenia 0.66 10/L has a significant impact on disease free survival (DFS), chemotherapy-associated lymphopenia 0.91 10/L has a significant impact on overall survival (OS) of CRC receiving adjuvant chemotherapy, respectively [16]. Thus, we included chemotherapy-associated lymphocytes in our study. In the Cox proportional hazard model, chemotherapy-associated lymphocytes were divided into or 0.66 10/L for DFS, or 0.91 10/L for OS, respectively.
Statistical analysis
Log rank test and life table were used to estimate DFS and OS. Minimum -value approach, or alternatively the maximum statistic approach based on the log rank test statistic, proposed by Williams et al. [17], Altman et al. [18] and Contal and O’Quigley [19], was used to estimate the best cut point of chemotherapy-associated hemoglobin or the chemotherapy-associated hemoglobin change affecting DFS or OS. Multivariate analysis and Cox proportional hazard models were used to determine the independent impact of chemotherapy-associated hemoglo- bin on DFS or OS. All statistical analyses were performed by Statistical Package of Social Sciences 19.0 software and 2-sided. value 0.05 was considered to be statistically significant.
Log rank statistic and value for the potential cut points of chemotherapy-associated hemoglobin evaluating disease free survival (DFS) or overall survival (OS) of colorectal cancer
Potential
DFS
OS
cut points
Log rank statistic
value
Log rank statistic
value
150 g/L
0.443
0.506
0.468
0.494
140 g/L
0.332
0.564
0.164
0.685
130 g/L
1.060
0.303
1.712
0.191
120 g/L
2.623
0.105
0.748
0.387
110 g/L
6.584
0.010
2.623
0.105
100 g/L
3.251
0.071
4.163
0.041
90 g/L
22.568
0.0001
15.127
0.0001
80 g/L
13.149
0.0001
9.336
0.002
70 g/L
8.066
0.005
1.028
0.311
50 g/L
19.358
0.0001
37.029
0.0001
40 g/L
6.946
0.008
11.239
0.001
Life table for chemotherapy-associated hemoglobin 90 g/L
Interval start
DFS
OS
time (months)
Number exposed to risk
Number of terminal events
Cumulative proportion surviving at end of interval
Number exposed to risk
Number of terminal events
Cumulative proportion surviving at end of interval
0
265.5
21
92%
266
6
98%
12
221.5
21
83%
236
16
91%
24
151.5
7
80%
169.5
13
84%
36
105
6
75%
114
9
77%
48
80.5
3
72%
82.5
2
76%
60
67
2
70%
69
2
73%
72
55.5
0
70%
57.5
1
72%
84
43
0
70%
44
1
71%
96
26
0
70%
26.5
1
68%
108
10
2
56%
9
0
68%
Life table for chemotherapy-associated hemoglobin 90 g/L
Interval start
DFS
OS
time (months)
Number exposed to risk
Number of terminal events
Cumulative proportion surviving at end of interval
Number exposed to risk
Number of terminal events
Cumulative proportion surviving at end of interval
0
54
7
87%
54
2
96%
12
43.5
14
59%
48
6
84%
24
22
4
48%
33
8
64%
36
12.5
2
41%
17.5
4
49%
48
7
0
41%
8.5
1
43%
60
4.5
1
32%
4.5
1
34%
72
2.5
0
32%
2.5
0
34%
84
2
0
32%
2
0
34%
96
2
0
32%
2
0
34%
108
1
0
32%
1
0
34%
Results
Characteristics of the study population
320 CRC patients who fulfilled the eligibility and exclusion criteria were included in the present study with a median follow-up time of 33 months (range 7–120 months), a median age of 59 years (a range of 22–82 years). Of the 320 cases, 33 cases had to stop adjuvant chemotherapy for severe toxicity. Of the 320 cases, 177 (55.3%) were male and 143 (44.7%) were female. One hundred and forty-three (44.7%) cases were rectal cancer, 99 (30.9%) cases were left colon cancer, and 78 (24.4%) were right colon cancer. According to the American Joint Committee on Cancer (AJCC, seventh edition), there were 185 (57.8%) stage II cases and 135 (42.2%) stage III cases. The population in our study had a mean baseline hemoglobin of 112.2 16.7 g/L (mean standard deviation), a mean chemotherapy-associated hemoglobin (nadir hemoglobin after chemotherapy) of 104.8 16.5 g/L (mean standard deviation), and a mean hemoglobin change of 7.4 12.8 g/L (mean standard deviation) during chemotherapy. The actual levels of baseline hemoglobin before chemotherapy and chemotherapy-associated hemoglobin after chemotherapy were shown in Fig. 1. According to NCI-CTCAE 4.0, grade 3/4 anemia was observed in 20 (6.25%) cases.
Log rank statistic and value for the potential cut points of chemotherapy-associated hemoglobin change evaluating DFS or OS of colorectal cancer
Potential
DFS
OS
cut points
Log rank statistic
value
Log rank statistic
value
20 g/L
0.321
0.571
0.468
0.494
10 g/L
0.000
0.984
0.515
0.473
0 g/L
0.014
0.907
0.509
0.476
10 g/L
2.852
0.091
2.461
0.117
20 g/L
8.309
0.004
2.078
0.149
30 g/L
16.563
0.0001
5.254
0.022
40 g/L
6.939
0.008
1.137
0.286
50 g/L
2.066
0.151
0.050
0.823
60 g/L
0.372
0.542
0.403
0.526
The best cut point of chemotherapy-associated hemoglobin, chemotherapy-associated hemoglobin change on CRC survival
Prognostic value of chemotherapy-associated hemoglobin 90 g/L, chemotherapy-associated hemoglobin change 30 g/L for DFS or OS of colorectal cancer
Variables
DFS
OS
Hazard ratio
95% confidence intervals
-value
Hazard ratio
95% confidence intervals
-value
Pretreatment albumin
35 g/L
1.00 (ref.)
1.00 (ref.)
35 g/L
0.792
0.470–1. 334
0.380
1.160
0.684–1.966
0.582
Pretreatment CEA
10 ng ml
1.00 (ref.)
1.00 (ref.)
10 ng ml
2.437
1.538–3.863
0.0001
2.759
1.649–4.618
0.0001
Differentiation
Well
1.00 (ref.)
1.00 (ref.)
Moderately
1.310
0.618–2.777
0.481
1.124
0.475–2.661
0.791
Low
0.842
0.297–2.385
0.745
1.121
0.360–3.494
0.844
Sex
Male
1.00 (ref.)
1.00 (ref.)
Female
1.362
0.874–2.122
0.172
1.295
0.796–2.109
0.298
Age
49 years
1.00 (ref.)
1.00 (ref.)
50–60 yeas
1.378
0.750–2.531
0.302
1.247
0.611–2.543
0.544
60 years
1.285
0.734–2.249
0.380
1.492
0.783–2.845
0.224
Location
Rectum
1.00 (ref.)
1.00 (ref.)
Left colon cancer
0.721
0.427–1.219
0.222
0.872
0.490–1.565
0.643
Right colon cancer
0.845
0.498–1.432
0.531
0.783
0.426–1.440
0.431
Stage
II
1.00 (ref.)
1.00 (ref.)
III
2.729
1.723–4.323
0.0001
2.809
1.668–4.729
0.0001
Chemotherapy-associated lymphocytes
0.66 10/L (DFS)/
1.00 (ref.)
0.91 10/L (OS)
0.66 10/L (DFS)/
1.593
0.894–2.839
0.114
1.557
0.944–2.568
0.083
0.91 10/L (OS)
Baseline hemoglobin
1.004
0.987–1.022
0.613
1.006
0.987–1.025
0.549
Chemotherapy-associated hemoglobin change
30 g/L
1.00 (ref.)
1.00 (ref.)
30 g/L
2.063
0.929–4.583
0.075
1.386
0.553–3.471
0.486
Chemotherapy-associated hemoglobin
hemoglobin 90 g/L
1.00 (ref.)
1.00 (ref.)
hemoglobin 90 g/L
2.221
1.157–4.262
0.016
2.058
1.009–4.197
0.047
Carcinoembryonic antigen.
Our study had a range of 38–155 g/L for chemoth- erapy-associated hemoglobin. There were 11 distinct potential cut points: 150 g/L, 140 g/L, 130 g/L, 120 g/L, 110 g/L, 100 g/L, 90 g/L, 80 g/L, 70 g/L, 50 g/L, 40 g/L. The maximum value of log rank test statistic occurred at 90 g/L for DFS, 50 g/L for OS, respectively (Table 1). However, 50 g/L is an extreme cut point, as only 2 cases suffered from chemotherapy-associated hemoglobin 50 g/L. If we selected 50 g/L as the cut point, we achieved the study power of 0.311 (two-sided test, 0.05). Therefore 50 g/L is an improper cut point. The following maximum value of log rank test statistic occurred at 90 g/L for OS (Table 1). Thus we selected 90 g/L as the best cut point of chemotherapy-associated hemoglobin affecting DFS, OS with a value 0.0001 (Table 1). The number of events, number at risk at relevant time points and cumulative proportion surviving at end of interval were shown in Tables 2 and 3. Our study had a range of 26–69 g/L for chemotherapy-associated hemoglobin change. There were 9 distinct potential cut points: 20 g/L, 10 g/L, 0 g/L, 10 g/L, 20 g/L, 30 g/L, 40 g/L, 50 g/L, 60 g/L. The maximum value of log rank test statistic occurred at 30 g/L for DFS, OS with a value 0.0001, respectively (Table 4). Thus we selected 30 g/L as the best cut point of chemotherapy-associated hemoglobin change affecting DFS, OS.
The prognostic value of chemotherapy- associated hemoglobin 90 g/L, chemotherapy- associated hemoglobin change 30 g/L for colorectal cancer
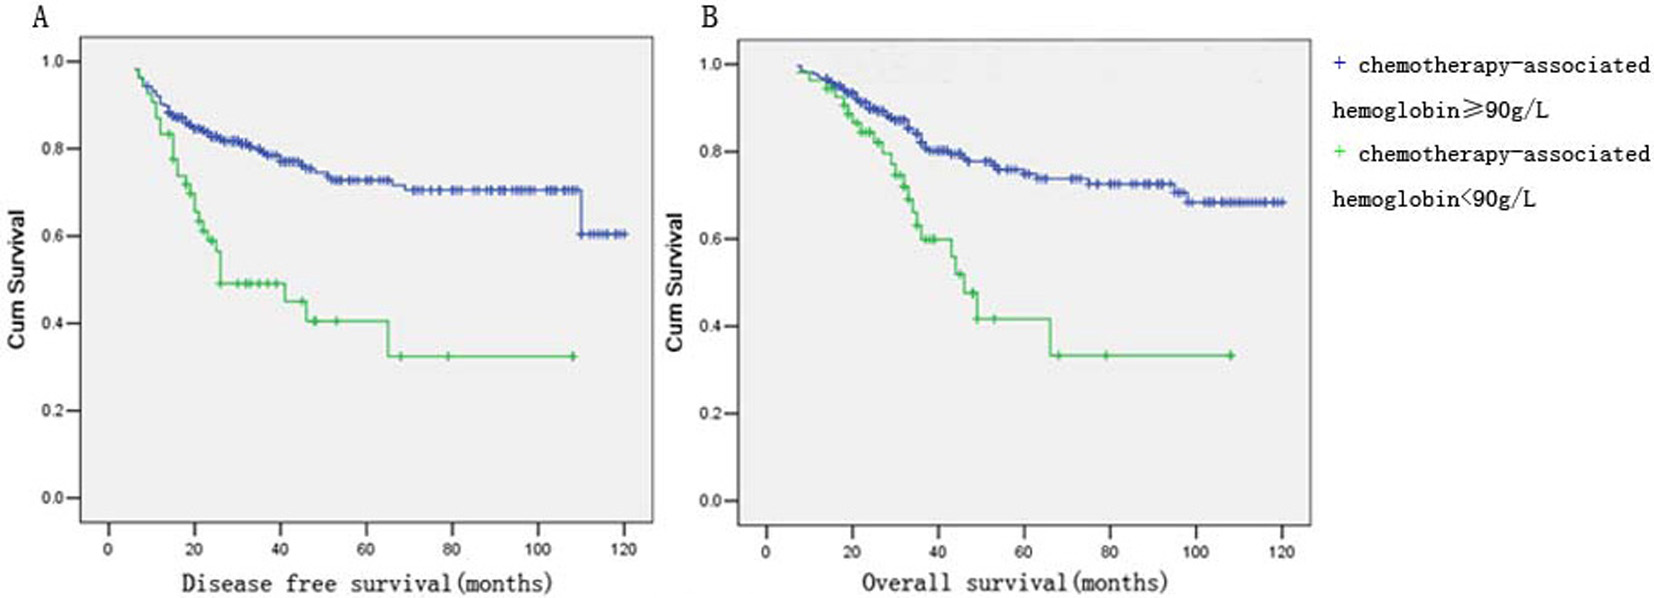
DFS or OS curve by Kaplan-Meier method. (A) Chemotherapy-associated hemoglobin 90 g/L was associated with shorter DFS ( 0.0001). (B) Chemotherapy-associated hemoglobin 90 g/L was associated with shorter OS ( 0.0001).
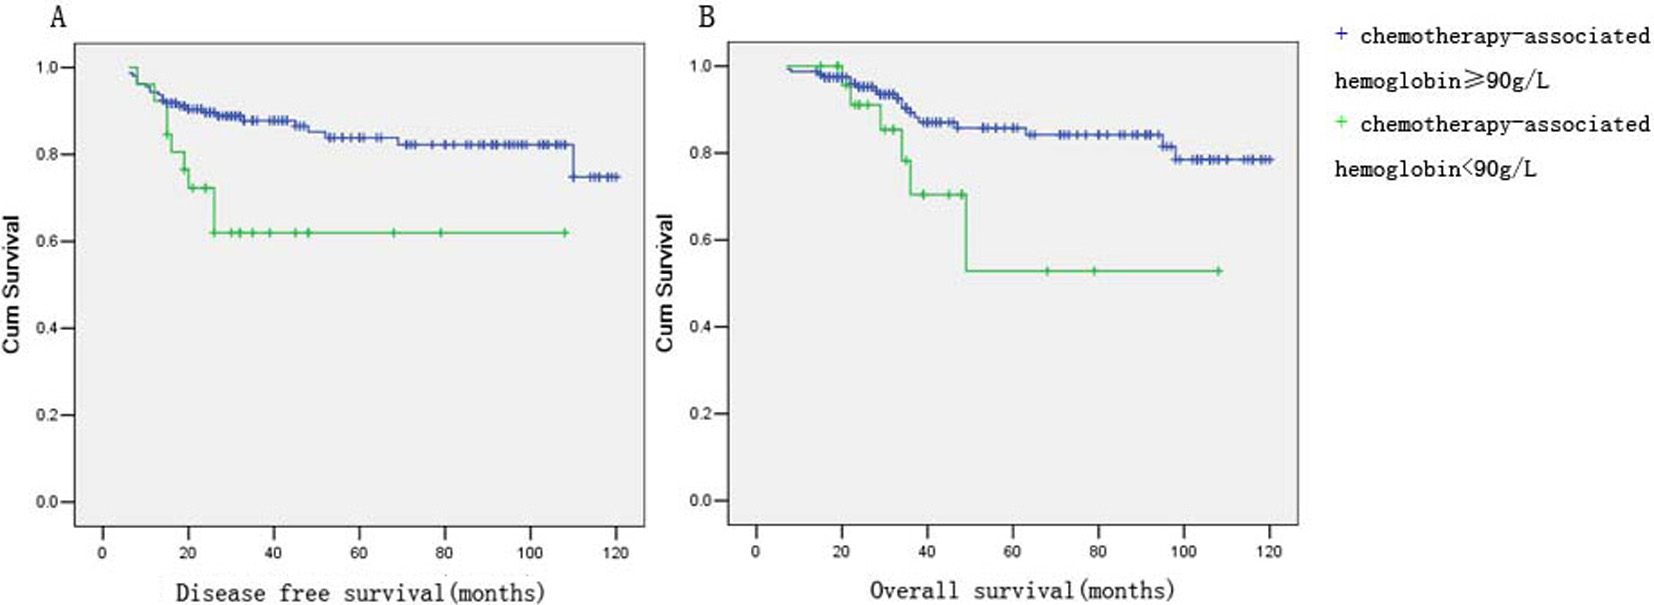
DFS or OS curve of stage II colorectal cancer by Kaplan-Meier method. (A) Chemotherapy-associated hemoglobin 90 g/L was associated with shorter DFS of stage II colorectal cancer ( 0.004). (B) Chemotherapy-associated hemoglobin 90 g/L was associated with shorter OS of stage II colorectal cancer ( 0.039).
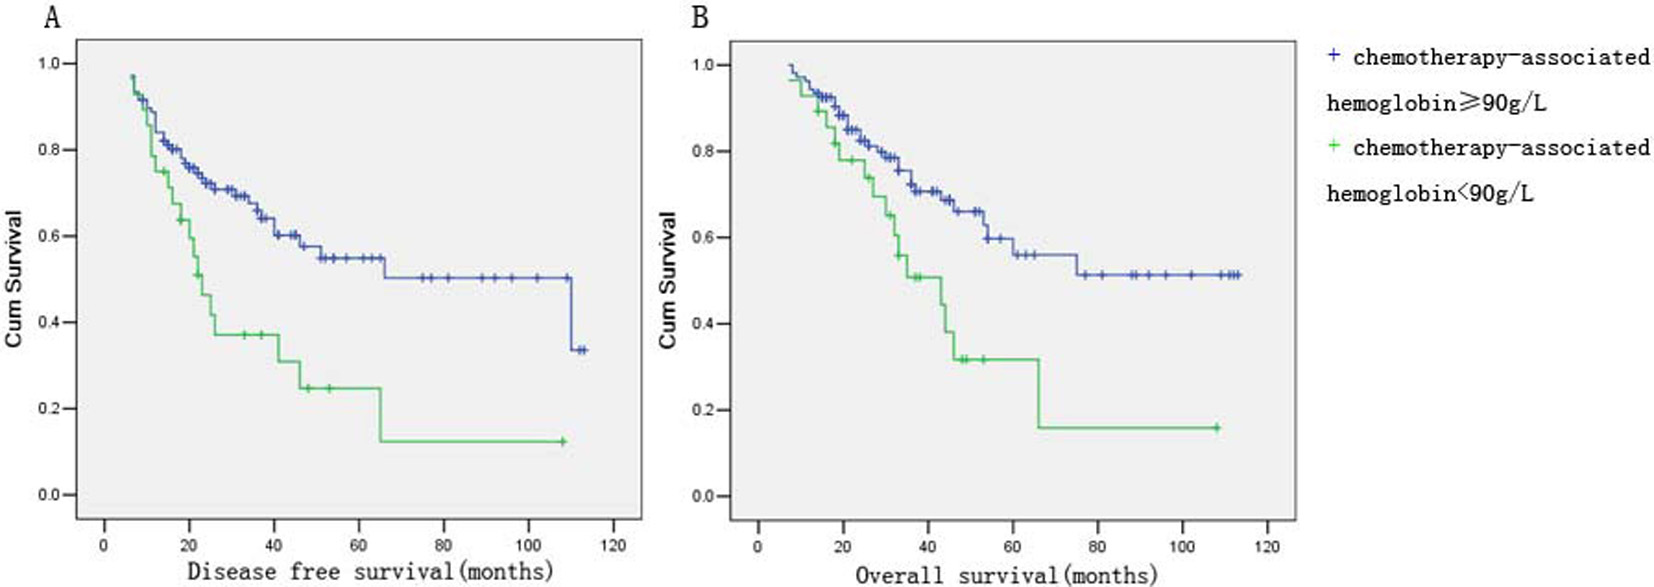
DFS or OS curve of stage III colorectal cancer by Kaplan-Meier method. (A) Chemotherapy-associated hemoglobin 90 g/L was associated with shorter DFS of stage II colorectal cancer ( 0.002). (B) Chemotherapy-associated hemoglobin 90 g/L was associated with shorter OS of stage II colorectal cancer ( 0.008).
To control the possible confounding of the main effects of chemotherapy-associated hemoglobin 90 g/L, chemotherapy-associated hemoglobin change 30 g/L on DFS/OS, respectively, the clinicopathological factors (pretreatment albumin, pretreatment CEA, differentiation, sex, age, location, stage, baseline hemoglobin and chemotherapy-associated lymphocytes) were further adjusted for in the multivariate cox regression model. As shown in Table 5, cox model showed no association of chemotherapy-associated hemoglobin change 30 g/L and DFS (HR, 2.063; 95% CI 0.929–4.583), OS (HR, 1.386; 95% CI 0.553–3.471). Moreover, cox regression model showed no association of baseline hemoglobin (pre-chemotherapy hemoglobin levels) and DFS (HR, 1.004; 95% CI 0.987–1.022), OS (HR, 1.006; 95% CI 0.987–1.025). However, cox regression model showed chem- otherapy-associated hemoglobin 90 g/L remained the independent prognostic factor for DFS (HR, 2.221; 95% CI 1.157–4.262), OS (HR, 2.058; 95% CI 1.009–4.197). However, Kaplan-Meier method showed chemotherapy-associated hemoglobin 90 g/L was associated with shorter DFS ( 0.0001) and OS ( 0.0001) of stage II and III CRC (Fig. 2). Moreover, Kaplan-Meier method showed chemotherapy-associated hemoglobin 90 g/L was associated with shorter DFS ( 0.004) and OS ( 0.039) of stage II CRC (Fig. 3), shorter DFS ( 0.002) and OS ( 0.008) of stage III CRC (Fig. 4), respectively.
Discussion
Anemia may lead to the more progressive phenotype and the worse survival in malignancy. Preoperative anemia has been proved to be associated with the advanced stage and the worse survival in endometrial carcinomas [7]. Similarly, preoperative anemia is associated with lymph node metastasis, lymphovascular invasion, recurrence-free and cancer-specific survival in upper tract urothelial carcinoma [13]. Moreover, the impacts of pretreatment hemoglobin on progression, survival have been found in advanced esophageal cancer [14], breast cancer [20], hepatocellular carcinoma [20], nasopharyngeal carcinoma [20] and esoph- ageal carcinoma [20]. However, the data about the association of hemoglobin variation induced by myelosuppression therapy and survival in cancer are few. In our study, the multivariate cox regression model showed the risk effect of chemotherapy-associated hemoglobin on survival of CRC was independent of pretreatment hemoglobin, chemotherapy-associated lymphopenia. To the best of our knowledge, our study, for the first time, reported the association of chemotherapy-associated hemoglobin and survival of CRC receiving adjuvant chemotherapy. Our study indicates that while chemotherapy improves survival of CRC, the hemoglobin 90 g/L induced by chemotherapy may drive recurrence or metastasis of CRC, which may partly explain the failure of adjuvant chemotherapy in CRC.
The mechanism for the association of chemothera- py-associated hemoglobin and survival of CRC remains unclear. Anemic patients suffer from poorer tissue oxygenation [21, 22]. Hypoxic microenvironment under anemic condition may be responsible for the tumor recurrence or chemoresistance. Molecular changes in response to hypoxia, such as hypoxia-inducible factors (HIFs) family expression, contribute to carcinogenesis, tumor progression, chemoresistance or radioresistance. Hypoxia activates HIF-1alpha/G-protein estrogen receptor (GPER) signaling pathway involved in VEGF expression, which plays an important role in the formation of tumor microenvironment towards cancer progression [23]. HIF-1 drives hypoxia-induced multidrug resistance (MDR) to chemotherapeutic drugs in laryngeal carcinoma cells [24]. Moreover, Snail1 gene activation regulated by HIF-2 contributes to the effect of hypoxia on melanoma progression [25]. Besides HIFs, FGFR3 expression and OCT4 reduction induced by hypoxia may play the similar role in malignancy [26, 27]. Moreover, the effect of chemotherapy-associated hemoglobin on survival of CRC may be partly explained by the suppression of erythropoiesis leading to the increased hepcidin. Suppression of erythropoiesis increases hepcidin level, the hemolysis and anemia decrease hepcidin expression only when erythropoiesis is functional [28]. The elevated hepcidin might be correlated with carcinogenesis, development of tumor, a metastatic tumor and the poor prognosis [29, 30, 31]. The molecular changes mentioned above may contribute partly to the findings in our study.
According to the National Cancer Institute (NCI) and the World Health Organization (WHO) toxicity criteria, the classification of more severe grades of anemia is the same, but the classification of lesser grades differs slightly [32]. However, based on the findings by Vaupel, hemoglobin levels of less than 120 g/L results in significant tumor hypoxia altering its behavior [33]. Moreover, 120 g/L was used as the cut point of anemia in cancer in some reports [34, 35]. However, when we chose the cut point of 120 g/L in the present study, no impact of chemotherapy-associated hemoglobin 120 g/L on the survival of CRC was found(data not shown). Our study showed the best cut point of chemotherapy-associated hemoglobin was 90 g/L for DFS, OS and Cox regression model confirmed the prognostic value of chemotherapy-associated hemog- lobin 90 g/L for DFS, OS. Thus, it is reasonable that 90 g/L may be the reliable cut point affecting worse DFS/OS, respectively, for stage II and III CRC receiving adjuvant chemotherapy.
The hemoglobin cut point defined by ROC analysis has important clinical significance in adjuvant CRC chemotherapy. First, CRC cases undergoing FOLFOX regimen receive the standard dose according to the body surface area, however, under the given dose, the hemoglobin change response to adjuvant chemotherapy differs in different subpopulations. The dose will be reduced only if the patients suffer from severe toxicity such as III grade or more severe anemia (hemoglobin 80 g/L). The cut point of chemothe- rapy-associated hemoglobin 90 g/L selected in our study may provide another indication to reduce the dose of FOLFOX regimen for CRC. Thus it is significant in the individualized treatment of CRC chemotherapy. Second, the intervention threshold of hemoglobin in malignancy varied [36, 37], thus the cut point in our study suggest the simple indication for the treatment of anemia. Those who have chemotherapy-associated hemoglobin below the cut point should undergo active management to remain the hemoglobin above the cut point.
We propose chemotherapy-associated hemoglobin 90 g/L, but not baseline hemoglobin, or chemothe- rapy-associated hemoglobin change, as the potential prognostic factor for CRC receiving adjuvant chemo- therapy. Hemoglobin 90 g/L induced by chemotherapy may play a more important role than pretreatment hemoglobin in the prognosis of CRC receiving adjuvant chemotherapy. Moreover, our findings extend the clinical significance of chemotherapy-associated hemoglobin by analyzing the cut points to guide the individualized adjuvant chemotherapy in CRC. However, the sample size was relatively small in the present study. We await the larger, multicenter study to prove the cut points selected by our study.
Conflict of interest
The authors have no conflict of interest to declare.
Footnotes
Acknowledgments
This work was supported by the National Natural Science Foundation of China Grants (81672436 to Wei Yi-Sheng) and the Scientific and Technological Programme of Guangdong Grants (2013B021800185 to Wei Yi-Sheng).
References
1.
KocarnikJ.M.ShiovitzS. and PhippsA.I., Molecular phenotypes of colorectal cancer and potential clinical applications, Gastroenterol Rep (Oxf)3(4) (2015), 269–276.
2.
RoxburghC. et al., Adjuvant chemotherapy for resected colon cancer: comparison of the prognostic value of tumour and patient related factors, Int J Colorectal Dis26(4) (2011), 483–492.
3.
McClearyN.J. et al., Impact of age on the efficacy of newer adjuvant therapies in patients with stage II/III colon cancer: findings from the ACCENT database, J Clin Oncol31(20) (2013), 2600–2606.
4.
LeeD.W. et al., Prognostic implication of mucinous histology in colorectal cancer patients treated with adjuvant FOLFOX chemotherapy, Br J Cancer108(10) (2013), 1978–1984.
5.
DugumM. et al., Recurrence and survival rates of inflammatory bowel disease-associated colorectal cancer following postoperative chemotherapy: A comparative study, Gastroenterol Rep (Oxf) (2016) [Epub ahead of print].
6.
AkinbamiA. et al., Full blood count pattern of pre-chemotherapy breast cancer patients in Lagos, Nigeria, Caspian J Intern Med4(1) (2013), 574–579.
NagemR.BicalhoL.G. and LourencoL.G., Surgical treatment of gastric cancer in a community hospital in brazil: Who are we treating and how?J Gastrointest Cancer44(4) (2013), 410–416.
9.
LuX.F., Clinical hematological examination, in: Diagnostics 8th edition, Bei Jing: People’s Medical Publishing House Co. LtdWanX.H. and LuX.F., editors, 2014, 244–284.
10.
MerliniL. et al., Anemia prevalence and treatment practice in patients with non-myeloid tumors receiving chemotherapy, Cancer Manag Res5 (2013), 205–214.
11.
ChawlaS.P. et al., Results of a phase I dose escalation study of eltrombopag in patients with advanced soft tissue sarcoma receiving doxorubicin and ifosfamide, BMC Cancer13 (2013), 121.
12.
UncuD. et al., Results of adjuvant FOLFOX regimens in stage III colorectal cancer patients: Retrospective analysis of 667 patients, Oncology84(4) (2013), 240–245.
13.
RinkM. et al., Impact of preoperative anemia on oncologic outcomes of upper tract urothelial carcinoma treated with radical nephroureterectomy, J Urol191(2) (2014), 316–322.
14.
HamaiY. et al., Treatment outcomes and prognostic factors for thoracic esophageal cancer with clinical evidence of adjacent organ invasion, Anticancer Res33(8) (2013), 3495–3502.
15.
AlexiusdottirK.K. et al., Colon cancer: Association of histopathological parameters and patients’ survival with clinical presentation, Apmis121(10) (2013), 901–907.
16.
HongC.Y. et al., The impact of chemotherapy-associated neutrophil/lymphocyte counts on prognosis of adjuvant chemotherapy in colorectal cancer, BMC Cancer13 (2013), 177.
17.
WilliamsB.A. et al., Finding optimal cutpoints for continuous covariates with binary and time-to-event outcomes, Technical Report Series #79 (2006).
18.
AltmanD.G. et al., Dangers of using “optimal” cutpoints in the evaluation of prognostic factors, Journal of the National Cancer Institute86(11) (1994), 829–835.
19.
ContalC. and O’QuigleyJ., An application of changepoint methods in studying the effect of age on survival in breast cancer, Computational Statistics and Data Analysis30 (1999), 253–270.
20.
QiuM.Z. et al., Incidence of anemia, leukocytosis, and thrombocytosis in patients with solid tumors in China, Tumour Biol31(6) (2010), 633–641.
21.
VaupelP.MayerA. and HockelM., Oxygenation status of primary and recurrent squamous cell carcinomas of the vulva, Eur J Gynaecol Oncol27(2) (2006), 142–146.
22.
VaupelP.MayerA. and HockelM., Impact of hemoglobin levels on tumor oxygenation: The higher, the better? Strahlenther Onkol182(2) (2006), 63–71.
23.
De FrancescoE.M. et al., HIF-1alpha/GPER signaling mediates the expression of VEGF induced by hypoxia in breast cancer associated fibroblasts (CAFs), Breast Cancer Res15(4) (2013), R64.
24.
LiD.W. et al., Hypoxia induced multidrug resistance of laryngeal cancer cells via hypoxia-inducible factor-1alpha, Asian Pac J Cancer Prev14(8) (2013), 4853–4858.
25.
LiuS. et al., Snail1 mediates hypoxia-induced melanoma progression, Am J Pathol179(6) (2011), 3020–3031.
26.
BlickC. et al., Hypoxia regulates FGFR3 expression via HIF-1alpha and miR-100 and contributes to cell survival in non-muscle invasive bladder cancer, Br J Cancer109(1) (2013), 50–59.
27.
WuY.C. et al., Chemotherapeutic sensitivity of testicular germ cell tumors under hypoxic conditions is negatively regulated by SENP1-controlled sumoylation of OCT4, Cancer Res72(19) (2012), 4963–4973.
28.
VokurkaM. et al., Hepcidin mRNA levels in mouse liver respond to inhibition of erythropoiesis, Physiol Res55(6) (2006), 667–674.
29.
WardD.G. et al., Increased hepcidin expression in colorectal carcinogenesis, World J Gastroenterol14(9) (2008), 1339–1345.
30.
KamaiT. et al., Increased serum hepcidin-25 level and increased tumor expression of hepcidin mRNA are associated with metastasis of renal cell carcinoma, BMC Cancer9 (2009), 270.
31.
PinnixZ.K. et al., Ferroportin and iron regulation in breast cancer progression and prognosis, Sci Transl Med2(43) (2010), 43ra56.
32.
GroopmanJ.E. and ItriL.M., Chemotherapy-induced anemia in adults: Incidence and treatment, J Natl Cancer Inst92(60) (1999), 1616–1634.
33.
VaupelP. et al., Oxygenation status of gynecologic tumors: What is the optimal hemoglobin level? Strahlenther Onkol178(12) (2002), 727–731.
34.
PanagopoulosN.D. et al., Influence of blood transfusions and preoperative anemia on long-term survival in patients operated for non-small cell lung cancer, Lung Cancer62(2) (2008), 273–280.
35.
KhanA.A. et al., Association between pretreatment haemoglobin levels and morphometric characteristics of the tumour, response to neoadjuvant treatment and long-term outcomes in patients with locally advanced rectal cancers, Colorectal Dis15(10) (2013), 1232–1237.
36.
TruongP.T. et al., Population-based analysis of the frequency of anemia and its management before and during chemotherapy in patients with malignant lymphoma, Am J Clin Oncol33(5) (2010), 465–468.
37.
VansteenkisteJ. et al., Darbepoetin alfa for treating chemotherapy-induced anemia in patients with a baseline hemoglobin level < 10 g/dL versus > or = 10 g/dL: An exploratory analysis from a randomized, double-blind, active-controlled trial, BMC Cancer9 (2009), 311.