To explore the influence of Beclin-1 on vasculogenic mimicry (VM) induced by hypoxia in glioma.
METHODS:
CD34-PAS staining was carried out to observe VM formation, and immunohistochemistry was used to determine the expression levels of Beclin-1, HIF-1, VEGF and MMP2 in 105 patients with primary glioma. Human glioma U87MG cells were divided into Normoxia, Hypoxia, Hypoxia NC siRNA and Hypoxia Beclin-1 siRNA groups. Cobalt chloride (CoCl) was used to stimulate hypoxic conditions, and a VM tube formation assay was used to detect VM formation. Wound healing and Transwell invasion assays were used to detect the invasive and migratory abilities of U87MG cells, respectively. Fluorescent LC3 puncta analysis was performed to examine the status of autophagic flux. Expression levels of Beclin-1 and VM-related molecules were determined using real-time quantitative-polymerase chain reaction (RT-qPCR) and western blotting.
RESULTS:
There were 34 VM-positive cases and 71 VM-negative cases among 105 glioma patients, and VM formation was correlated with pathological grade and the expression of Beclin-1, HIF-1, VEGF and MMP2. Positive relations were found between Beclin-1 and the expression of HIF-1, VEGF and MMP2. Under hypoxic conditions, significant increases in the total length of tubes, migration rate, invasion cell number and expression of VM-related molecules were found in U87MG cells. Silencing Beclin-1 markedly decreased hypoxia-induced VM formation and the invasive and migratory abilities, together with the expression of VM-related molecules, in U87MG cells and significantly inhibited the autophagic flux.
CONCLUSION:
Silencing Beclin-1 can attenuate hypoxia-induced VM formation and the metastatic ability of U87MG cells and is a potential target for VM inhibition in glioma.
Glioma, one of the most typical primary central nervous system tumors, accounts for approximately 70% of all primary intracranial tumors [1] and possesses the characteristics of high mortality and recurrence rates, uncontrollable invasion and migration, and strong angiogenesis, in addition to being the cause of widespread hypoxia [2, 3]. In spite of considerable medical and surgical improvements, glioma patients still experience poor prognoses [4, 5]. As is well known, tumor growth and progression are relatively complex procedures that rely on a variety of biological elements, such as the level of hypoxia in the microenvironment of the tumor, which is a hallmark of tumor tissues that is mainly due to the faster growth of tumor cells compared to the capillaries in the neoplasm, thereby resulting in tumor tissue hypoxia [6]. In response to this hypoxia, the new blood vessels that form within tumors, through a variety of mechanisms, are necessary to support proliferating tumor cells or malignant expansion [7]. Vasculogenic mimicry (VM), a novel form of the tumor angiogenesis model, is a ‘VM’ structure of orderly differentiation and arrangement of tumor cells, which provides sufficient blood supply, nutrients, oxygen and invasive channels to facilitate the growth and metastasis of tumors [8, 9]. In addition, previous reports have identified the existence and clinical significance of VM in various malignant tissues, and VM possibly functions as an independent adverse prognostic factor associated with the degree of malignancy and prognosis of patients with various tumors [8, 10], including glioma [11]. Thus, inhibition of VM formation may provide a new direction for the treatment of glioma.
Autophagy, one of the lysosomal degradation pathways, refers to a cellular process in which cells degrade their damaged organelles and macromolecules by utilizing lysosomes, thus playing a significant role in maintaining homeostasis and protein metabolism [12]. Evidence has shown that intracellular autophagy activity might be activated when tumor cells are under hypoxic conditions, consequently contributing to accelerated VM formation; for example, an article stated that autophagy was likely associated with VM and the metastasis of melanoma [13]. Beclin-1, the first autophagy-specific gene, was located on chromosome 17q21 in mammals [14]. As a haploinsufficient tumor suppressor [15], Beclin-1 is generally expressed at low levels in various tumor tissues, such as lung cancer [16], oral cancer [15], and cervical cancer [17]. Noticeably, Ding et al. found that during the process of VM formation, Beclin-1 expression was significantly enhanced, and inhibition of Beclin-1 can suppress both VM formation and the expression of genes related to VM formation [18]. However, whether Beclin-1 could affect VM formation in glioma has not yet been studied. Therefore, this study recruited 105 glioma patients in order to observe VM formation and Beclin-1 expression via CD34-PAS double staining and immunohistochemistry. Transfection of a specific siRNA of Beclin-1 in U87MG cells invitro was carried out to investigate the influence of Beclin-1 on hypoxia-induced VM formation in glioma.
Materials and methods
Ethics statement
This study strictly obeyed the Declaration of Helsinki [19]. All patients were informed and signed the informed consent, and this study was approved by the Ethics Committee of the Clinical Laboratory of Jingzhou Central Hospital.
Study objects
Our study population consisted of 105 patients with primary glioma, aged 17 to 70 years old, with a mean age of 47.57 16.25 years who were admitted to Jingzhou Central Hospital between April 2014 and April 2016. Two neuropathologists were recruited to examine tumor sections in order to ensure that the diagnosis of glioma followed the World Health Organization (WHO) criteria from 2000 [20]. The inclusion criteria were as follows: patients had not accepted any radiotherapy, chemotherapy or immunotherapy before surgery; had a pathologically confirmed glioma; and had complete clinical and pathological data. Once collected, the fresh surgical specimens from the patients were immediately snap-frozen in liquid nitrogen.
Immunohistochemistry
Tumor tissue sections were prepared for deparaffinization in xylene and hydration following standard procedures [21]. Slices were incubated with the following primary antibodies: anti-Beclin-1 [EPR20473] (1/100, ab210498), anti-hypoxia-inducible factor (HIF)-1 (1/200, ab113642), anti-vascular endothelial growth factor (VEGF, 5 g/ml ab1316) and anti-matrix metalloproteinase 2 (MMP2, 2 g/ml, ab37150). All antibodies were purchased from Abcam Inc., Cambridge, MA, USA. Under a microscope (Leica, Newcastle, UK), five visual fields were randomly selected in each tissue section to count the number of stained cells and the total number of cells, and the ratio of stained to total cells was subsequently calculated. Scores for the stained cell ratio were as follows: 10% referred to negative or weakly positive (), 10–50% referred to strongly positive (), and 50% indicated very strongly positive (). Here, the rating was used to represent low expression, while both the and ratings were used to represent high expression.
CD34-PAS double staining
Tumor tissues were fixed in 10% formaldehyde solution, embedded in paraffin and cut into a series of slices. The slices were baked at 60C for 1 h and then dewaxed by xylene. After hydration with gradient ethanol and distilled water, slices were boiled in citrate buffer (pH 6) for 15 min to inactivate endogenous peroxidase. Then, diluted anti-CD34 rabbit anti-mouse primary antibody (1: 30, ab81289, Abcam) and the corresponding secondary antibody were added to the slices, followed by diaminobenzidine (DAB) staining (Beijing Zhongshan Jinqiao Biotechnology Co., Ltd.; Beijing, China) and hematoxylin counterstaining. After dehydration by gradient ethanol, the slices were sealed with neutral gum. Under a light microscope (Nikon ECLIPSE 55i Microscope, Tokyo, Japan), gloea or nuclei containing brown granules were considered positive cells, as blood vessel endothelium was stained. After the slices were washed with running water, they were oxidized in 0.5% periodic acid for 8–15 min. After 3 min of washing with running water, the slices were placed in Schiff solution and reacted with periodic acid-Schiff (PAS) solution in the dark for 15–30 min, followed by washing with distilled water 3 times (1 min/time). After 3–5 min of washing with running water, the slices were lightly stained by hematoxylin for 1–2 min, washed with running water for 2 min, differentiated, returned to blue, dehydrated, transparentized and sealed. We used a microscope to observe the staining, vascular morphology and VM expression in each specimen. For tissue slices, different fields were randomly selected to take photos for observation, counting and comparison. The experiment was repeated 3 times.
Cell culture and hypoxia treatment in vitro
Human glioma U87MG cells were purchased from American Type Culture Collection (ATCC, Manassas, VA, USA). The cells were incubated with dulbecco’s modified Eagle medium (DMEM, HyClone), which contained 10% fetal calf serum supplemented with 100 mg/L penicillin and 100 mg/L streptomycin, at 37C with 5% CO in saturated humidity. We used cobalt chloride (CoCl) to produce the hypoxic conditions, and the cells were plated in dishes or plates at 300 cells/mm. After 24-h culture in complete medium, we removed the medium, washed the cells with PBS, treated the cells with 100 M CoCl and incubated them for different times as needed.
Grouping and transfection
The cells in the logarithmic phase were digested by trypsin and seeded in 6-well plates at a concentration of 3 10 cells/well. As the cell density reached 70–90%, the medium was replaced with serum-free and antibody-free medium. Cells were divided into a Normoxia group, a Hypoxia group, a Hypoxia NC siRNA group and a Hypoxia Beclin-1 siRNA group. SignalSilence Beclin-1 siRNA II (#6246) was bought from Cell Signaling Technology (CST) (Danvers, MA, USA). Lipofectamine 2000 (Invitrogen Inc., California, USA) was used to carry out transfection.
VM tube formation assay
We used a refrigerator to thaw Matrigel matrix (Corning Matrigel basement membrane matrix, Corning, USA) on ice overnight the day before conducting the VM tube formation assay. Then, we added Matrigel to a 48-well plate to form a gel for 2 h at 37C, followed by seeding cells into the wells at a concentration of 2 10 cells/well. A Leica fluorescence inverted microscope was used to take photos of the cultures 24 hours later. Then, the total length of the tubes per field in five randomly selected samples of 100 scopes each was counted to quantify the capability of VM formation via the Leica application suite v3.60 (LEICA Microsystem). We conducted every experiment in triplicate.
Wound healing
A marking pen was used to mark 3 parallel lines on the back of the 12-well plate. Each well was seeded with 5 10 cells/well. We used a spearhead to scratch in the well along the vertical line of the back as soon as the cells covered the well evenly, followed by washing with phosphate-buffered saline (PBS). We continued to culture the cells with new medium. The light microscope was used to observe and take photos at 0 h and 24 h, and we monitored the migration rate (MR) 24 h later. Here, the MR (d d)/d (d is the length of the wound at 0 h, and d is the length at 24 h) [10]. The experiment was repeated 3 times.
Transwell invasion assay
The cells in the logarithmic growth phase were digested by trypsin and seeded in the upper chamber covered by Matrigel at a concentration of 8 10 cells/well, which was followed by adding 200 l of serum-free DMEM. A total of 600 l of medium containing 20% fetal calf serum was added to the lower chamber. After a 24-h culture in the incubator at 37C with 5% CO, we removed the upper chamber, removed the medium and carefully wiped the non-migrating cells with a cotton swab. Cells in the lower chamber were fixed in 4% paraformaldehyde for 30 min, stained with crystal violet and finally washed with PBS. Under an inverted light microscope (Nikon, Tokyo, Japan), we counted the number of invading cells. Every experiment was repeated 3 times.
TRIzol reagent was applied to extract the total RNA as per the manufacturer’s instructions (Invitrogen, Carlsbad, CA, USA). A total of 20 l of oligo (dT) primers supplemented with 5 g of the total RNA was pretreated with RNase-free DNase I before forming cDNA together with a First Strand cDNA Synthesis kit (Thermo Fisher Scientific, Waltham, MA, USA). The reaction system for the PCR was 25 l, which included 0.5 l of diluted cDNA and Taq DNA polymerase. According to the genes published in the GenBank database and the gene sequences in the miRBASE database, primers were designed by the Primer 5.0 software and synthesized by Shanghai Bio-engineering Company. The primer sequences are shown in Table 1. The PCR included an initial denaturation at 94C for 4 min followed by 25–35 cycles, which included denaturation at 94C for 30 s, annealing at 58–68C for 30 s and extension at 72C for 1 min. Then, 1.5% agarose gels were used to analyze the PCR products. With GAPDH as an internal reference, the ratio of gene expression was represented using 2. The experiment was repeated 3 times.
Primer sequences used for quantitative RT-qPCR
Gene
Primers (5’-3’)
Beclin-1
F: AGGTTGAGAAAGGCGAGACAC
R: ATGGGTTTTGATGGAATAGGAG
MMP-2
F: TGATCTTGACCAGAATACCATCGA
R: GGCTTGCGAGGGAAGAAGTT
VE-cadherin
F: AAAGGCTGCTGGAAAATG
R: GGAAGAACTGGCCCTTGTCA
HIF-1
F: AAGTGTACCCTAACTAGCCG
R: TCACAAATCAGCACCAAGC
VEGF
F: TCTGGGCTGTTCTCGCTTCGG
R: AGCAGCAAGGCAAGGCTCCAAT
GAPDH
F: CCATTTGCAGTGGCAAAG
R: CACCCCATTTGATGTTAGTG
Note: F: Forward; R: Reverse.
Western blotting
Cells or tissues from each group were added to radioimmunoprecipitation (RIPA) protein lysate on ice to cleave for 15 min and were then centrifuged at 12000 r/min at 4C for 20 min for the supernatant. BCA (Pierce) was used to determine the concentration of the protein. The loading buffer was added to the extracted proteins and boiled at 95C for 10 min, and a sample of 50 g was loaded in each well for protein separation using 10% sodium dodecyl sulfate-polyacrylamide gel electrophoresis (SDS-PAGE). The protein was transferred to a PVDF membrane (Millipore Inc., Beijing, China) and sealed with 5% bull serum albumin (BSA). After the sealing solution was removed, anti-Beclin-1 [EPR20473] (1/1000, ab210498), anti-MMP-2 (0.5 g/ml, ab37150), anti-VE-cad (ab205336, 1/1000), anti-HIF-1 (1/500, ab113642), anti-VEGF (10 g/ml, ab1316) and anti--actin (ab8227, 1/5000) primary antibodies, which were all purchased from Abcam Inc., MA, USA, were added to the membranes. The PVDF membranes were then incubated in a refrigerator at 4C overnight and washed with 1 Tris-buffered saline with Tween (TBST) for 5 min each time. Next, secondary antibody (horseradish peroxidase-labeled goat anti-rabbit, purchased from Shanghai USEN Biotech Co., Ltd.) was added to the PVDF membrane to carry out a 2-h incubation at room temperature, followed by washing with 1 TBST three times. Then, the membranes were immersed in ECL solution (Sigma-Aldrich Corporate, Louis, Missouri, USA) at room temperature for 1 min to observe the results after development and fixation. TotalLab V 2.01 image analysis software (Nonlinear Dynamics Ltd., NC, USA) was used to analyze the gray value of the developed band. The ratio of the gray value of the target band to the reference band was considered the relative expression of the protein. We repeated the experiment 3 times.
Relationship between hypoxia-induced VM formation and clinicopathologic features as well as expressions of Beclin-1, HIF-1, VEGF and MMP2 in patients with glioma
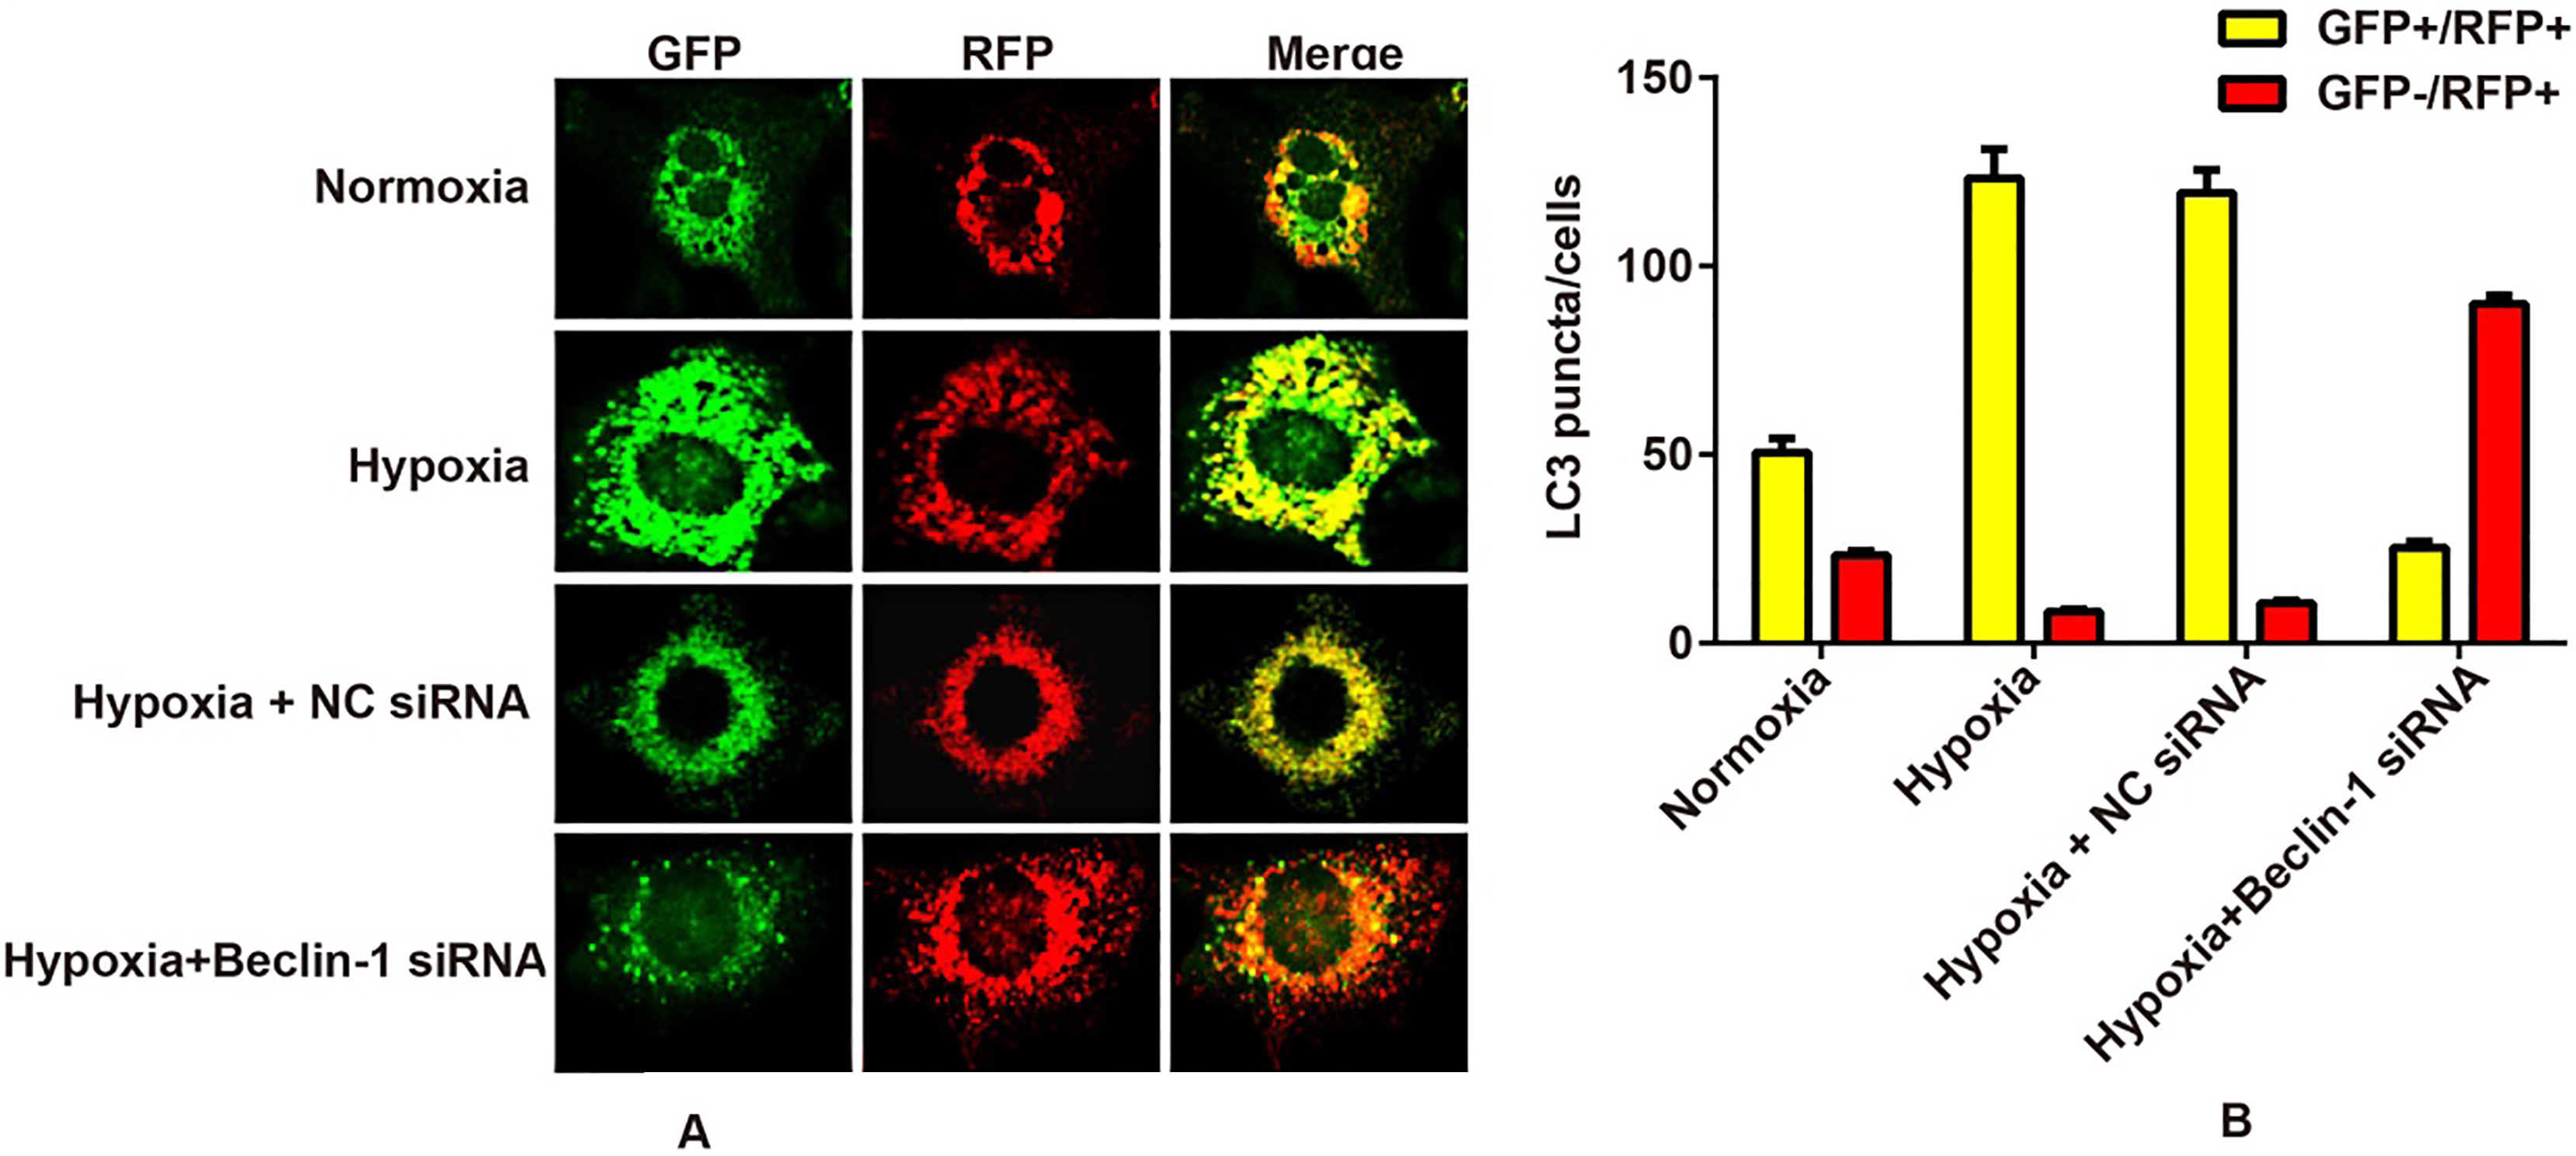
Fluorescent LC3 puncta analysis was performed to examine the status of autophagic flux according to previous guidelines [22]. In brief, U87MG cells were transfected with mRFP-GFP-LC3 plasmid, and the positive cells were selected by adding G418 (Life Technology, CA, USA). Images were acquired with a fluorescent confocal microscope after LC3 was tagged by both green fluorescent protein (GFP) and red fluorescent protein (RFP). The Red and Green Puncta Colocalization Macro of the IMAGEJ program was used for quantification of LC3 puncta [23]. The average numbers of LC3 puncta per cell were counted from the data collected from more than 40 cells. The experiments were repeated three times.
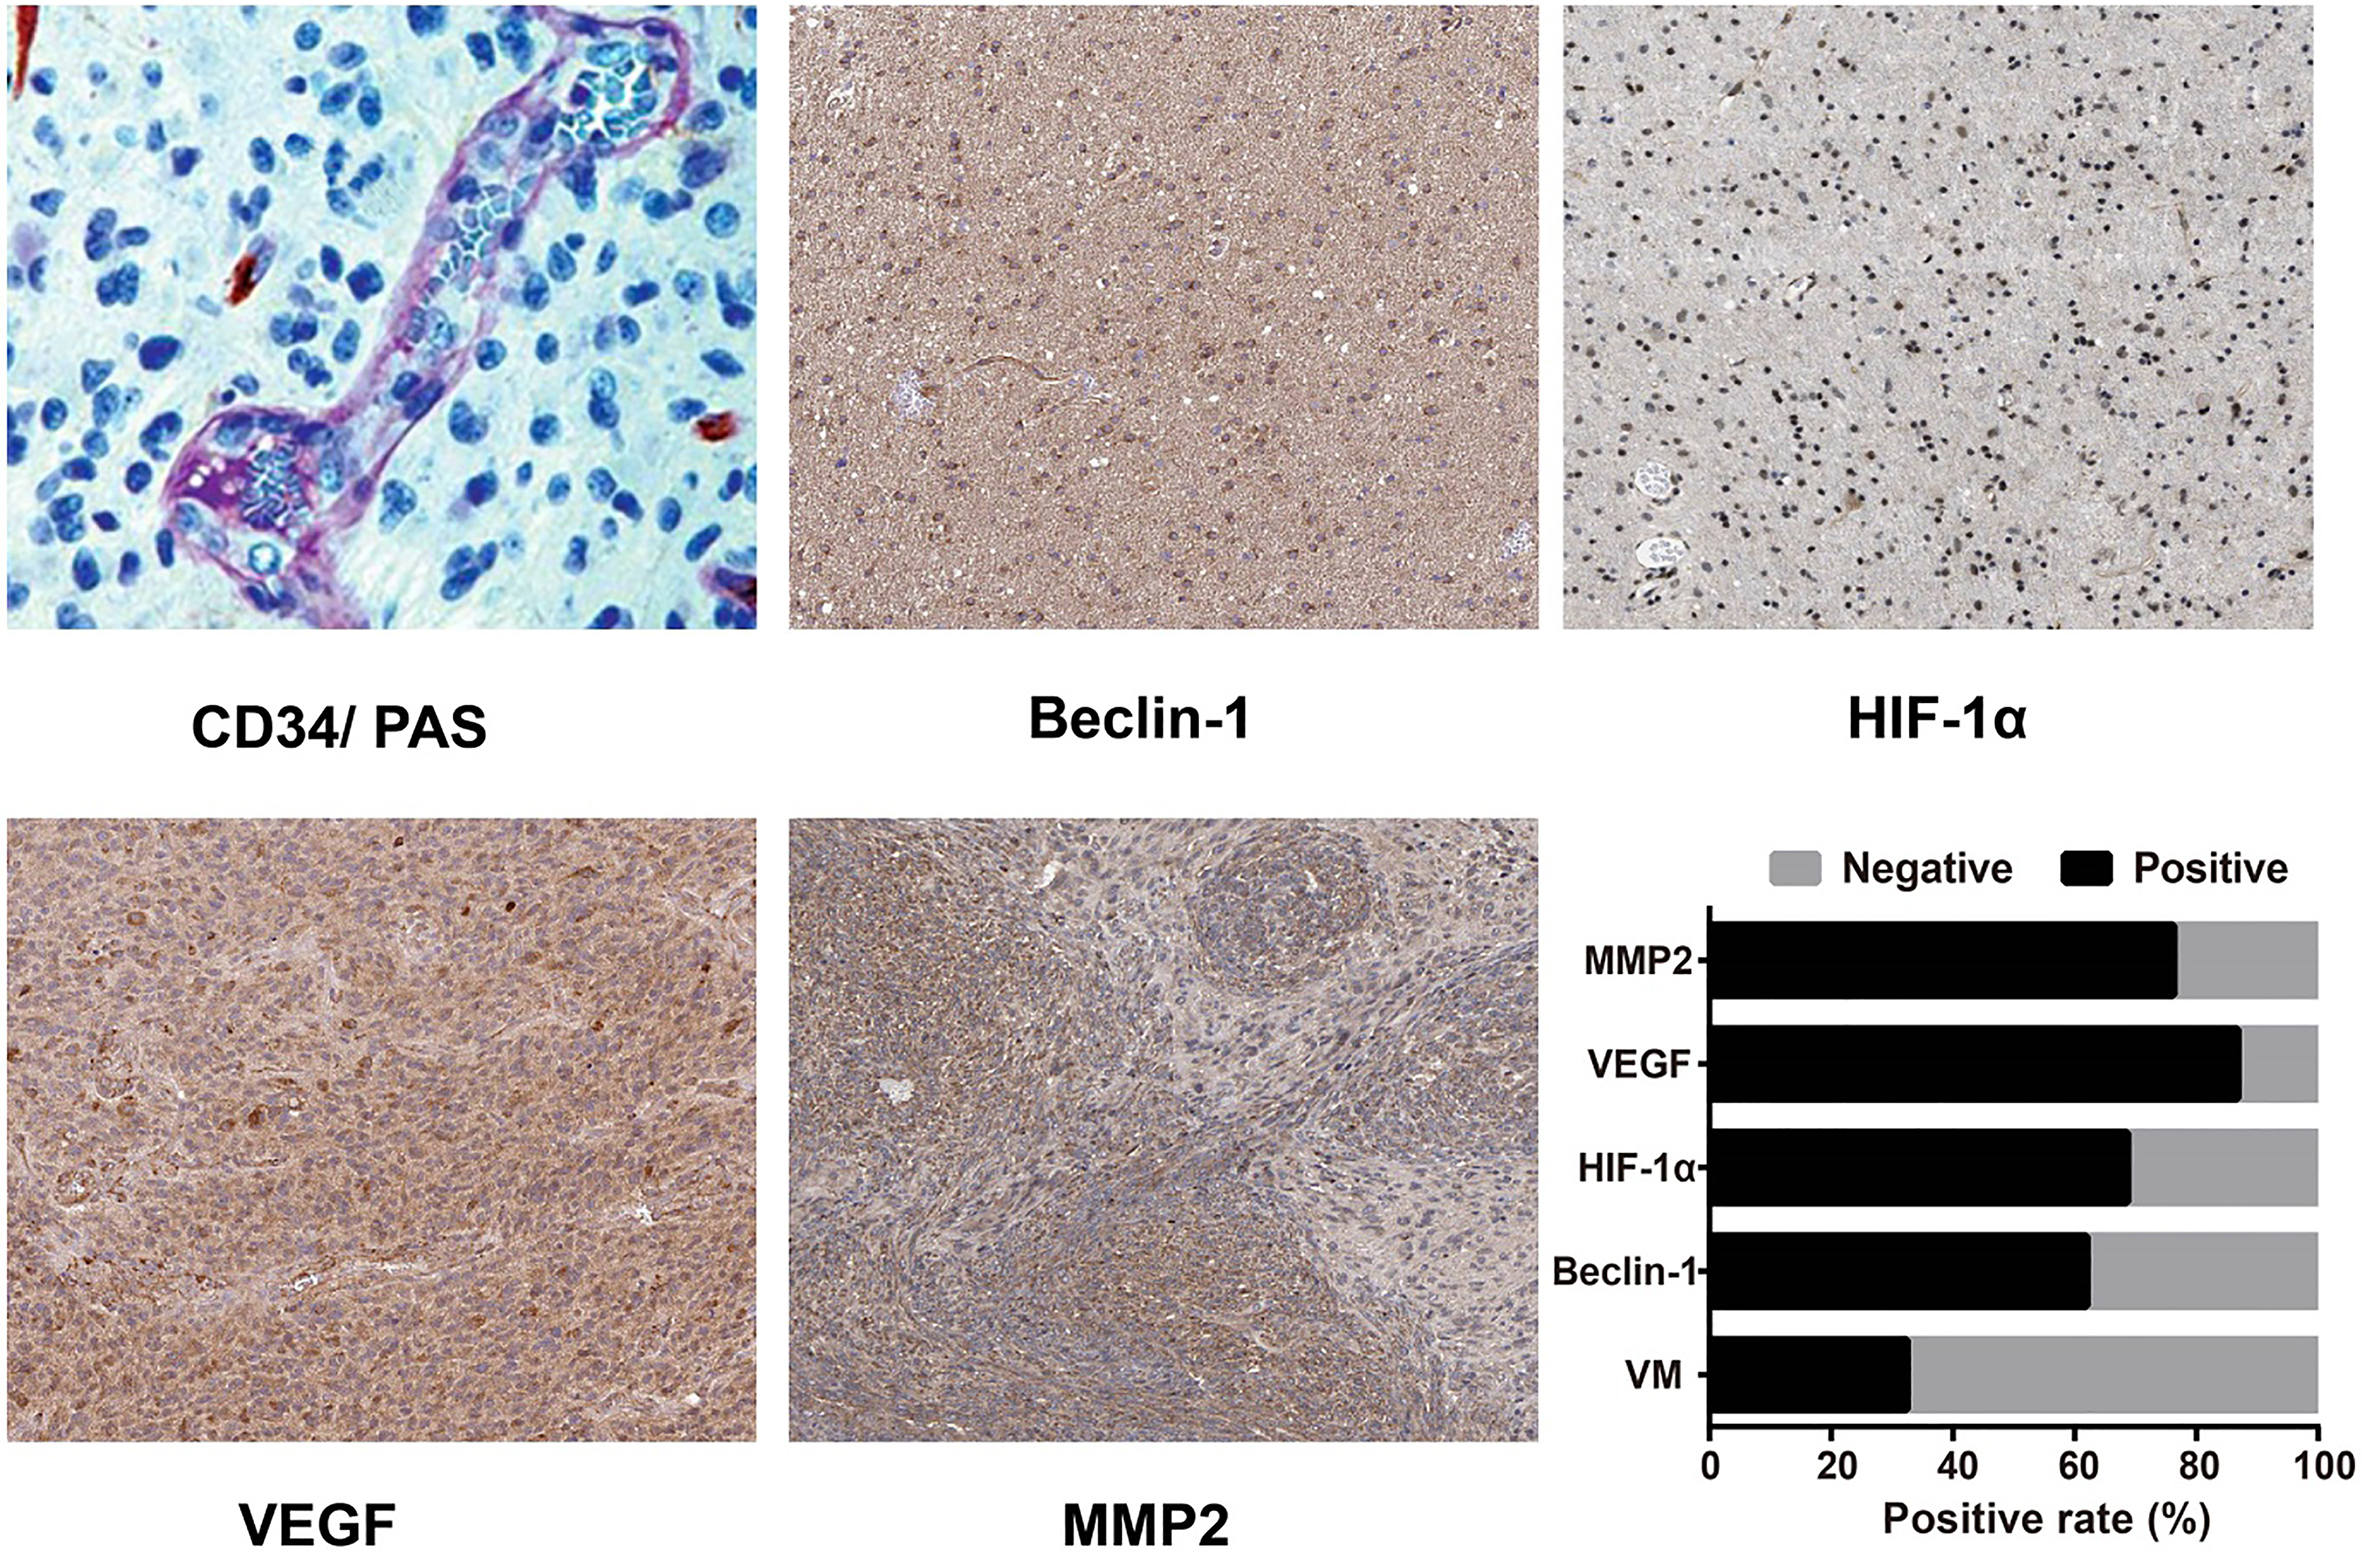
VM-positive expression observed by CD34-PAS double staining and expression of Beclin-1, HIF-1, VEGF and MMP2 as detected by immunohistochemistry.
Statistical analysis
All data were analyzed using SPSS 21.0 (SPSS Inc., Chicago, IL, USA). The measurement data were expressed as the mean of triplicates standard deviation (SD) ( s), and comparisons among groups were analyzed by one-way analysis of variance (ANOVA), while pairwise comparisons between two groups were analyzed using -tests. The comparisons of the enumeration data were analyzed by a test or Fisher’s exact test. The Spearman test was used for the correlation analysis. A value of 0.05 was regarded as statistically significant.
Results
Relationship between hypoxia-induced VM formation and clinicopathologic features and the expression levels of Beclin-1, HIF-1, VEGF and MMP2 in glioma patients
Correlation analysis of Beclin-1 with the expressions of HIF-1, VEGF and MMP2
CD34-PAS double staining results (Fig. 1) showed that there were 34 VM-positive cases (32.38%) and 71 VM-negative cases (67.62%) in the 105 glioma patients. In glioma patients, VM formation was correlated with pathological grade and with the expression levels of Beclin-1, HIF-1, VEGF and MMP2, as suggested in Table 2 ( 0.05). In addition, the positive rates of Beclin-1, HIF-1, VEGF and MMP2, which were measured in glioma patients by immunohistochemistry (Fig. 1), were 61.90%, 68.57%, 86.67% and 76.19%, respectively. The correlation analysis represented in Table 3 demonstrated a positive relation between Beclin-1 and the expression levels of HIF-1, VEGF and MMP2 (all 0.05).
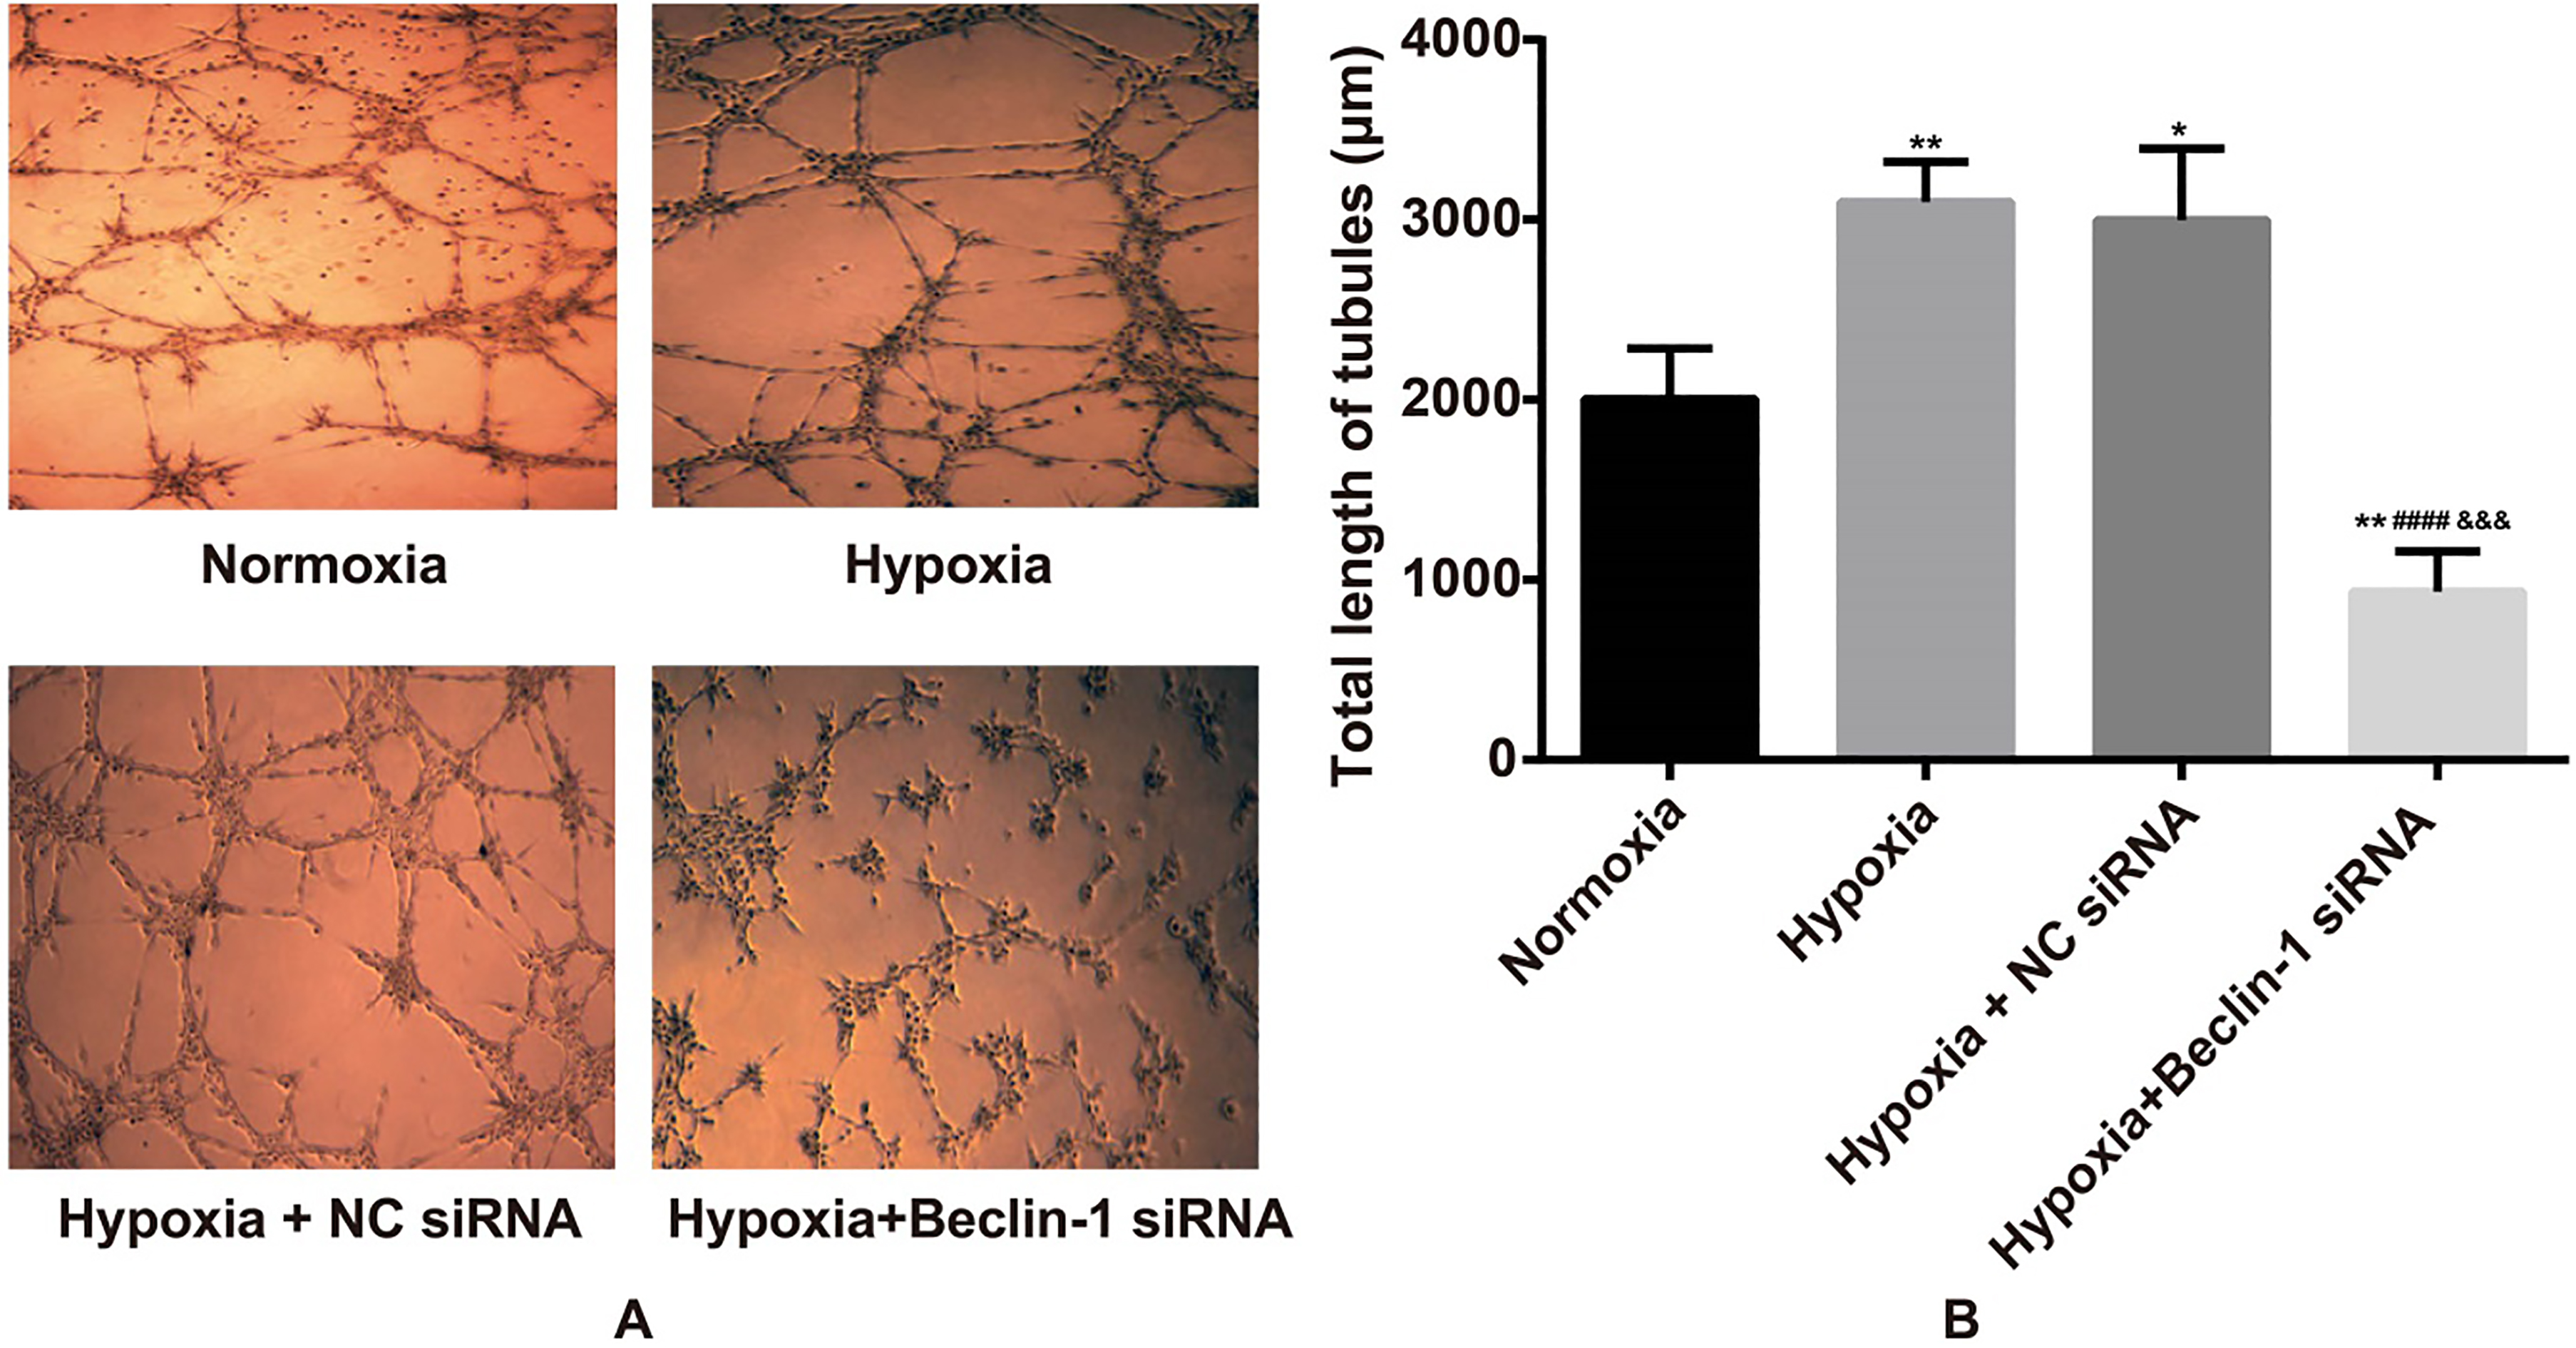
Effects of silencing Beclin-1 on hypoxia-induced VM formation in different groups of U87MG cells as detected by VM tube formation assay. Notes: 0.05, 0.01, compared with the Normoxia group; 0.001, compared with the Hypoxia group; 0.005, compared with the Hypoxia NC siRNA group.
Effects of silencing Beclin-1 on hypoxia-induced VM formation in U87MG cells
As shown in Fig. 2, under hypoxic conditions, the total length of VM tubes in U87MG cells increased significantly compared with that in the Normoxia group ( 0.05). In comparison with the Hypoxia group and the Hypoxia NC siRNA group, Beclin-1 inhibition was found to cause a significant reduction in the total length of VM tubes in U87MG cells under hypoxic conditions, which was substantially lower than that of the Normoxia group (all 0.05). However, the Hypoxia group did not show any significant differences compared with the Hypoxia NC siRNA group ( 0.05).
Effects of silencing Beclin-1 on hypoxia-induced migration and invasion of U87MG cells
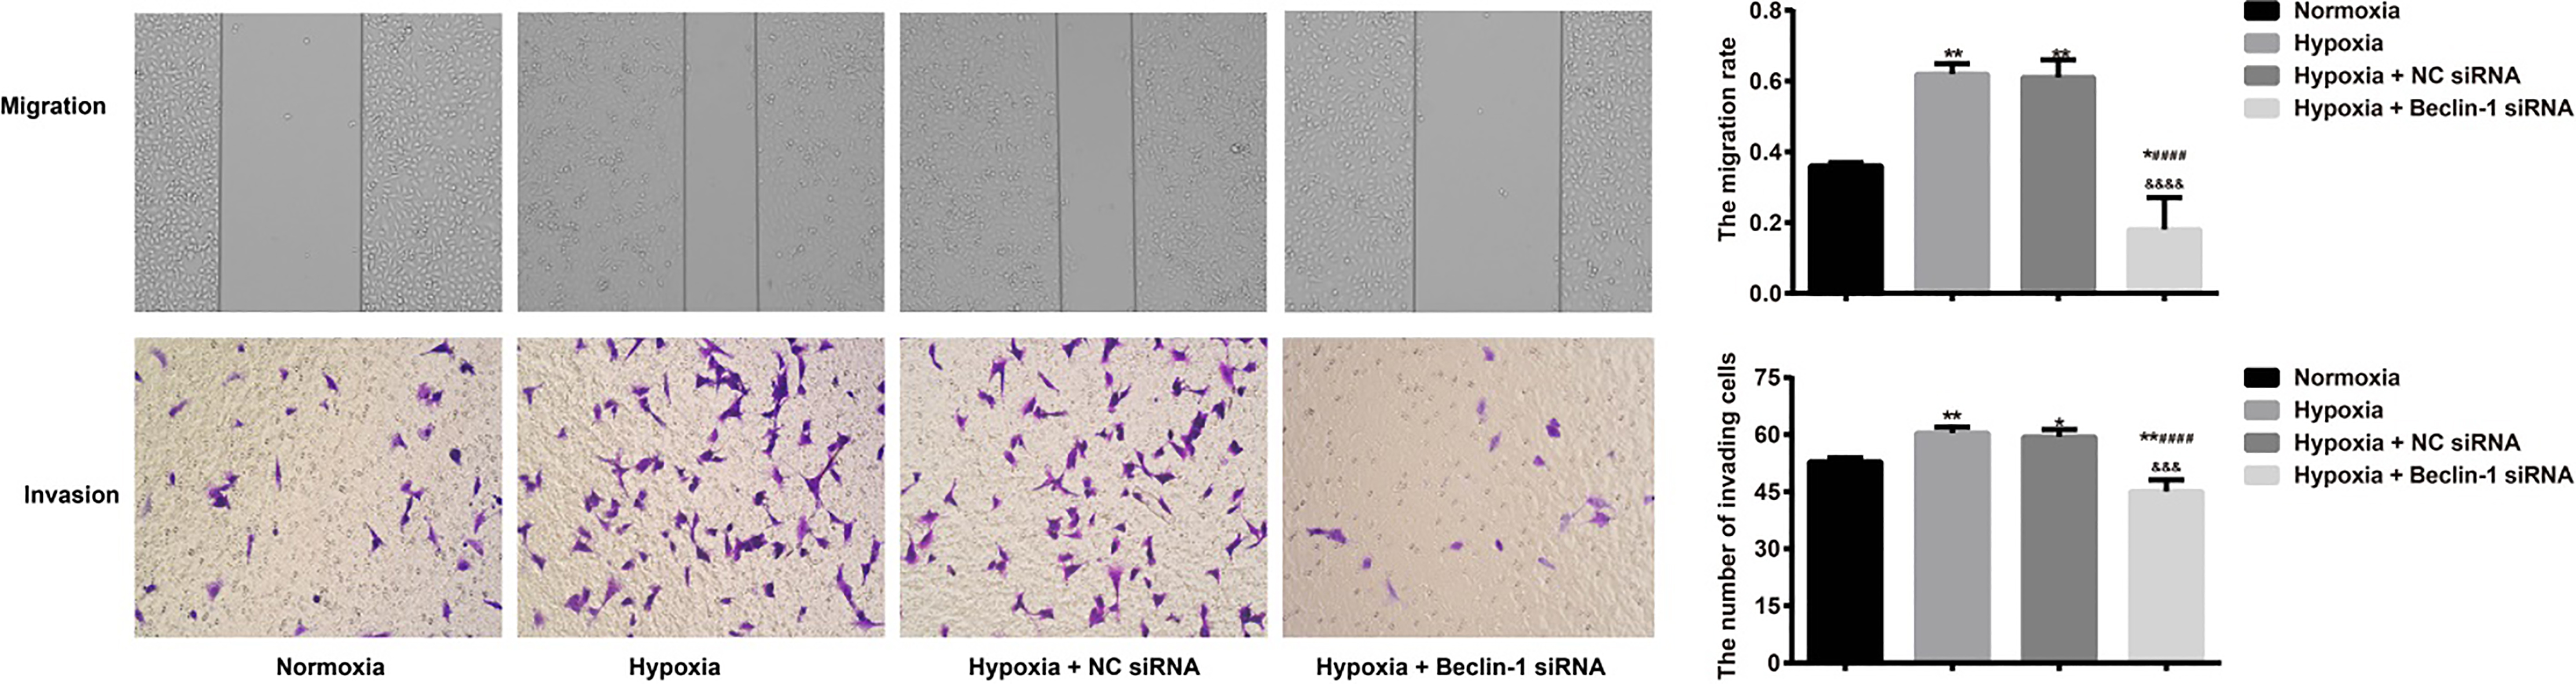
Wound healing and Transwell invasion assays show-ed that, in comparison to the Normoxia group, there was an elevation in the migration rate (MR) and invasion cell number in the Hypoxia group and the Hypoxia NC siRNA group (all 0.05). On the other hand, the migratory and invasive abilities of U87MG cells in the Hypoxia Beclin-1 siRNA group were clearly lowered compared to those in the Hypoxia NC siRNA group (both 0.05) (Fig. 3).
Effects of silencing Beclin-1 on hypoxia-induced migration and invasion in U87MG cells as detected by using wound healing and Transwell invasion assays. Notes: 0.05, 0.01, compared with the Normoxia group; 0.001, compared with the Hypoxia group; 0.005, compared with the Hypoxia NC siRNA group.
Effects of silencing Beclin-1 on VM-related molecules in U87MG cells under hypoxia
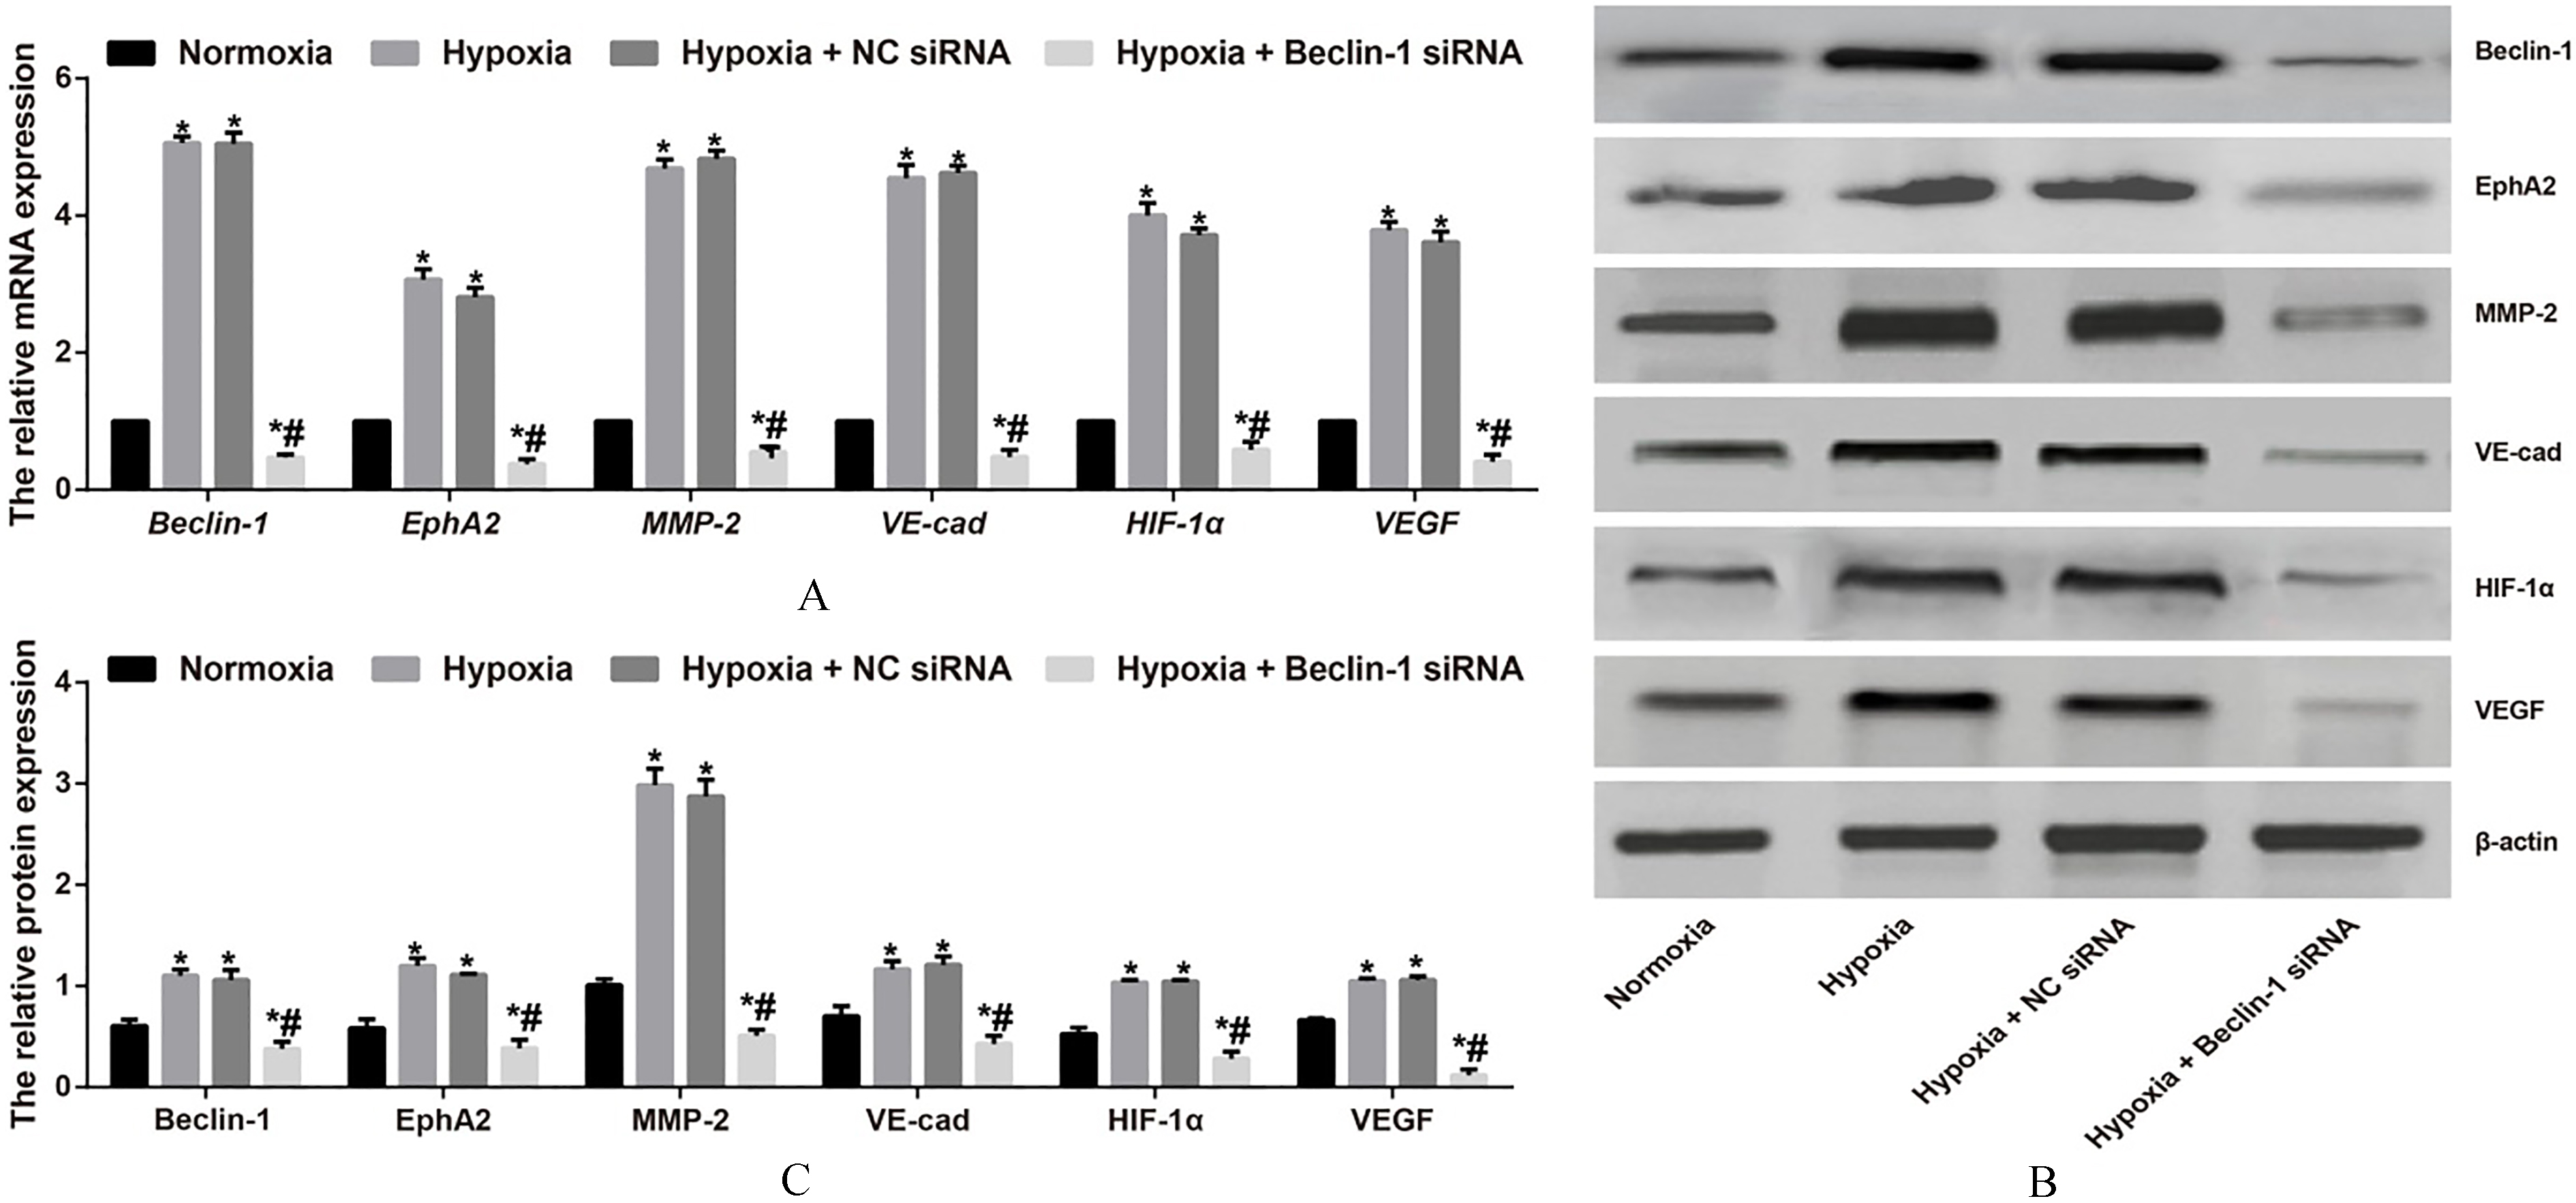
The RT-qPCR results in Fig. 4A show that the mRNA expression levels of Beclin-1 and VM-related molecules, including EphA2, MMP-2, VE-cad, HIF-1 and VEGF, were detected in U87MG cells and were significantly increased in the Hypoxia group compared with those in the Normoxia group (all 0.05). However, when the U87MG cells were treated with Beclin-1 siRNA under hypoxic conditions, the mRNA levels of Beclin-1 and VM-related molecules were reduced in the Hypoxia group (all 0.05). No significant differences were observed in gene and protein expression levels between the Hypoxia group and the Hypoxia NC siRNA group (all 0.05). Furthermore, western blot results demonstrated protein expression patterns similar to those of the mRNAs, which are illustrated in Fig. 4B-C.
Effects of silencing Beclin-1 on VM-related molecules in U87MG cells under hypoxic conditions. Notes: A-C, Relative mRNA expression levels of Beclin-1 and VM-related molecules (EphA2, MMP-2, VE-cad, HIF-1 and VEGF) in U87MG cells in each group were detected using RT-qPCR (A) and western blotting (B-C); 0.05, compared with the Normoxia group; 0.001, compared with the Hypoxia group and Hypoxia NC siRNA group.
Effects of silencing Beclin-1 on autophagic flux in U87MG cells under hypoxia
To examine the status of autophagic flux, a U87MG cell line stably expressing a tandem RFP-GFP-LC3 fusion protein was established and employed to visualize and distinguish GFPRFP (yellow) and GFPRFP (red) LC3 puncta. The result demonstrated that the formation of LC3 puncta increased in the Hypoxia group and tended to become GFP/RFP (yellow) compared with the Normoxia group, while the GFP fluorescence in U87MG cells in the Beclin-1 siRNA group was weakened compared to that in the Hypoxia group (Fig. 5).
Effects of silencing Beclin-1 on autophagic flux in U87MG cells under hypoxic conditions. Notes: A, Representative confocal fluorescent images of RFP-GFP-LC3-expressing cells; B, Percentages of cells with puncta similar to LC3 were calculated based on the images represented in A.
Discussion
Recently, VM has been widely regarded as a critical mechanism involved in glioma progression [24, 25], but its role in autophagy remains poorly defined.
From the clinical results of our study, we found that the VM structure was observed in 34 cases of the 105 patients with glioma and that VM positivity was clearly related to the grade of glioma. This finding was to some extent consistent with the notions suggested by Huang M and his group, namely, that the number of VM structures increases with the glioma grade and that there were significant differences in the pathological grades between the VM-positive and VM-negative patients with gliomas [3], indicating a close correlation between the presence of VM and the severity of tumors since VM structures may be observed in more aggressive tumors compared to less aggressive ones [26]. Additionally, this study revealed that VM formation in glioma patients was associated with the expression of Beclin-1. Coincidentally, higher levels of both Beclin-1 mRNA and protein expression have been discovered by Han et al. in a VM-positive melanoma, but not a VM-negative melanoma [13], suggesting that Beclin-1, as an autophagy gene, is an essential factor in the formation of VM in glioma possibly because autophagy could induce the generation of reactive oxygen and Akt activation in order to participate in angiogenesis [27, 28]. In addition, the Spearman analysis results demonstrated that Beclin-1 expression was positively correlated with the expression levels of HIF-1, VEGF and MMP2. In general, hypoxia could directly elevate the expression of HIF-1, a key transcriptional regulatory factor of the adaptive response under hypoxic microenvironments, which could further induce VEGF expression to maintain anaerobic metabolism in tumor cells [29]. Moreover, Zhao et al. identified that GSK-3 may inhibit glioma progression and angiogenesis in vivo partially through the decreased expression of HIF-1 and VEGF [30]. MMP2, which belongs to the matrix metalloproteinase family, is an important molecule in VM formation and plays an important role in the remolding of the extracellular matrix [31]. Enhanced secretion of MMP-2 has been shown to contribute to the invasiveness of glioma cells, which was in line with our findings [32]. Therefore, Beclin-1 can affect VM formation in glioma possibly by mediating various VM-related molecules.
To further analyze the role of Beclin-1 in modulating VM formation in glioma, CoCl was used in cell cultures to simulate hypoxia, and a specific siRNA was designed to silence Beclin-1 to establish an autophagy-inhibited group in human glioma U87MG cells in vitro. The findings showed that inhibiting Beclin-1 expression in U87MG cells by siRNA gave rise to a reduction in Beclin-1 expression and inhibition of migratory and invasive abilities, which were the important characteristics of cancer metastasis and vascularization, as well as prevention of VM formation under hypoxic conditions, demonstrating indispensable involvement of autophagy in the formation of VM [33]. Furthermore, silencing Beclin-1 led to a decrease in the expression of particular VM-related molecules, including HIF-1, VEGF, and MMP-2, as well as VE-cad and EphA2, in hypoxic U87MG cells. As far as we know, vascular endothelial cadherin (VE-cad), an endothelial-specific adhesion protein belonging to the cadherin superfamily, is important for facilitating intercellular adhesion [34] and was verified as an important regulatory molecule of VM that is involved in certain types of tumors [35], while EphA2 is accepted as a tyrosine kinase receptor that regulates angiogenesis [36]. From this point of view, blocking the expression of Beclin-1 may also be linked to the downregulation of HIF-1, VEGF, and MMP-2, VE-cad and EphA2 expression, which in return verified our clinical results.
Taking all these results into consideration, Beclin-1 expression is correlated with VM formation in glioma patients and is positively linked to the expression of VEGF and MMP2. In addition, silencing Beclin-1 can significantly decrease VM formation and metastasis of U87MG cells, as well as the expression of VM-related targets under hypoxic conditions, and in this regard, Beclin-1 is a promising therapeutic target for glioma. In the future, we will further enlarge the sample size, and additional animal experiments deeply analyzing the specific mechanism of Beclin-1 in VM inhibition in glioma are needed to verify the current data.
Footnotes
Conflict of interest
None.
References
1.
XueH.GaoX.XuS.ZhangJ.GuoX.YanS.LiT.GuoX.LiuQ. and LiG., MicroRNA-Let-7f reduces the vasculogenic mimicry of human glioma cells by regulating periostin-dependent migration, Oncol Rep35 (2016), 1771–1777.
2.
YinH.ShaoY. and ChenX., The effects of CD147 on the cell proliferation, apoptosis, invasion, and angiogenesis in glioma, Neurol Sci38 (2017), 129–136.
3.
HuangM.KeY.SunX.YuL.YangZ.ZhangY.DuM.WangJ.LiuX. and HuangS., Mammalian target of rapamycin signaling is involved in the vasculogenic mimicry of glioma via hypoxia-inducible factor-1alpha, Oncol Rep32 (2014), 1973–1980.
4.
FuR.DingY.LuoJ.YuL.LiC.L.LiD.S. and GuoS.W., TET1 exerts its tumor suppressor function by regulating autophagy in glioma cells, Biosci Rep (2017).
5.
JuratliT.A.SchackertG. and KrexD., Current status of local therapy in malignant gliomas–a clinical review of three selected approaches, Pharmacol Ther139 (2013), 341–358.
6.
GaoT.LiJ.Z.LuY.ZhangC.Y.LiQ.MaoJ. and LiL.H., The mechanism between epithelial mesenchymal transition in breast cancer and hypoxia microenvironment, Biomed Pharmacother80 (2016), 393–405.
7.
Bobrovnikova-MarjonE.GrigoriadouC.PytelD.ZhangF.YeJ.KoumenisC.CavenerD. and DiehlJ.A., PERK promotes cancer cell proliferation and tumor growth by limiting oxidative DNA damage, Oncogene29 (2010), 3881–3895.
8.
SuM.XuX.WeiW.GaoS.WangX.ChenC. and ZhangY., Involvement of human chorionic gonadotropin in regulating vasculogenic mimicry and hypoxia-inducible factor-1alpha expression in ovarian cancer cells, Cancer Cell Int16 (2016), 50.
9.
ZhouT.J.HuangX.H.GongL. and XiangL., Vasculogenic mimicry and hypoxia-inducible factor-1alpha expression in cervical squamous cell carcinoma, Genet Mol Res15 (2016), 15017396.
10.
LiuK.SunB.ZhaoX.WangX.LiY.QiuZ.LiuT.GuQ.DongX.ZhangY.WangY. and ZhaoN., Hypoxia promotes vasculogenic mimicry formation by the Twist1-Bmi1 connection in hepatocellular carcinoma, Int J Mol Med36 (2015), 783–791.
11.
ChenL.LinZ.X.LinG.S.ZhouC.F.ChenY.P.WangX.F. and ZhengZ.Q., Classification of microvascular patterns via cluster analysis reveals their prognostic significance in glioblastoma, Hum Pathol46 (2015), 120–128.
12.
YeH.ChenM.CaoF.HuangH.ZhanR. and ZhengX., Chloroquine, an autophagy inhibitor, potentiates the radiosensitivity of glioma initiating cells by inhibiting autophagy and activating apoptosis, BMC Neurol16 (2016), 178.
13.
HanC.SunB.WangW.CaiW.LouD.SunY. and ZhaoX., Overexpression of microtubule-associated protein-1 light chain 3 is associated with melanoma metastasis and vasculogenic mimicry, Tohoku J Exp Med223 (2011), 243–251.
14.
TangH.SebtiS.TitoneR.ZhouY.IsidoroC.RossT.S.HibshooshH.XiaoG.PackerM.XieY. and LevineB., Decreased BECN1 mRNA Expression in Human Breast Cancer is Associated with Estrogen Receptor-Negative Subtypes and Poor Prognosis, E Bio Medicine2 (2015), 255–263.
15.
HuZ.ZhongZ.HuangS.WenH.ChenX.ChuH.LiQ. and SunC., Decreased expression of Beclin1 is significantly associated with a poor prognosis in oral tongue squamous cell carcinoma, Mol Med Rep14 (2016), 1567–1573.
16.
WangW.FanH.ZhouY.DuanP.ZhaoG. and WuG., Knockdown of autophagy-related gene BECLIN1 promotes cell growth and inhibits apoptosis in the A549 human lung cancer cell line, Mol Med Rep7 (2013), 1501–1505.
17.
HuY.F.LeiX.ZhangH.Y.MaJ.W.YangW.W.ChenM.L.CuiJ. and ZhaoH., Expressions and clinical significance of autophagy-related markers Beclin1, LC3, and EGFR in human cervical squamous cell carcinoma, Onco Targets Ther8 (2015), 2243–2249.
18.
DingY.ZhaoK.WuY. and XingC., Expression and significance of Beclin-1 in vasculogenic mimicry formation of gastric cancer, Zhonghua Wei Chang Wai Ke Za Zhi17 (2014), 716–719.
19.
The Helsinki Declaration of the World Medical Association (WMA). Ethical principles of medical research involving human subjects, Pol Merkur Lekarski36 (2014), 298–301.
20.
KleihuesP.LouisD.N.ScheithauerB.W.RorkeL.B.ReifenbergerG.BurgerP.C. and CaveneeW.K., The WHO classification of tumors of the nervous system, J Neuropathol Exp Neurol61 (2002), 215–25; discussion 226–229.
21.
WangS.Y.YuL.LingG.Q.XiaoS.SunX.L.SongZ.H.LiuY.J.JiangX.D.CaiY.Q. and KeY.Q., Vasculogenic mimicry and its clinical significance in medulloblastoma, Cancer Biol Ther13 (2012), 341–348.
22.
WangL.ChenM.YangJ. and ZhangZ., LC3 fluorescent puncta in autophagosomes or in protein aggregates can be distinguished by FRAP analysis in living cells, Autophagy9 (2013), 756–769.
23.
MizushimaN.YoshimoriT. and LevineB., Methods in mammalian autophagy research, Cell140 (2010), 313–326.
24.
LingG.JiQ.YeW.MaD. and WangY., Epithelial-mesenchymal transition regulated by p38/MAPK signaling pathways participates in vasculogenic mimicry formation in SHG44 cells transfected with TGF-beta cDNA loaded lentivirus in vitro and in vivo, Int J Oncol49 (2016), 2387–2398.
25.
JuR.J.ZengF.LiuL.MuL.M.XieH.J.ZhaoY.YanY.WuJ.S.HuY.J. and LuW.L., Destruction of vasculogenic mimicry channels by targeting epirubicin plus celecoxib liposomes in treatment of brain glioma, Int J Nanomedicine11 (2016), 1131–1146.
26.
ManiotisA.J.FolbergR.HessA.SeftorE.A.GardnerL.M.Pe’ErJ.TrentJ.M.MeltzerP.S. and HendrixM.J., Vascular channel formation by human melanoma cells in vivo and in vitro: vasculogenic mimicry, American Journal of Pathology155 (1999), 739–752.
27.
NishikawaT.TsunoN.H.OkajiY.SunamiE.ShunoY.SasakiK.HongoK.KanekoM.HiyoshiM.KawaiK.KitayamaJ.TakahashiK. and NagawaH., The inhibition of autophagy potentiates anti-angiogenic effects of sulforaphane by inducing apoptosis, Angiogenesis13 (2010), 227–238.
28.
GoyalA.NeillT.OwensR.T.SchaeferL. and IozzoR.V., Decorin activates AMPK, an energy sensor kinase, to induce autophagy in endothelial cells, Matrix Biol34 (2014), 46–54.
29.
LiH.ChenJ.ZenW.XuX.XuY.ChenQ. and YangT., Effect of hypoxia inducible factor-1 antisense oligonucleotide on liver cancer, Int J Clin Exp Med8 (2015), 12650–12655.
30.
ZhaoP.LiQ.ShiZ.LiC.WangL.LiuX.JiangC.QianX.YouY.LiuN.LiuL.Z.DingL. and JiangB.H., GSK-3beta regulates tumor growth and angiogenesis in human glioma cells, Oncotarget6 (2015), 31901–31915.
31.
WangZ.YouD.LuM.HeY. and YanS., Inhibitory effect of norcantharidin on melanoma tumor growth and vasculogenic mimicry by suppressing MMP-2 expression, Oncol Lett13 (2017), 1660–1664.
32.
HanY.WuZ.WuT.HuangY.ChengZ.LiX.SunT.XieX.ZhouY. and DuZ., Tumor-suppressive function of long noncoding RNA MALAT1 in glioma cells by downregulation of MMP2 and inactivation of ERK/MAPK signaling, Cell Death Dis7 (2016), e2123.
33.
DingY.P.YangX.D.WuY. and XingC.G., Autophagy promotes the survival and development of tumors by participating in the formation of vasculogenic mimicry, Oncol Rep31 (2014), 2321–2327.
34.
SakaueT.FujisakiA.NakayamaH.MaekawaM.HiyoshiH.KubotaE.JohT.IzutaniH. and HigashiyamaS., Neddylated Cullin 3 is required for vascular endothelial-cadherin-mediated endothelial barrier function, Cancer Sci108 (2017), 208–215.
35.
Delgado-BellidoD.Serrano-SaenzS.Fernandez-CortesM. and OliverF.J., Vasculogenic mimicry signaling revisited: focus on non-vascular VE-cadherin, Mol Cancer16 (2017), 65.
36.
GuoJ.Q.ZhengQ.H.ChenH.ChenL.XuJ.B.ChenM.Y.LuD.WangZ.H.TongH.F. and LinS., Ginsenoside Rg3 inhibition of vasculogenic mimicry in pancreatic cancer through downregulation of VEcadherin/EphA2/MMP9/MMP2 expression, Int J Oncol45 (2014), 1065–1072.