
Abstract
Although recent developments in imaging biomarkers have revolutionized the diagnosis of Alzheimer’s disease at early stages, the utility of most of these techniques in clinical setting remains unclear. The aim of this review is to provide a clear stepwise algorithm on using multitier imaging biomarkers for the diagnosis of Alzheimer’s disease to be used by clinicians and radiologists for day-to-day practice. We summarized the role of most common imaging techniques and their appropriate clinical use based on current consensus guidelines and recommendations with brief sections on acquisition and analysis techniques for each imaging modality. Structural imaging, preferably MRI or alternatively high resolution CT, is the essential first tier of imaging. It improves the accuracy of clinical diagnosis and excludes other potential pathologies. When the results of clinical examination and structural imaging, assessed by dementia expert, are still inconclusive, functional imaging can be used as a more advanced option. PET with ligands such as amyloid tracers and 18F-fluorodeoxyglucose can improve the sensitivity and specificity of diagnosis particularly at the early stages of the disease. There are, however, limitations in using these techniques in wider community due to a combination of lack of facilities and expertise to interpret the findings. The role of some of the more recent imaging techniques including tau imaging, functional MRI, or diffusion tensor imaging in clinical practice, remains to be established in the ongoing and future studies.
Keywords
INTRODUCTION
Despite all the advances in imaging of Alzheimer’s disease (AD) in the research setting, there is a lack of translation of these methodologies into the clinical practice. Most imaging biomarkers have not been validated in unselected patient cohorts and participants in large AD studies are not representative of the general population. These techniques require special facilities and expertise to perform and interpret. The paucity of standard acquisition and analysis methods between different centers make the widespread adoption of them even more challenging. In addition, some of the new imaging modalities are still too expensive to be considered cost-effective in a community setting or in non-specialized centers.
Based on a growing body of evidence, the early and accurate diagnosis in preclinical stages of the disease is paramount to tackle AD [1, 2]. Therefore, an important goal of developing imaging biomarkers should be to bridge the gap between the research setting and clinical practice and to use these techniques as screening, diagnostic, or prognostic markers in the wider population.
In this review, we summarize the utility of different imaging biomarkers, review the current guidelines and recommendations, and present a stepwise algorithm for radiological evaluation of cognitive impairment for clinicians. We will also review some of the novel techniques, which may not come to clinical practice in the near future, to demonstrate their potential utility.
STRUCTURAL IMAGING
Current recommendation and guidelines
There is a consensus among all current guidelines that structural imaging, i.e., magnetic resonance imaging (MRI) or computerized tomography (CT), is required for evaluation of patients presenting with a cognitive/dementia syndrome (CDS) in the clinical setting [3–7]. The UK National Institute of Health and Care Excellence [3], European Federation of Neurological Societies (EFNS) [4, 8], and the Fourth Canadian Consensus Conference on Diagnosis and Treatment of Dementia [6] have all recommended using structural imaging to 1) exclude treatable causes of dementia and 2) assess the pattern of atrophy which could provide additional diagnostic or predictive values to clinical information. The presence of atrophy can improve the accuracy of a clinical diagnosis considerably. Scheltens et al. showed the incremental diagnostic gain of positive or negative MRI for any given clinical probability [5]. MRI is the preferable method because of its higher resolution and ability to delineate a spectrum of changes related to vascular pathologies and white matter diseases in the brain. High resolution CT can be used as a replacement when there is a contraindication for MRI. It has also been recommended to use a standard MRI protocols for dementia to facilitate the comparison with follow up imaging.
The characteristic pattern of atrophy in AD involves structures of the medial temporal lobe (MTL) including the hippocampi, entorhinal cortex, parahippocampal gyrus, amygdala, and also the cingulate cortex while the motor cortex is relatively spared [9–11]. Despite all the evidence supporting the presence of AD “signature” atrophy in large research studies based on group level analysis, it is still very challenging to quantify the degree of atrophy in a single case in clinical setting.
Acquisition and analysis techniques
The minimum sequences required to assess a patient with CDS are: High resolution 3D/Volumetric T1 weighted images produced with fast spoiled gradient echo (FSPGR; GE Healthcare), magnetization prepared rapid acquisition GRE (MPRAGE; Siemens Healthineers) or other similar sequences in coronal and at least one more plane (axial or sagittal) which can be produced using reformatting software. This sequence is used to assess the anatomy, internal structure and degree of atrophy; T2 weighted images; Fluid-attenuated inversion recovery (FLAIR) sequence.
Both the latter are used to determine the severity of vascular changes. In addition, a coronal FLAIR is the best projection to evaluate the signal of hippocampi and MTL.
Other sequences such as 4) Gradient echo (GRE)/T2* /Susceptibility Weighted Imaging (SWI) and 5) Diffusion weighted imaging can provide additional valuable information. SWI can detect cerebral microbleeds, reflecting evidence of vascular amyloid pathology, which has both diagnostic role [12] and therapeutic implication in anti amyloid treatment [13]. Diffusion weighted images can exclude other pathologies such as recent vascular events and more importantly support the diagnosis of Creutzfeldt-Jakob disease as a cause of subacute cognitive impairment.
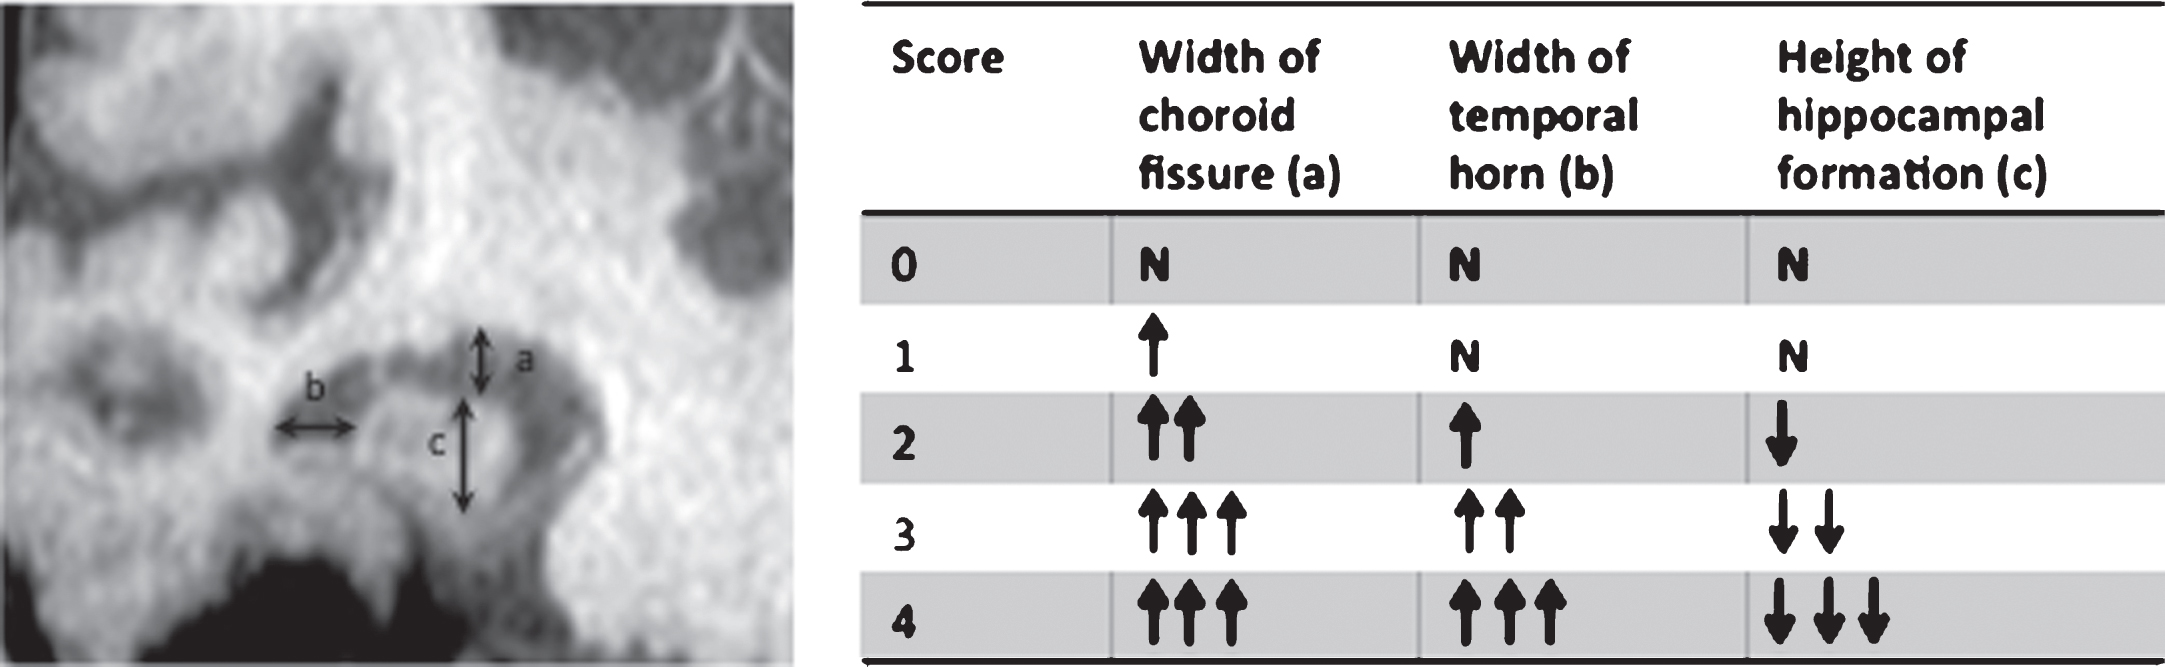
The following is a summary of different ways to assess the hippocampal and MTL atrophy: Visual assessment: scoring atrophy from 0 to 4 based on the width of the choroid fissure, maximum width of the temporal horn, and height of hippocampal formation [14] (Fig. 1). This is a technique widely used in a clinical setting as it is not time consuming, does not require either specialist software, calculations or reformatting. The limitation of this method is the significant inter-observer variation in scaling atrophy [15–17]. Despite scoring variation there is, however, good inter-rater reliability when visual assessment is used to dichotomize the data into presence or absence of atrophy [15], which might be sufficient for clinical purposes. Linear (1D): Different methods are used for the linear assessment of atrophy including measuring the radial width of the temporal horn [18], measurement of interuncal distance, [19] and a grading scale (0–4) for the degree of medial temporal lobe atrophy using the area of the hippocampi and maximal transverse width of the temporal horns [20]. Planimetric (2D) measurements: These techniques comprise assessment of the degree of medial temporal lobe atrophy (MTA) by measuring the whole MTL region including the parenchyma and cerebrospinal fluid (CSF) spaces (A), the parenchyma in the MTL region (B) and the body of the ipsilateral lateral ventricle (C) in the coronal images at the level of interpeduncular fossa. Various parameters such as 2D-MTA = A-B or Medial Temporal Atrophy index (MTAi) = (A-B)×10/C have been developed using these measurements [21–23]. Although all of the above techniques (linear and planimetric) are feasible and can be assessed on MRI images obtained in any clinical setting, there is a lack of normative values to distinguish normal from abnormal particularly at early stage of disease such as minimal cognitive impairment (MCI). Also, they have not been used on large cohorts of patients and, in comparison to volumetric measurements, they are less accurate [24]. Volumetric measurement (3D): There are manual and automated techniques for measuring the volume of hippocampi. The manual segmentation by an expert is considered as gold standard for hippocampal volumetry but it requires a high level of training, is very time consuming and costly. The other issue preventing it from being used in the clinical setting is significant variation in segmenting hippocampus [25]. To overcome the discrepancies in the segmentation of hippocampus between different centers, the European Alzheimer’s Disease Consortium (EADC) and Alzheimer’s Disease Neuroimaging Initiative (ADNI) with support of the Alzheimer’s Association have developed a consensual harmonisation protocol for manual segmentation of hippocampus [26, 27] which is available as a web-based protocol (http://www.hippocampal-protocol.net). The automated segmentation techniques can overcome some of the reliability issues of manual techniques, but extra software and expertise is required to operate them efficiently. In addition, there is limited data on their sensitivity and specificity and further validation is required before they can be used in clinical practice [25, 28]. Visual assessment of MTL and hippocampal atrophy. a) largest vertical width of choroid fissure; b) width of temporal horn; c) maximum vertical height of hippocampal formation. ↑, increase; ↓, decrease; N, normal.
In a multicenter European study, the accuracy of different structural MRI techniques to distinguish AD from healthy controls were compared. They found accuracy of visual rating (81%), manual hippocampal measurement (89%), and automated multivariate analysis of hippocampal and MTL atrophy (83%) were not significantly different [29].
Clinical implementation
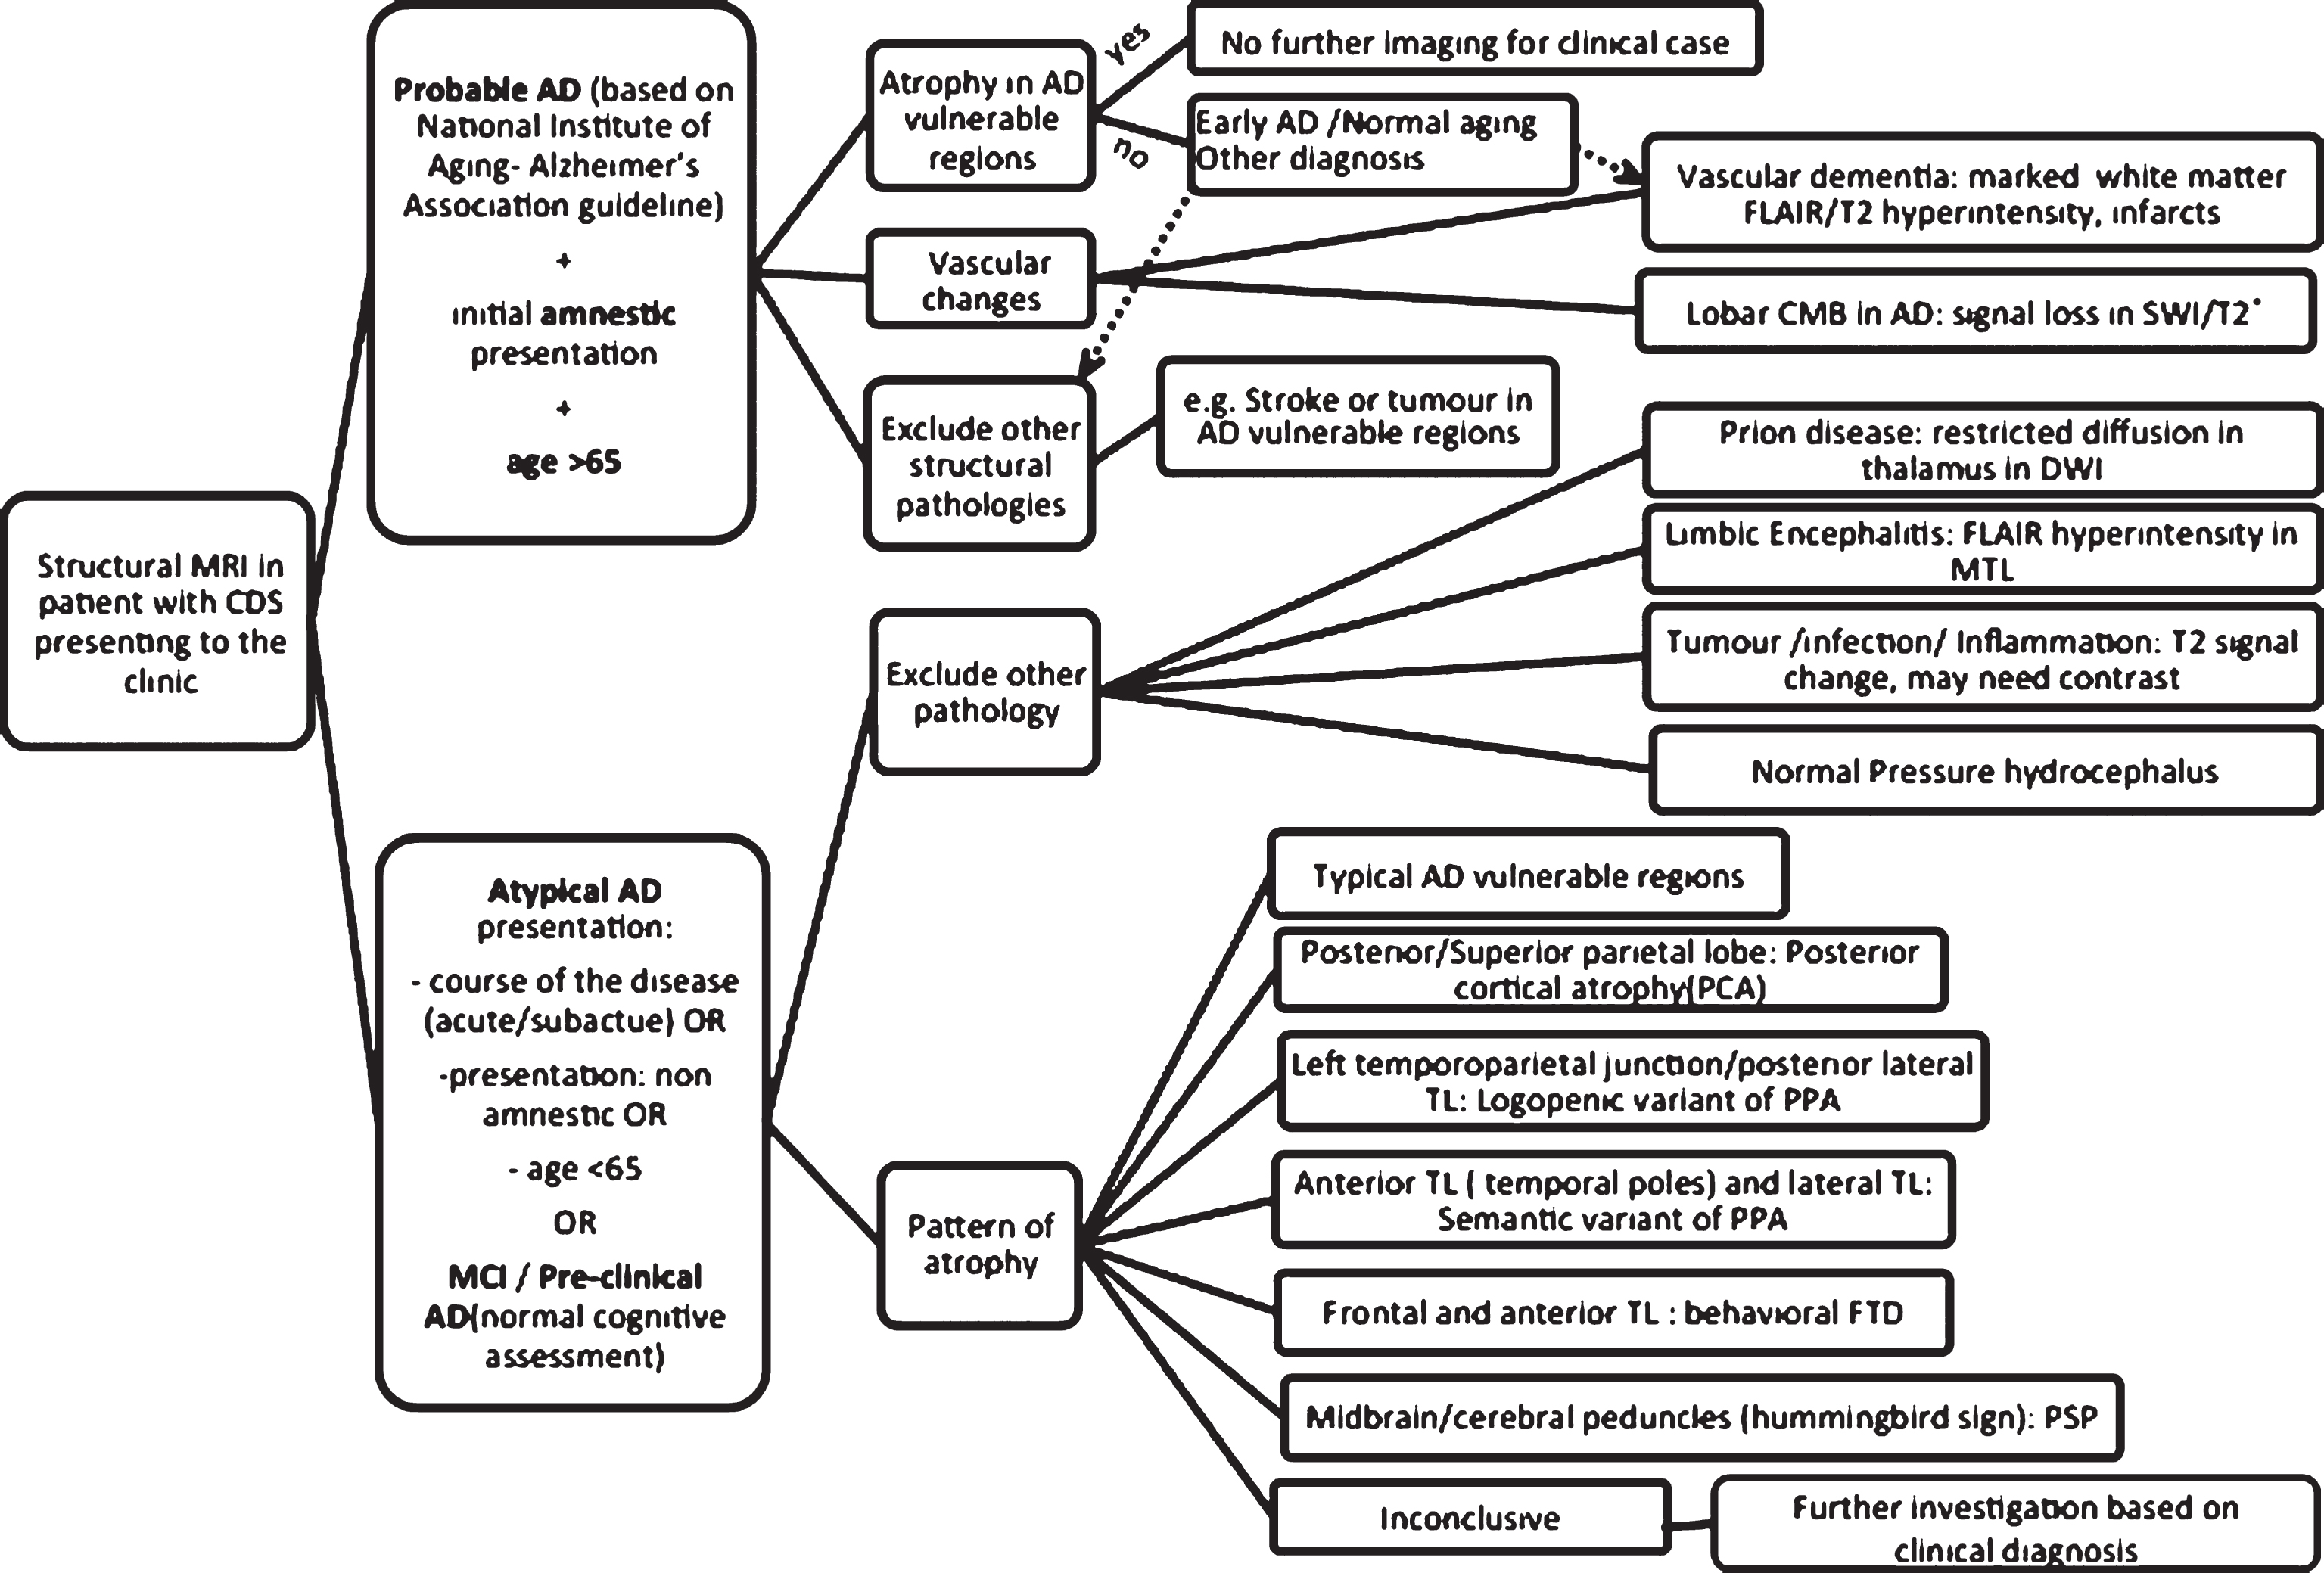
The role of structural MRI differs based on the clinical presentation, stage of the disease, and possibility of an alternative diagnosis/mixed pathologies. Figure 2 demonstrates a stepwise approach in assessment of CDS in the clinic using structural MRI. If a patient presented with a clinical picture compatible with probable AD based on National Institute of Aging- Alzheimer’s Association guideline (NIA-AA) [30], with clinical probability of 0.5 and above and MRI showed atrophy in AD signature regions, the diagnosis is confirmed with a probability of between 0.9–1 [5]. For such a case in clinical setting and assuming the patient will not be recruited to any research study or new therapeutic clinical trial, no further imaging will be required. Structural MRI can also help to determine the severity of vascular disease and exclude other structural pathologies. However, if the clinical picture is atypical because of the course of the disease or presenting symptoms (non-amnestic), then the initial role of MRI is mainly to exclude other causes of cognitive impairment mimicking dementia some of which can be treated if diagnosed promptly. Examples of such conditions include limbic and paraneoplastic encephalitides, different infections, systemic and CNS inflammatory conditions, tumors, and stroke. Atypical presentations warrant a more thorough clinical assessment and detailed neuropsychological examination to diagnose other types of dementia and MRI can be useful in differentiating the pattern of atrophy in some of these cases (Fig. 3). Once non-degenerative causes are excluded, an atypical presentation should prompt consideration of non-amnestic variants of AD: posterior cortical atrophy presents with prominent visuospatial impairment while the logopenic variant of primary progressive aphasia (PPA) is characterized with impairment of single word retrieval and repetition of sentences. Moreover, the behavioral variant of AD presents with a dysexecutive syndrome and impaired behavior. Non-AD dementia syndromes should always be a consideration in these atypical cases. Frontotemporal dementias (FTD) can present with abnormal behavior or impaired language. Evidence of Parkinsonism should lead to consideration of other diagnoses such as dementia with Lewy body (DLB)/ Parkinson’s disease dementia (PDD), if accompanied by other clinical signs, namely supranuclear gaze palsy and prominent asymmetrical apraxia, progressive supranuclear palsy (PSP) and corticobasal degeneration (CBD) should be considered respectively. MRI can be helpful in identifying the pattern of atrophy associated with many less common forms of dementia as detailed in Fig. 3. One important caveat is that the absence of such atrophy patterns does not exclude the condition as in many instances, clinical syndromes might present without the “typical” atrophy pattern. In some diseases such as DLB/ PDD or CBD, no distinctive pattern of atrophy has been identified. Mixed pathologies are also extremely common especially with advancing age and the combination of different pathologies can contaminate the atrophy patterns of individual diseases. MRI is also insensitive when CDS is at its early stages (e.g., MCI) and in these circumstances, it is advisable to move to the next tier of imaging depending on availability and clinical suspicion.
Summary of structural MRI applications in assessment of AD based on current guidelines and literature review.
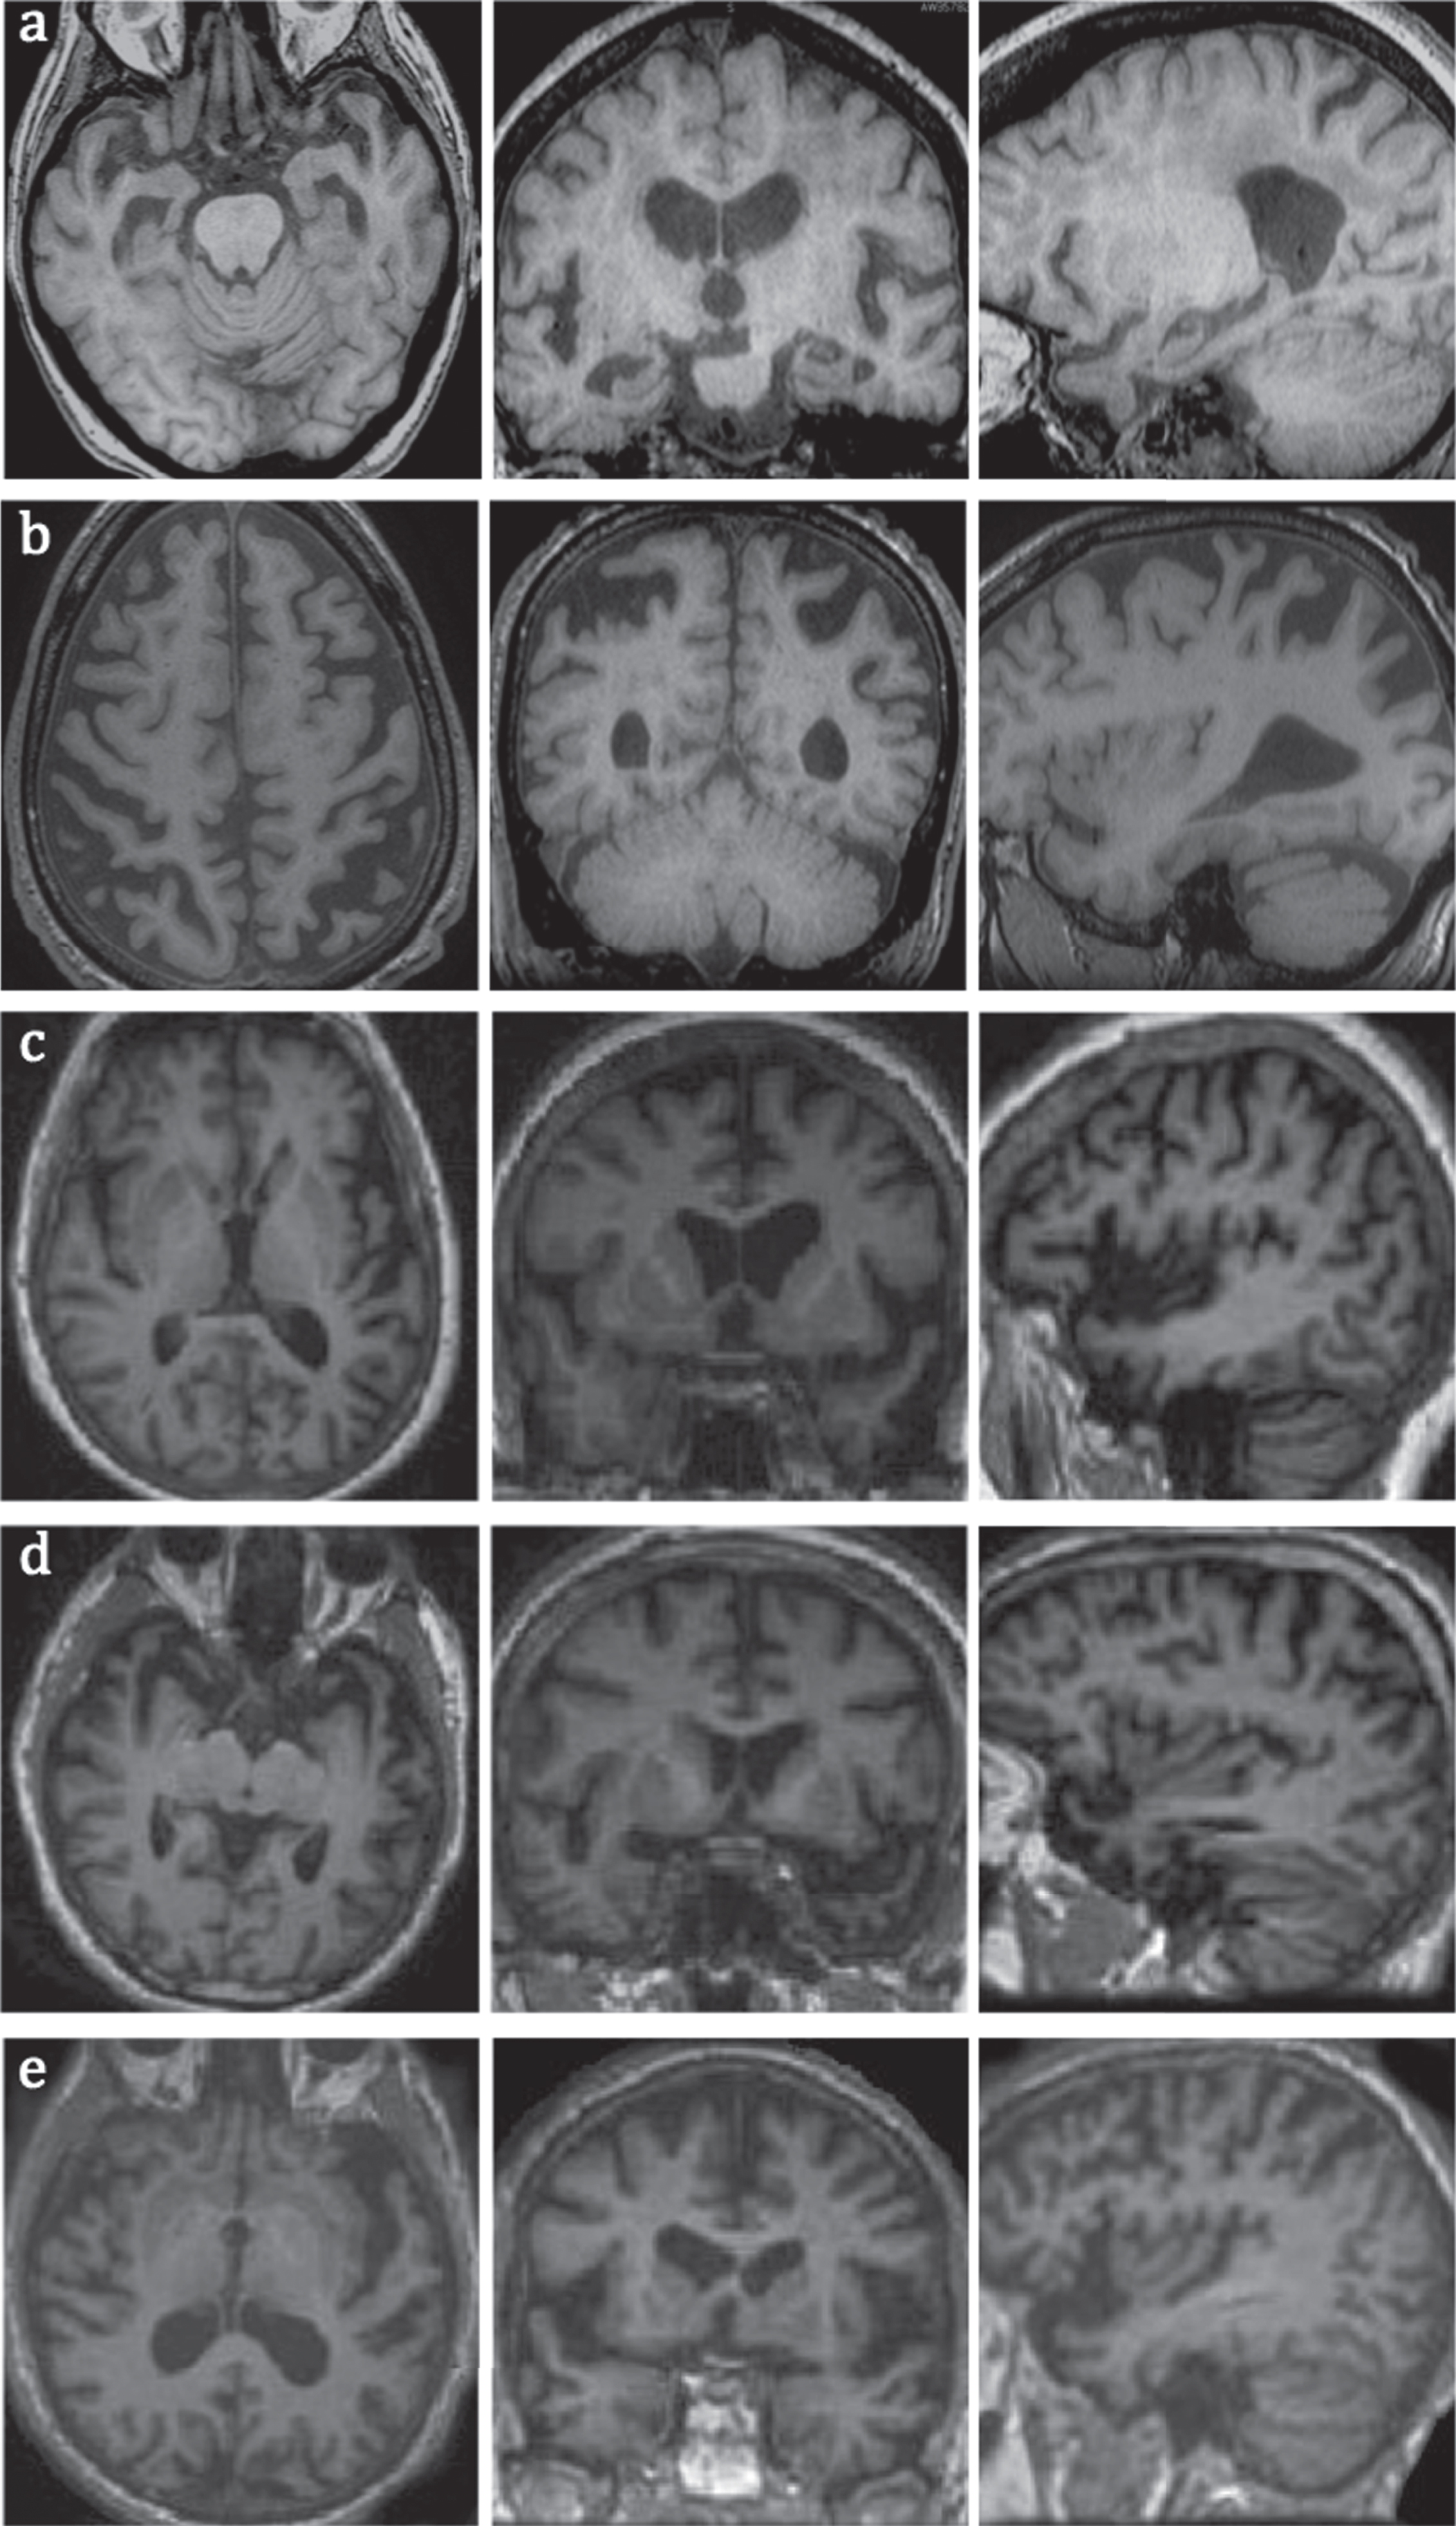
MRI images of common types of dementia in axial, coronal, and sagittal planes, a) early AD with hippocampal and MTL atrophy; b) PCA with superior posterior parietal lobes atrophy; c) logopenic variant of PPA with atrophy in left temporoparietal junction; note more prominent left sided atrophy of posterior and lateral temporal lobes; d) semantic variant of PPA with atrophy in anterior and lateral temporal lobes; e) non-fluent variant of PPA with left frontal operculum and insular atrophy.
FUNCTIONAL IMAGING
Functional imaging includes positron emission tomography (PET) with different tracers, single photon emission computed tomography (SPECT), and advanced MRI techniques such as functional MRI (fMRI), diffusion tensor imaging (DTI), MR spectroscopy (MRS) and arterial spin labeling (ASL). Most of these imaging techniques have recently been developed and some are still far from being used in the routine clinical setting. For the purpose of this review, we focused mainly on the well-established methods such as 18F-fluorodeoxyglucose (18F-FDG) PET, SPECT, and amyloid PET. To make the algorithms more practical, we adapted the new classification scheme for AD biomarkers (A/T/N) introduced by Jack et al. [31]. The utility and role of functional imaging is hugely dependent on the clinical scenario and availability of facilities and expertise but as a general rule they can be used when the combination of clinical examination and structural imaging fail to determine the diagnosis.
FDG-PET
Cerebral hypometabolism is one of the main features of AD. PET with 18F-FDG—a glucose analogue that provides information on the first stages of the glucose metabolism pathway, and a proxy for neuronal and synaptic activity—is a well-established imaging tool for the evaluation of brain function in dementia disorders, including AD.
Current recommendations and guidelines
The European Federation of the Neurological Societies [4, 8], The UK National Institute of Health and Care Excellence [3] and Fourth Canadian Consensus Conference on Diagnosis and Treatment of Dementia [6] all recommended using 18F-FDG-PET in cases with dementia when despite clinical examination and structural imaging by a dementia specialist the diagnosis still remains in doubt, preventing adequate clinical management. There is partial consensus on using FDG in MCI cases. In these cases FDG is useful when the confirmation of a diagnosis can change a patient’s clinical management [6]. FDG-PET can also be used as a prognostic biomarker. AD pattern hypometabolism in FDG-PET in a patient with MCI can predict the conversion to AD within several years [8]. In the US, using FDG-PET for differentiating AD from other dementias (mostly FTD) is approved by Medicare and Medicaid services.
In typical AD, 18F-FDG PET has consistently demonstrated metabolic deficits in the medial temporal lobe, parieto-temporal regions, precuneus, posterior cingulate gyrus, and/or frontal cortices, with sparing of the basal ganglia, thalamus, cerebellum, and visual and sensorimotor cortices [32–35] (Fig. 4). The extent of these hypometabolic patterns during disease progression has been found to correlate with patient performance on cognitive tests [36], and the severity of dementia [35]. In addition, cerebral hypometabolism depicted by 18F-FDG PET has also been shown to correlate with clinical symptoms of cognitive impairment [37] and CSF markers of AD pathology, such as Aβ42 and phosphorylated tau-protein levels [38, 39]. In longitudinal studies, 18F-FDG PET results have shown predictive value in identifying healthy individuals progressing to MCI, and MCI subjects converting to AD [35, 40–42]. Overall sensitivity of FDG is around 76% and median specificity is 82% [43]. Additionally, 18F-FDG-PET can provide differential diagnosis of dementias, allowing discrimination of AD from FTD with more than 85% sensitivity and specificity [35, 44], and AD from DLB with >90% sensitivity and 70% specificity [45, 46].

MRI (top), FDG-PET (middle), and PiB-PET (bottom) images of a typical AD case in axial (a), coronal (b) and sagittal (c) planes showing hypometabolism in parietal and temporal lobes in FDG-PET and extensive cortical amyloid deposition in PiB-PET.
Acquisition and analysis techniques
Dynamic 18F-FDG PET imaging with arterial blood sampling can provide regional estimates of cerebral glucose metabolic rate (CMRglc) as the most accurate technique for assessing 18F-FDG uptake. Arterial blood sampling, however, is a cumbersome procedure for routine clinical use, due to its invasive nature, associated discomfort and potential risk to the patient. For diagnostic purposes and in clinical settings, PET images can be assessed by visual inspection. This, however, is greatly dependent on the reader’s experience. The lack of clear cut-off between normal and abnormal values can make it more challenging particularly in cases with mild disease. Thus, clinical 18F-FDG dementia imaging usually utilizes standardized uptake value ratio (SUVr) quantification of static imaging typically performed as a 30 min acquisition after an uptake period ranging from 30 to 60 min. During the uptake period, patients are placed in a quiet, dimly-lit room to avoid enhanced cerebral 18F-FDG uptake from neuronal activation. Furthermore, patients are required to fast for at least 4 h prior to tracer administration to minimize plasma glucose-related inhibition of 18F-FDG delivery to tissue. SUVr is determined relative to a region whose metabolism is unaffected or mildly affected in AD; these regions include the cerebellar cortex, vermis or whole cerebellum, pons, putamen, visual and motor cortices, or a composite of these [47, 48]. SUVr approaches have shown robust results in assessing metabolic deficits in AD, demonstrating good correlations with clinical symptoms, cognitive scores and dementia progression. Recently and in order to facilitate the 18F-FDG-based assessment of AD, two cut points have been defined to dichotomize 18F-FDG-PET data into normal and abnormal categories. The lenient cut point defined by an SUVr of 1.56 is based on the specificity, sensitivity and accuracy of 18F-FDG distinguishing cognitively impaired cases from young healthy controls. The conservative cut point of an SUVr of 1.42 is based on cognitively impaired versus age-matched healthy controls [49]. It is should be noted however that classification of an individual above a particular cut value, using either lenient or conservative criteria, does not necessarily preclude the absence of brain pathology.
Clinical implementation
Hypometabolism in 18F-FDG-PET is a biomarker of neurodegeneration, neuronal dysfunction and synaptic disease, which is a relatively late finding in the course of AD [50]. Hence normal 18F-FDG in a case with a suspicious diagnosis of dementia, although makes neurodegeneration very unlikely [8], it cannot exclude early CDS. The result of 18F-FDG-PET in MCI/Preclinical AD can be significantly variable from AD pattern abnormality to cortical hypermetabolism [51, 52]. The pattern of abnormality can also be different according to the clinical presentation (amnestic or non amnestic) or underlying pathology [53]. The utility of 18F-FDG-PET in diagnosis of CDS is summarized in Fig. 5. Although there are distinctive patterns of glucose hypometabolism in different dementia syndromes, i.e., AD, FTD, and DLB, these findings are based on group differences and not at the individual level. Interpretation of a single case can be more difficult as there are overlaps between areas of abnormality across these conditions. As a general rule, involvement of temporoparietal lobes, symmetric or more on the right [54] and posterior cingulate gyrus particularly is more in favor of AD. Anterior cerebral involvement in frontal, anterior temporal lobes and anterior cingulate gyrus is more common in FTD [44, 54], while posterior involvement in occipital lobes particularly primary visual cortex is more seen in DLB [46].
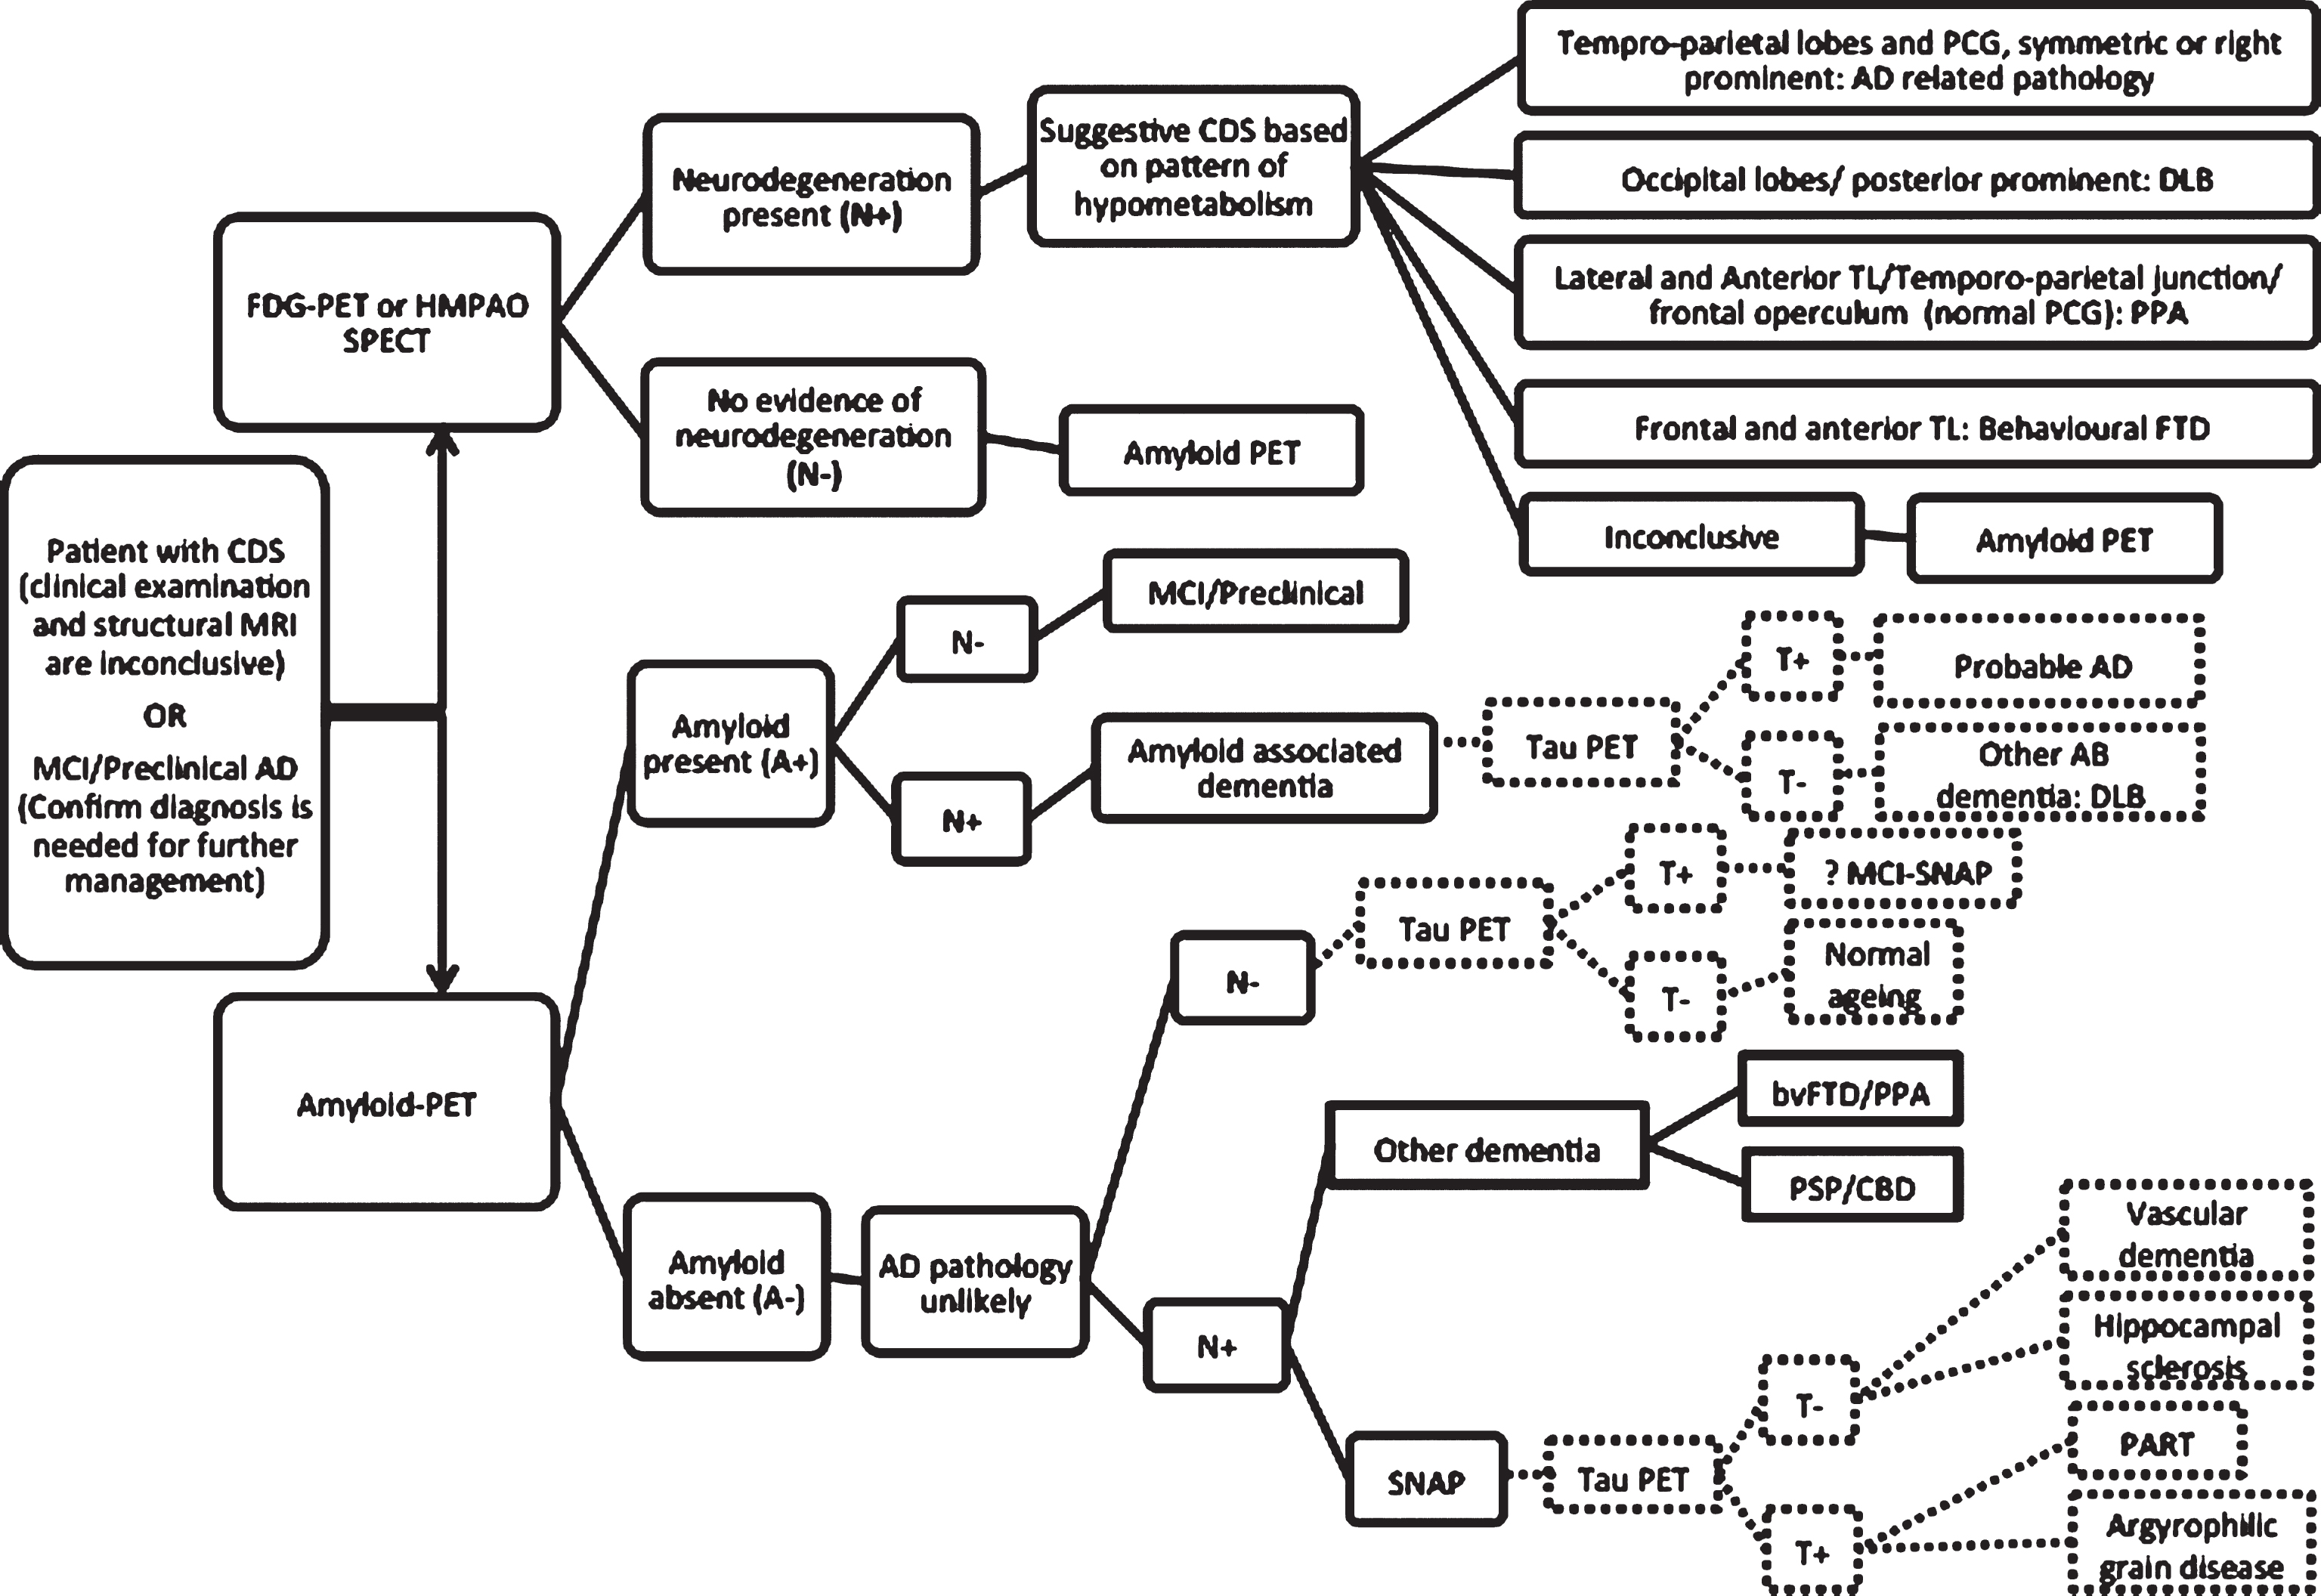
Stepwise algorithm of PET imaging in the evaluation of AD. Patients who fulfill the criteria for PET imaging, can be imaged by FDG-PET or SPECT. If FDG-PET is inconclusive, amyloid imaging will be the next step. The dashed lines are demonstrating the role of tau PET when it becomes clinically available.
Amyloid-PET (11C-Pittsburgh Compound B and 18F-Labelled Amyloid Tracers)
11C-Pittsburgh Compound B (11C-PiB), a derivative of the amyloid-binding histological dye, thioflavin-T, is the best characterized PET tracer for imaging cerebral amyloid-β (Aβ) deposition [55, 56]. 11C-PiB has been shown to bind selectively with high affinity to fibrillar Aβ aggregates, but not amorphous Aβ deposits or neurofibrillary tangles [57, 58].
PET studies have demonstrated increased cortical binding in brain areas known to be affected by fibrillar Aβ pathology, notably frontal, temporo-parietal, and posterior cingulate cortices [58, 59] (Fig. 4). Conversely, brain areas with low Aβ plaque density, such as the cerebellum, have minimal 11C-PiB binding. In vivo patterns of 11C-PiB binding to Aβ fibrils agree with the regional distribution of Aβ plaques observed by postmortem immunohistochemistry [60, 61] and autopsy [62, 63]. Imaging with 11C-PiB has been reported to differentiate between AD patients and cognitively intact age-matched controls [59, 64], predict progression of MCI to symptomatic AD [65, 66], as well as allow differential diagnosis of dementias [67, 68]. 11C-PiB retention has also been shown to be concordant with levels of CSF Aβ42, underlining the potential of amyloid PET imaging as a marker of prodromal AD [69]. Compared to 18F-FDG alone, amyloid imaging has demonstrated greater accuracy in the differentiation of patients with AD from healthy controls [70].
Despite the proven efficacy of 11C-PiB in imaging Aβ-related neuropathology, the short half-life of the 11C label (20 min) has restricted its use to centers with an on-site cyclotron, hampering its use for both research and clinical practice. To overcome the impracticalities of 11C-PiB, several 18F-labelled amyloid derivatives have emerged. Of these, the 18F-labelled PiB analogue, 18F-flutemetamol [71] (GE-067; VizamylTM, GE Healthcare), the stilbene derivative 18F-florbetapir [72] (AV-45; AMYViDTM, Eli Lilly), and the strylpyridine derivative 18F-florbetaben [73] (BAY-94-9172; NeuraceqTM, Piramal) have all gained approval from the US Food and Drug Administration (FDA) and European Medicines Agency (EMA) for use as diagnostic agents of cerebral amyloid aggregation.
Similar to 11C-PiB, all three compounds have exhibited high specific binding to fibrillar Aβ plaques in vivo, and strong correlations with autopsy and post-mortem pathological findings [74–79]. Although non-specific retention in white matter is higher for these 18F-labelled tracers than for 11C-PiB, to date this has not presented a major impediment in the qualitative interpretation of images [71–73, 80–82].
Current recommendations and guidelines
The European Federation of the Neurological Societies [8], the Amyloid Imaging Task Force (Society for Nuclear Medicine and Molecular Imaging and the Alzheimer’s Association) [83, 84], and the recent Canadian Consensus Conference on the Use of Amyloid Imaging [85] have similar recommendations for clinical utilities of amyloid PET. Similar to 18F-FDG-PET, there is a general consensus that amyloid PET imaging should only be used in dementia expert centers. Amyloid PET is recommended for cases with objectively confirmed cognitive impairment for whom, despite comprehensive clinical/neuropsychological examinations and structural imaging, the diagnosis remains uncertain. Examples include 1) patients with a core clinical diagnosis of possible AD with an atypical course or presentation, early onset of symptoms (age < 65) or cases who present with mixed or heterogeneous syndromes; and 2) patients with persistent or progressive unexplained MCI in whom the knowledge of amyloid status could provide precise diagnosis or alter the management [8, 83–85]. It is inappropriate to use amyloid PET in cognitively normal individuals, based solely on positive family history, genetic testing, APOE4 status, or for nonmedical use [83]. The European Federation of the Neurological Societies also suggested that amyloid PET can be used for differentiating FTD from AD and cerebral amyloid angiopathy from other types of intracranial hemorrhages [8]. Importantly amyloid PET is not useful for staging the severity of a dementia syndrome [85].
Acquisition and analyzing techniques
Imaging with 11C-PiB can be performed either by a dynamic PET acquisition beginning immediately upon tracer injection (typically of 90 min duration), or late static imaging of 20–30 min duration preceded by a tracer uptake period (40 or 50 min) [86] to produce an image that approximates the steady state distribution of tracer concentration in tissue relative to that in plasma. Dynamic imaging is, however, impractical for routine clinical practice. Comparison with kinetic analysis of dynamic 11C-PiB PET, it has been demonstrated that reliable and reproducible quantification of 11C-PiB binding can be obtained via simplified analysis of static imaging using SUVr, with the cerebellar cortex acting as the reference region [59, 87].
In a clinical setting, static imaging with 18F-florbetapir, 18F-flutemetamol, and 18F-florbetaben can be performed approximately 60, 90, and 130 min, respectively, after tracer administration [72, 88–90]. As for 11C-PiB, reliable Aβ quantification can be achieved for these 18F-labelled amyloid tracers with 20 min imaging and SUVr analysis relative to the cerebellar cortex. In a recently published meta-analysis of studies with 18F-labelled Aβ tracers in AD, results indicated favorable specificity and sensitivity in the differentiation of AD patients from age-matched normal controls. Both 18F-florbetapir and 18F-florbetaben demonstrated sensitivity and specificity of over 87%, and though there were insufficient data for complete analysis for 18F-flutemetamol, results from a phase II trial indicated greater than 92% sensitivity and specificity in differentiating AD from cognitively normal subjects [71, 91]. Comparisons between 11C-PiB and 18F-labeled amyloid ligands have also yielded high correlations for SUVr quantification of static imaging in cortical areas, although 11C-PiB is superior in differentiating between controls and AD patients [80–82]. More recently, a common scale—namely Centiloid—for quantifying Aβ PET data has been developed, so as to allow standardization of results across differing Aβ radiotracers and imaging protocols [92]. It scales the outcome of each analysis method to a 0 to 100 scale anchored by young controls (≤45 years) and typical AD patients. A single cut point of 1.42 SUVr (Centiloid 19) has also been defined for amyloid PET based on the reliable worsening cut point methods [49]
Clinical implementation
While amyloid PET is considered the most sensitive and specific biomarker for AD, its utility in clinical setting is under vigorous evaluation. The most important role of clinical amyloid PET at this stage is to confirm the diagnosis of AD when the clinical presentation is atypical or to differentiate between amyloid associated dementia with non amyloid pathology. With the current therapeutic options, there is no clinical indication to perform amyloid imaging in straightforward advanced AD cases with high clinical probability as the result is most likely positive. Amyloid imaging also cannot differentiate between clinical variants of AD (typical amnestic AD versus posterior cortical atrophy versus logopenic variant of PPA) or AD from other amyloid associated dementia (DLB or dementia with cerebral amyloid angiopathy). The role of amyloid PET for diagnosis of AD is summarized in Fig. 5. It is worth emphasizing that should AD specific disease modifying therapies become available in the future, the recommendation should change accordingly. This will expand the current application of amyloid PET in clinical settings.
Since deposition of amyloid plaques in brain is one of the first pathological changes in the course of AD [50], amyloid PET can detect brain abnormality at very early stages of the disease or in MCI/preclinical AD cases when the clinical diagnosis is less certain but the intervention will be more effective. The main caveat in using amyloid imaging in preclinical AD is that 10–30% of cognitively normal individuals can have positive amyloid PET [66, 94]. The long-term prognosis in this group and the time scale that they may develop cognitive decline are not completely clear. Therefore, the result of amyloid imaging should be interpreted by dementia experts and based on the cognitive status and clinical presentation of the case. It is very important to remember positive amyloid PET alone does not confirm the diagnosis of AD or MCI.
The disclosure of the results to a patient and caregiver is another sensitive issue that needs special attention. It might be stressful news for patients and can pose legal and social constraints on their life. The Canadian consensus on the use of amyloid imaging [85] has recommended adopting the disclosure methods developed by Harkins et al. [95]. It includes educational session about the results of amyloid imaging and their meaning, assessment of mood and willingness of the participant to receive the results and then face-to-face disclosure session providing written report and explaining the implications with time for questions.
Single photon emission computed tomography
Perfusion hexamethylpropyleneamine oxime (HMPAO)-SPECT measures cerebral blood flow (CBF). It shows hypoperfusion in the regions that demonstrate low glucose metabolism on 18F-FDG-PET such as temporoparietal cortex and posterior cingulate gyrus. A number of guidelines [3, 8] advocate SPECT as an alternative to 18F-FDG-PET but it has been shown that FDG has higher sensitivity and specificity for the diagnosis of AD and DLB [96]. In day-to-day practice, the utility of HMPAO-SPECT (CBF-SPECT) is dependent on the availability of SPECT or 18F-FDG-PET in each center. Currently the UK National Institute of Health and Care Excellence recommend HMPAO-SPECT to differentiated AD from vascular dementia and FTD prior to FDG [3]. While the Fourth Canadian Consensus Conference on Diagnosis and Treatment of Dementia [6] suggested using SPECT as an alternative to FDG when PET cannot be performed.
Dopaminergic iodine-123-radiolabelled 2_ -carbomethoxy-3_ -(4- iodophenyl)-N-(3-fluoropropyl) nortropane (FP-CIT) SPECT known commercially as DaTSCANTM (GE Healthcare, Waukesha, WI, USA) depicts striatal uptake of dopamine. Low dopamine transporter uptake in basal ganglia is a characteristic feature of DLB. Dopaminergic SPECT has very high sensitivity and specificity for diagnosing DLB [97], however it cannot distinguish DLB from other nigrostriatal neurodegenerative disorders associated with presynaptic dopaminergic deficiency such as PDD, PSP, CBD, or FTD with Parkinsonism. Both The UK National Institute of Health and Care Excellence [3] and The European Federation of the Neurological Societies [8] recommend using dopaminergic SPECT in diagnosis of cases with suspected dementia with Lewy bodies.
Other imaging techniques
Tau-PET
Despite the high sensitivity of amyloid imaging in diagnosis of AD, there is a 15–20 year time lag between Aβ deposition and clinical symptoms in AD. By the time patients become symptomatic, the amyloid load has reached its plateau phase which means amyloid PET cannot be used as a staging or prognostic biomarker. On the other hand, the presence of neurofibrillary tangles, phosphorylated tau protein aggregates, in AD has close association with cognitive decline [98], severity of dementia symptoms [99], neuronal injury [100], and brain atrophy [101]. Therefore, tau imaging can be used as a surrogate marker to predict cognitive decline or disease progression in AD. Tau aggregation and deposition in AD occurs in a stereotypical spatiotemporal pattern starting from transentorhinal/entorhinal cortex to hippocampus and then extending to the rest of temporal lobe and neocortical regions [102]. Widespread neocortical deposition is not common in cognitively normal individuals and this stepwise pattern of deposition can help to stage AD. The potential role of tau PET is depicted in Fig. 5. When patient is amyloid positive (A+) but doesn’t have any evidence of neurodegeneration on FDG-PET or structural MRI (N–), presence of tau will increase the likelihood of AD or determine more advanced stages of the disease. On the other hand, if a patient is A + and N + without any evidence of tau, one should consider neurodegeneration as a consequence of non AD pathology and possibility of a mixed dementia syndrome.
Tau imaging might also be useful to facilitate the diagnosis of non-amyloid dependent tau related dementias including PSP, CBD, PPA, behavioral FTD, and a group of other pathologies defined as suspected non Alzheimer’s disease pathologies (SNAP). Examples of SNAP conditions include argyrophilic grain disease and primary age-related tauopathy [103]. The distribution pattern of tau aggregates in different tauopathies is variable: widespread fronto-temporal distribution in FTD, subthalamic nucleus and basal ganglia in PSP, neocortical areas and striatum in CBD, dentate gyrus and hippocampus in Pick’s disease, amygdala and entorhinal cortex and hippocampus in argyrophilic grain disease, and mesial temporal lobe in primary age-related tauopathy [104].
In recent years, different tau selective PET tracers have been developed and been used for human studies: [18F]THK523, [18F]THK5117, [18F]THK5105 [18F]THK5351, [18F]AV1451(T807), and [11C]PBB3 [105]. Although the initial results are promising, there is still long way before tau PET could be qualify for clinical use. If AD specific disease modifying therapies become available, then the indications of performing tau imaging may also change. Tau PET can be used as a follow up imaging tool to assess the response to treatment and predicting future clinical progression.
MR spectroscopy
MRS is a non-invasive method for measuring the concentration of certain chemicals in the brain. N-acetylaspartate (NAA), myoinositol (mI), Choline (Chol), Glutamate plus Glutamine (Glx), and Creatine (Cr) are the most commonly measured compounds. A number of studies in the past two decades have investigated the role of MRS in neurodegenerative disorders. The rationale is that brain metabolites act as surrogate markers for different pathological processes such as neural damage, glial proliferation, loss of membrane integrity, and even inflammatory changes. MRS has the potential to be used as an imaging biomarker detecting the early metabolic changes in AD [106].
Since there is no significant change in the level of Cr in different conditions, it is commonly used as an internal reference to overcome any biases. Therefore, the result of MRS is usually reported as a ratio of other metabolites over Cr [107, 108]. Decrease in NAA or NAA/Cr, a marker of neuroaxonal density and viability, is one of the main reported findings in AD [109, 110]. Reduction of NAA has been reported in the medial temporal lobe [111], hippocampi [110], and posterior cingulate gyrus [112].
In addition to NAA reduction, increase in mI in several brain regions is considered another feature of AD [107, 109]. mI is a glial marker and increase in the level of mI can be a sign of increased glial content, size, and activation [108]. Increase in mI or mI/Cr is considered an early event in the course of AD pathology that can precede NAA reduction [109]. It has been shown that detection of NAA reduction and mI increase in suspected AD improves the specificity and accuracy of the clinical diagnosis significantly (100% for distinguishing AD from healthy controls) [113]. Based on the observed correlation between the metabolites’ level and histopathological changes in AD, it has been suggested that reduction in NAA is related to early tau-mediated dynamic processes while increase in mI is associated with Aβ deposition [114].
Unlike NAA and mI, other metabolites including Chol [109, 115] and Glx [112, 116] have shown inconsistent changes in AD. Lack of standardized techniques and choosing different brain regions as region of interest might be responsible for these contradictory results.
In comparison to other functional imaging techniques, MRS is more available and much less expensive with no radiation risk. It can be easily added to the structural MRI sequences and extract very useful functional information to help diagnosis. Moreover with the correlation between the metabolites level and pathological changes in AD, MRS can be utilized as a follow up imaging tool in therapeutic trials. However, to use MRS for clinical purpose, further large cohort research is required to standardize the techniques and compare the results of MRS with other functional biomarkers.
Functional MRI and diffuse tensor imaging
Neurodegenerative diseases are associated with synaptic dysfunction, axonal, and white matter tract loss with connectivity disruption, and brain network alteration. Advanced MRI techniques like fMRI and DTI can provide further information about these microstructure properties of the brain, its connectivity and networks.
fMRI can be performed as either rest-state (RS)- or task-based. RS-fMRI focuses on spontaneous low frequency fluctuations in blood-oxygen-level dependent signal. Around 10–20 RS networks have been described and the most common ones are default mode network (DMN), the salience network, and central executive network [117]. Different studies have shown that there are functional alteration in all these three networks, particularly DMN in AD and MCI when compared to healthy controls [118]. Also in a meta-analysis of task-based fMRI, MCI and AD patients presented different patterns of hypo-activity; frontoparietal and DMN were affected in MCI and visual network demonstrated low activity in AD cases relative to controls. This implies that pattern of neuronal network dysfunction might be a consequence of disease progression [119].
DTI measures the directionality of water diffusion. In the white matter tracts, water diffusion follows the orientation of the axonal bundles [120]. DTI studies in AD have shown white matter fiber alteration in temporal and frontal lobes and also corpus callosum and posterior cingulate gyrus [121] with a posterior to anterior gradient [122]. A meta-analysis showed DTI measurements of limbic regions have modest diagnostic power in discriminating AD from controls which was not significantly different to hippocampal atrophy [123].
These functional alterations appear prior to structural changes in MRI and could be used as an indicator of disease progression and to monitor response to disease modifying drugs. The caveat is that these techniques are at early stages of evaluation and require further large cohort studies. Moreover, there is significant variability of DTI-based diffusion metrics between MRI scanners that imposes a major restriction in multicenter studies [124]. These limitations mean there is no prospect of using these methods in clinical setting in the near future.
Arterial spin labeling
ASL is a non-invasive MRI technique for measuring tissue perfusion (CBF) by using magnetically labeled arterial blood water protons as an endogenous tracer [125]. It is known that hypoperfusion of AD vulnerable regions starts well before clinical symptoms. There is high correlation between reduction in perfusion and glucose metabolism in 18F-FDG-PET. Some take this further and suggest that vascular dysfunction might precede other abnormalities in AD and present even prior to Aβ aggregation [126].
Recently, several studies have investigated the correlation between ASL and FDG-PET/SPECT in AD. These have shown good concordance between hypoperfusion in ASL and other established techniques with comparable diagnostic accuracy [127]. The results in MCI cases however, were more contradictory as both hyper- and hypoperfusion have been reported [126].
Although ASL, with no radiation risk, lower cost and wider availability, can potentially be a valuable technique to measure brain perfusion, it still has some limitations for wide clinical application: ASL is sensitive to blood velocity and arterial transit time; images are dependent on the integrity of the cerebrovascular system and therefore, presence of steno-occlusive disease or other cerebrovascular pathology can interfere with the quality of image and lead to artefact or noise; it is also highly affected by head motion [127]. New methods have been developed to overcome some of these limitations but further research studies are required before ASL can be considered as a diagnostic biomarker for AD in clinical setting.
CONCLUSION
Imaging biomarkers are an essential part of workup in CDS. Appropriate and informed application of imaging can help clinicians in making early diagnosis or dealing with atypical cases of dementia. Structural imaging (MRI or high resolution CT) should be the first tier of imaging in CDS. Using dementia specific protocol is very crucial for both diagnosis and follow up. Hippocampal and MTL atrophy can be evaluated visually or using quantitative techniques. Visual dichotomized assessment (atrophic vs not atrophic) has good reliability. Functional imaging can provide further information about the pathophysiology of the AD but their utility in day-to-day practice is still under investigation. Currently, they are recommended when clinical examination and structural imaging cannot confirm the diagnosis. Hypometabolism in 18F-FDG-PET, an indicator of neurodegeneration, can differentiate dementia from normal aging. Absence of significant hypometabolism however, will not exclude AD pathology completely particularly at an early stage. Although 18F-FDG-PET is more available compared to amyloid PET, interpretation of 18F-FDG PET can be more challenging. Standardized cut point and development of new analysis software might help wider group of dementia experts to use FDG in their routine practice. Amyloid imaging will be more accessible in the near future with the new fluorinated amyloid tracers. Therefore, it is crucial for clinicians to know the indications of amyloid PET in the clinical setting. The result of PET imaging should always be interpreted by dementia experts and within the context of the clinical examination. Positive amyloid PET (A+) alone is not equal to AD while A- makes AD pathology very unlikely. Other functional imaging techniques have shown promising results but are still far from being used in the clinical setting.
CONFLICT OF INTEREST
The authors have no conflict of interest to report.