
Abstract
The development of Australian mental health services has been guided by the National Mental Health Strategy. This strategy included the objective ‘To institute regular review of client outcomes of services provided to persons with serious mental health problems and mental disorders as a central component of mental health service delivery’ [1, p. 45]. Political questions of ‘value for money’ were seen as impossible to address without ‘system level outcomes based on aggregated individual consumer data as well as broader indicators’ [2, p. 35].
Subsequently, all states and territories have implemented routine outcome measurement (ROM) across public mental health services [3]. While completion rates vary, over 140 000 Health of the Nations Outcome Scales for Children and Adolescents (HoNOSCA) records in child and adolescent mental health services (CAMHS) had been collected by mid 2007. These records contained over 28 000 pairs of HoNOSCA records (http://wdst.mhnocc.org/ cited 10/08/2009). While governments may examine change to inform decisions about value [4], clinicians may be interested to inform treatment decisions [5] and consumers to assist considering the relative merits of different approaches or services [6].
While Australia is one of the first nations to have adopted ROM, internationally an increase in published outcomes data related to CAMHS continues [7]. Routine collection across all CAMHS has occurred in Denmark (Bilenberg, personal communication, August 2005) and New Zealand [8]. Other states (e.g. Ohio, Nova Scotia) and service clusters (e.g. Norway, UK, California) have implemented ROM as part of clinical practice [9–12].
A core measure in Australia, New Zealand, Denmark, Norway and the UK is HoNOSCA, a brief clinician measure of the mental health symptoms and functioning of children and adolescents [13,14]. It comprises 15 scales of which 13 are used to compute the total score. The remaining two scales address problems with knowledge and understanding. Most studies do not report these two scales and it has been suggested the instrument be restricted to the 13 clinical scales and the total score [15].
Clinicians rate each scale on a 0–4 point rating from ‘no problems’ to ‘severe problems’. When HoNOSCA is measured on two or more occasions, the difference score is considered a measure of change without assuming the cause of any such change. The instrument has been found generally to have moderate to good inter-rater reliability [13,14,16] and to be valid [16–19].
Published research has typically reported difference scores, or percentage reduction, in mean total, individual scale or section scores over time as an indicator of change [13,19–23]. Others have described change through the percentage of patients whose difference in total score increased, decreased or remained unaltered [11,24].
Investigations of change have been accompanied by debate about the clinical meaning of any observed change. ‘Clinical significance’ is often contrasted with ‘statistical significance’ and refers to the extent to which change is clinically meaningful [25]. Jacobson and Truax [25] had two components to their method for assessing clinically significant change. First, observed post-treatment means should be more likely to be derived from a functional than dysfunctional population (clinical significance). Secondly, the observed change should be sufficiently large that it is unlikely to have arisen from the imprecision inherent in the instrument (reliable change). As with HoNOS, the adult counterpart of HoNOSCA, ‘the lack of any normative data in non-clinical populations’ [26, p. 720], currently restricts the possibility of determining a cut-off between a functional and dysfunctional population using HoNOSCA scores. Publications that only report statistical significance are often criticized for failing to address the issue of clinical significance: typically whether a patient shifts from a dysfunctional to a functional population [27]. While the method proposed to assess clinical significance has been criticised [27], e.g. some patients will not be ‘cured’ and some measures have no ‘functional’ population norms, the concept remains influential.
Given that ROM has been implemented and that stakeholders may have differing interests and interpretations of outcomes, this study aims to explicate different approaches to change and consider their limitations. This paper will analyse change in HoNOSCA scores at a real world clinical service, Eastern Health CAMHS (EHCAMHS), from a number of perspectives, and discuss the implications. EHCAMHS services a metropolitan and fringe rural area of over 800 000 people, offering community-based treatments for both children and adolescents, and an adolescent day programme and inpatient unit. The service has been guided by the learning organization model and this has supported ROM [28].
Method
All referrals had HoNOSCA completed by the case-managing clinician following assessment, again at six-monthly reviews and at discharge. An 18-month sample revealed a completion rate of 76%.
During the study period, a total of 911 patients had two or more HoNOSCA records completed. The mean age was 11.5 and 60% were male. The most frequent rating pair was assessment-discharge (43.9%), followed by assessment-review (34.2%), first review-second review (11.3%), and first review-discharge (6.6%).
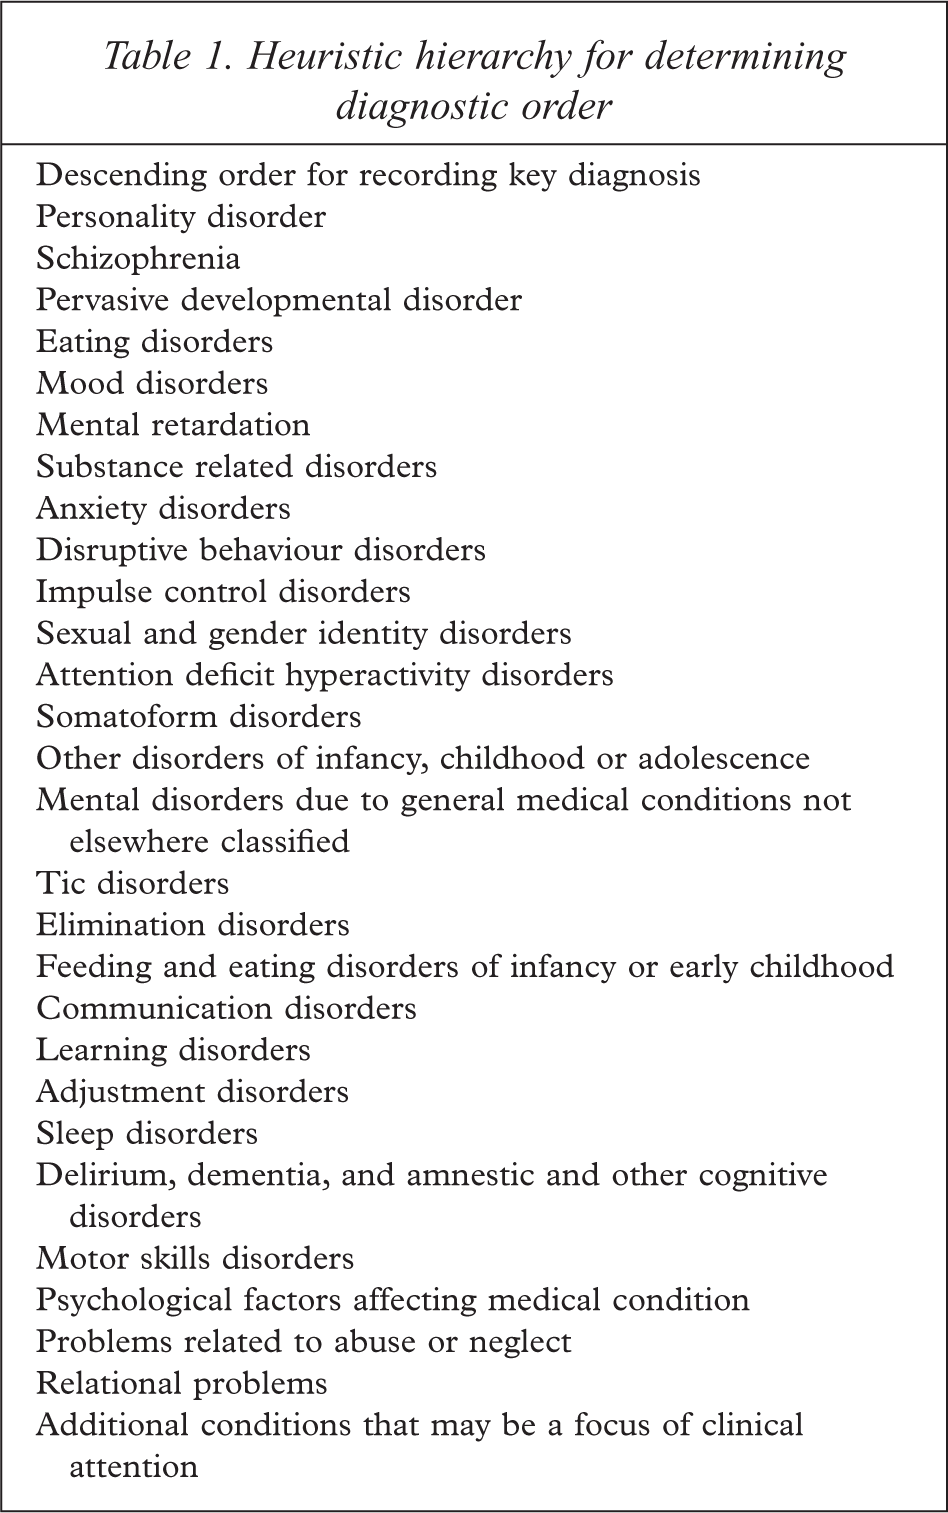
A total of 11% of patients had no diagnosis recorded. Of the remainder, 46.3% and 33.2% had one or two diagnoses recorded respectively. The most frequent was disruptive behaviour disorders (18.3%) with mood, anxiety and adjustment disorders present in more than 10%. More severe presentations were less frequent: e.g. eating (2.5%), pervasive developmental (2.4%), personality (2%) and psychotic disorders (1.9%). All diagnoses were coded according to the DSM-IV groupings [29] with the exception that attention deficit and disruptive behaviour disorders were not merged, and separation anxiety was grouped with anxiety disorders. Duplicate diagnostic groups were removed and a heuristic guide was used incorporating severity and CAMHS frequency to identify the key diagnosis (Table 1).
Heuristic hierarchy for determining diagnostic order
Missing data were excluded from analyses of individual scales and from calculations of the total score in line with the national protocol [30]. This is equivalent to treating missing data as zero when calculating the total score. All data were screened for errors using SPSS version 11.0. While there were no univariate outliers [31], a small proportion of multivariate outliers were noted. These outliers were clinically understandable being either elevated ratings in low prevalence symptom areas (e.g. substance misuse) or reduced ratings in common areas (e.g. family relationships). The threat to the integrity of the analyses arising from the unequal cell sizes that frequently occur in clinical research was minimized through conservative Bonferroni corrections [31] although this may increase the risk of missing an effect.
Analyses of change in the mean total and scale scores were conducted with analysis of variance (ANOVA) and multiple analysis of variance (MANOVA) respectively. Tests of statistical significance are often complemented by examinations of effect size. This can be established in a number of ways though there is little agreement about which method is most suited to which situation [32]. Two of the most common classes are those that belong to the family of correlations (‘r’ family) and those that express effect as a function of standard deviation units (‘d’ family) [32]. Weinfurt [33] describes the use of eta-squared as an index of the strength of an effect that is approximately comparable to r2. Johnson [34] describes the calculation of ‘g’ as a standardized index of effect size that expresses the difference between the comparisons of interest in units of standard deviations.
The reliable change index was calculated in accordance with Parabiaghi
An examination of change in scales follows using the construct of ‘clinical significance’. While HoNOSCA has no norms for a ‘non-clinical’ population, the glossary indicates that a rating of two or more indicates a clinically significant symptom while a rating of zero or one indicates no clinical problem. ‘Clinically significant’ indicates any symptom the clinician considers worthy of clinical attention, such as further assessment, treatment, monitoring or documentation. Each scale at time 1 and 2 can be divided into a dichotomy of clinically significant/not significant, providing four change categories: ‘improved’; ‘deteriorated’; ‘problem, no change’; and, ‘no problem, no change’.
Results
Change in the total score
Repeated-measures ANOVA with time as the independent variable and total score as the dependent variable revealed a significant decrease from time 1 to time 2 (M1 = 12.73, SD = 6.02 and M2 = 9.46, SD = 6.38; F = 292.76, df = 1, 842, p < 0.001). Decreased severity was found for all four rating pairs except the review-review pair. The total score decreased from 12.4 at assessment to 7.76 at discharge (F = 294.25, df = 1, 839, p < 0.001), representing a drop in severity of 37%. The review-discharge pair decreased from 12.98 to 9.72 (F = 21.74, df = 1, 839, p < 0.001). The assessment–review pair had a smaller decrease from a mean of 13.4 to 10.72 (F = 76.23, df = 1, 839, p < 0.001). The review-ongoing review pair, being for patients who have been in treatment for at least six months and who remain in treatment, had a slight though non-significant increase in symptom severity from 11.78 to 12.11.
Change in the total score as an effect size
The sub-sample used to calculate effect size was patients who had completed treatment. Again the decrease in mean scores from 12.4 (SD = 5.96) to 7.76 (SD = 5.82) indicated a statistically significant decrease in symptom severity (F = 279.87, df = 1, 385, p < 0.001) and a partial eta-square of 0.42. This effect size is best described as ‘large’ using Cohen's criteria for r2 [33] although effect sizes of this magnitude have also been described as medium [36]. Criteria from Kraemer
As correlations between means increase in repeated-measures designs, F values are less useful than means and standard deviations when calculating ‘g’ [37]. The correlation between the assessment and discharge HoNOSCA total scores was 0.57. Calculation of ‘g’ produces an estimate of the effect size as 0.79 (95% confidence interval 0.58 to 0.99) [34] which has the same descriptive label as the obtained r, i.e. a ‘large’ to ‘larger than typical’ effect [32]. The size of ‘g’ suggests completed treatment at CAMHS produces an average decrease of almost one standard deviation in symptom severity.
Change in scales
Repeated-measures MANOVA, where time [1,2] was the independent within-subject variable and the ratings on each of the 13 scales were the dependent variables, revealed significant effects due to time (F = 23.73, df = 13, 692, p < 0.001).
Subsequent univariate analyses revealed all scales with the exception of Abnormal perceptions showed significant decreases. Emotional, Family relationships and Disruptive showed the largest reduction in severity (Figure 1). This apparent lack of change in Abnormal perceptions will be explored subsequently.
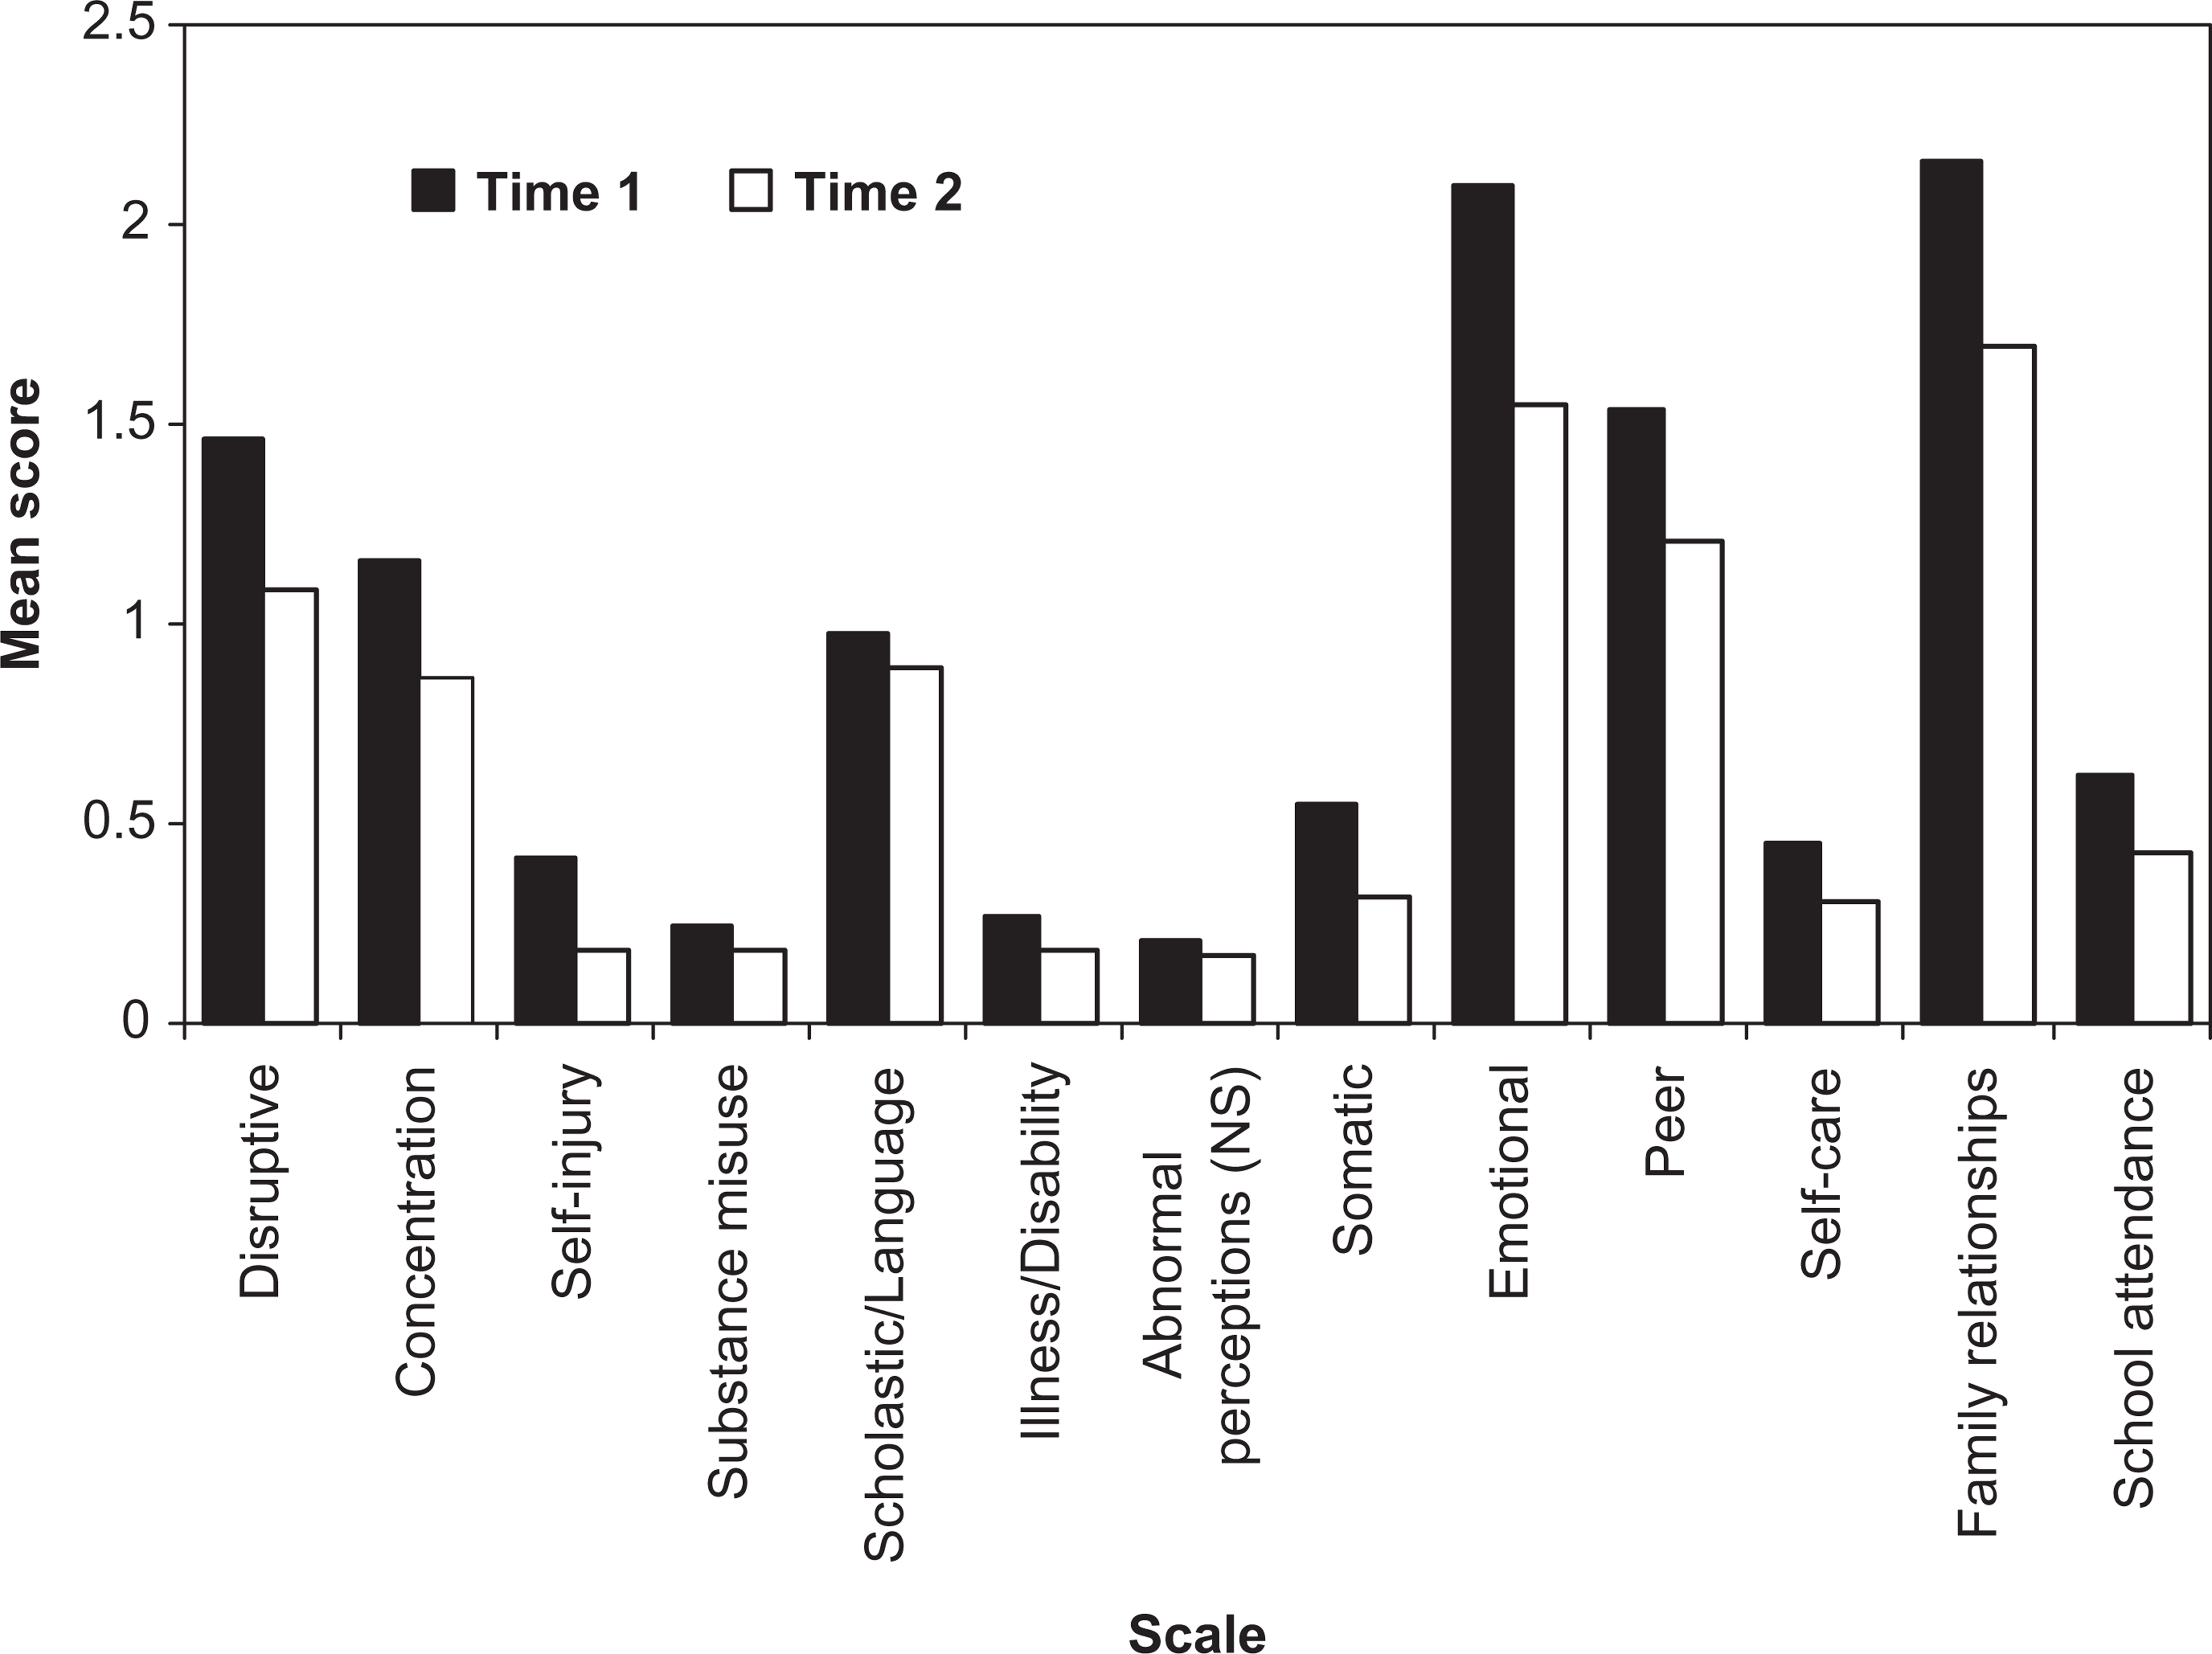
Mean HoNOSCA scale scores at times 1 and 2.
Change in individual scales by treatment status
MANOVA was used with treatment status (completed or continuing treatment) as the between-subjects and time [1,2] as the within-subjects independent variable. The scale scores were the dependent variables. Scores reduced significantly over time (F = 5.76, df = 13, 382, p < 0.001) and differed between continuing and completed treatments (F = 2.69, df = 13, 382, p = 0.001). There was a significant interaction between time and treatment status (F = 5.48, df = 13, 382, p < 0.001) with post-hoc analysis of change between time 1 and time 2 using MANOVA, indicating that significant changes only occurred for those with completed treatment episodes (F = 21.56, df = 13, 382, p < 0.001). As the subsequent question of interest is which scales differed over time by treatment status, post-hoc univariate analyses with Bonferroni adjusted pairwise comparisons were conducted with an overall type I error rate of 0.05. Every HoNOSCA scale except Substance misuse showed significant change for those who had completed treatment. No scale showed change over time for those patients continuing in treatment.
The clinical significance of change in HoNOSCA scores
Clinical significance and the total score
While each scale has a criterion for clinical significance, there is no equivalent for the total score. However, it is possible to examine change in the number of clinically significant scales between assessment and discharge collection occasions. ANOVA revealed a decrease in the number of clinically significant scales from a mean of 3.82 (SD = 1.96) at assessment to 2.12 (SD = 2.17) at discharge (F = 189.11, df = 1, 304, p < 0.001). At discharge, patients have fewer areas in which there are clinically significant symptoms compared to assessment (Figure 2).
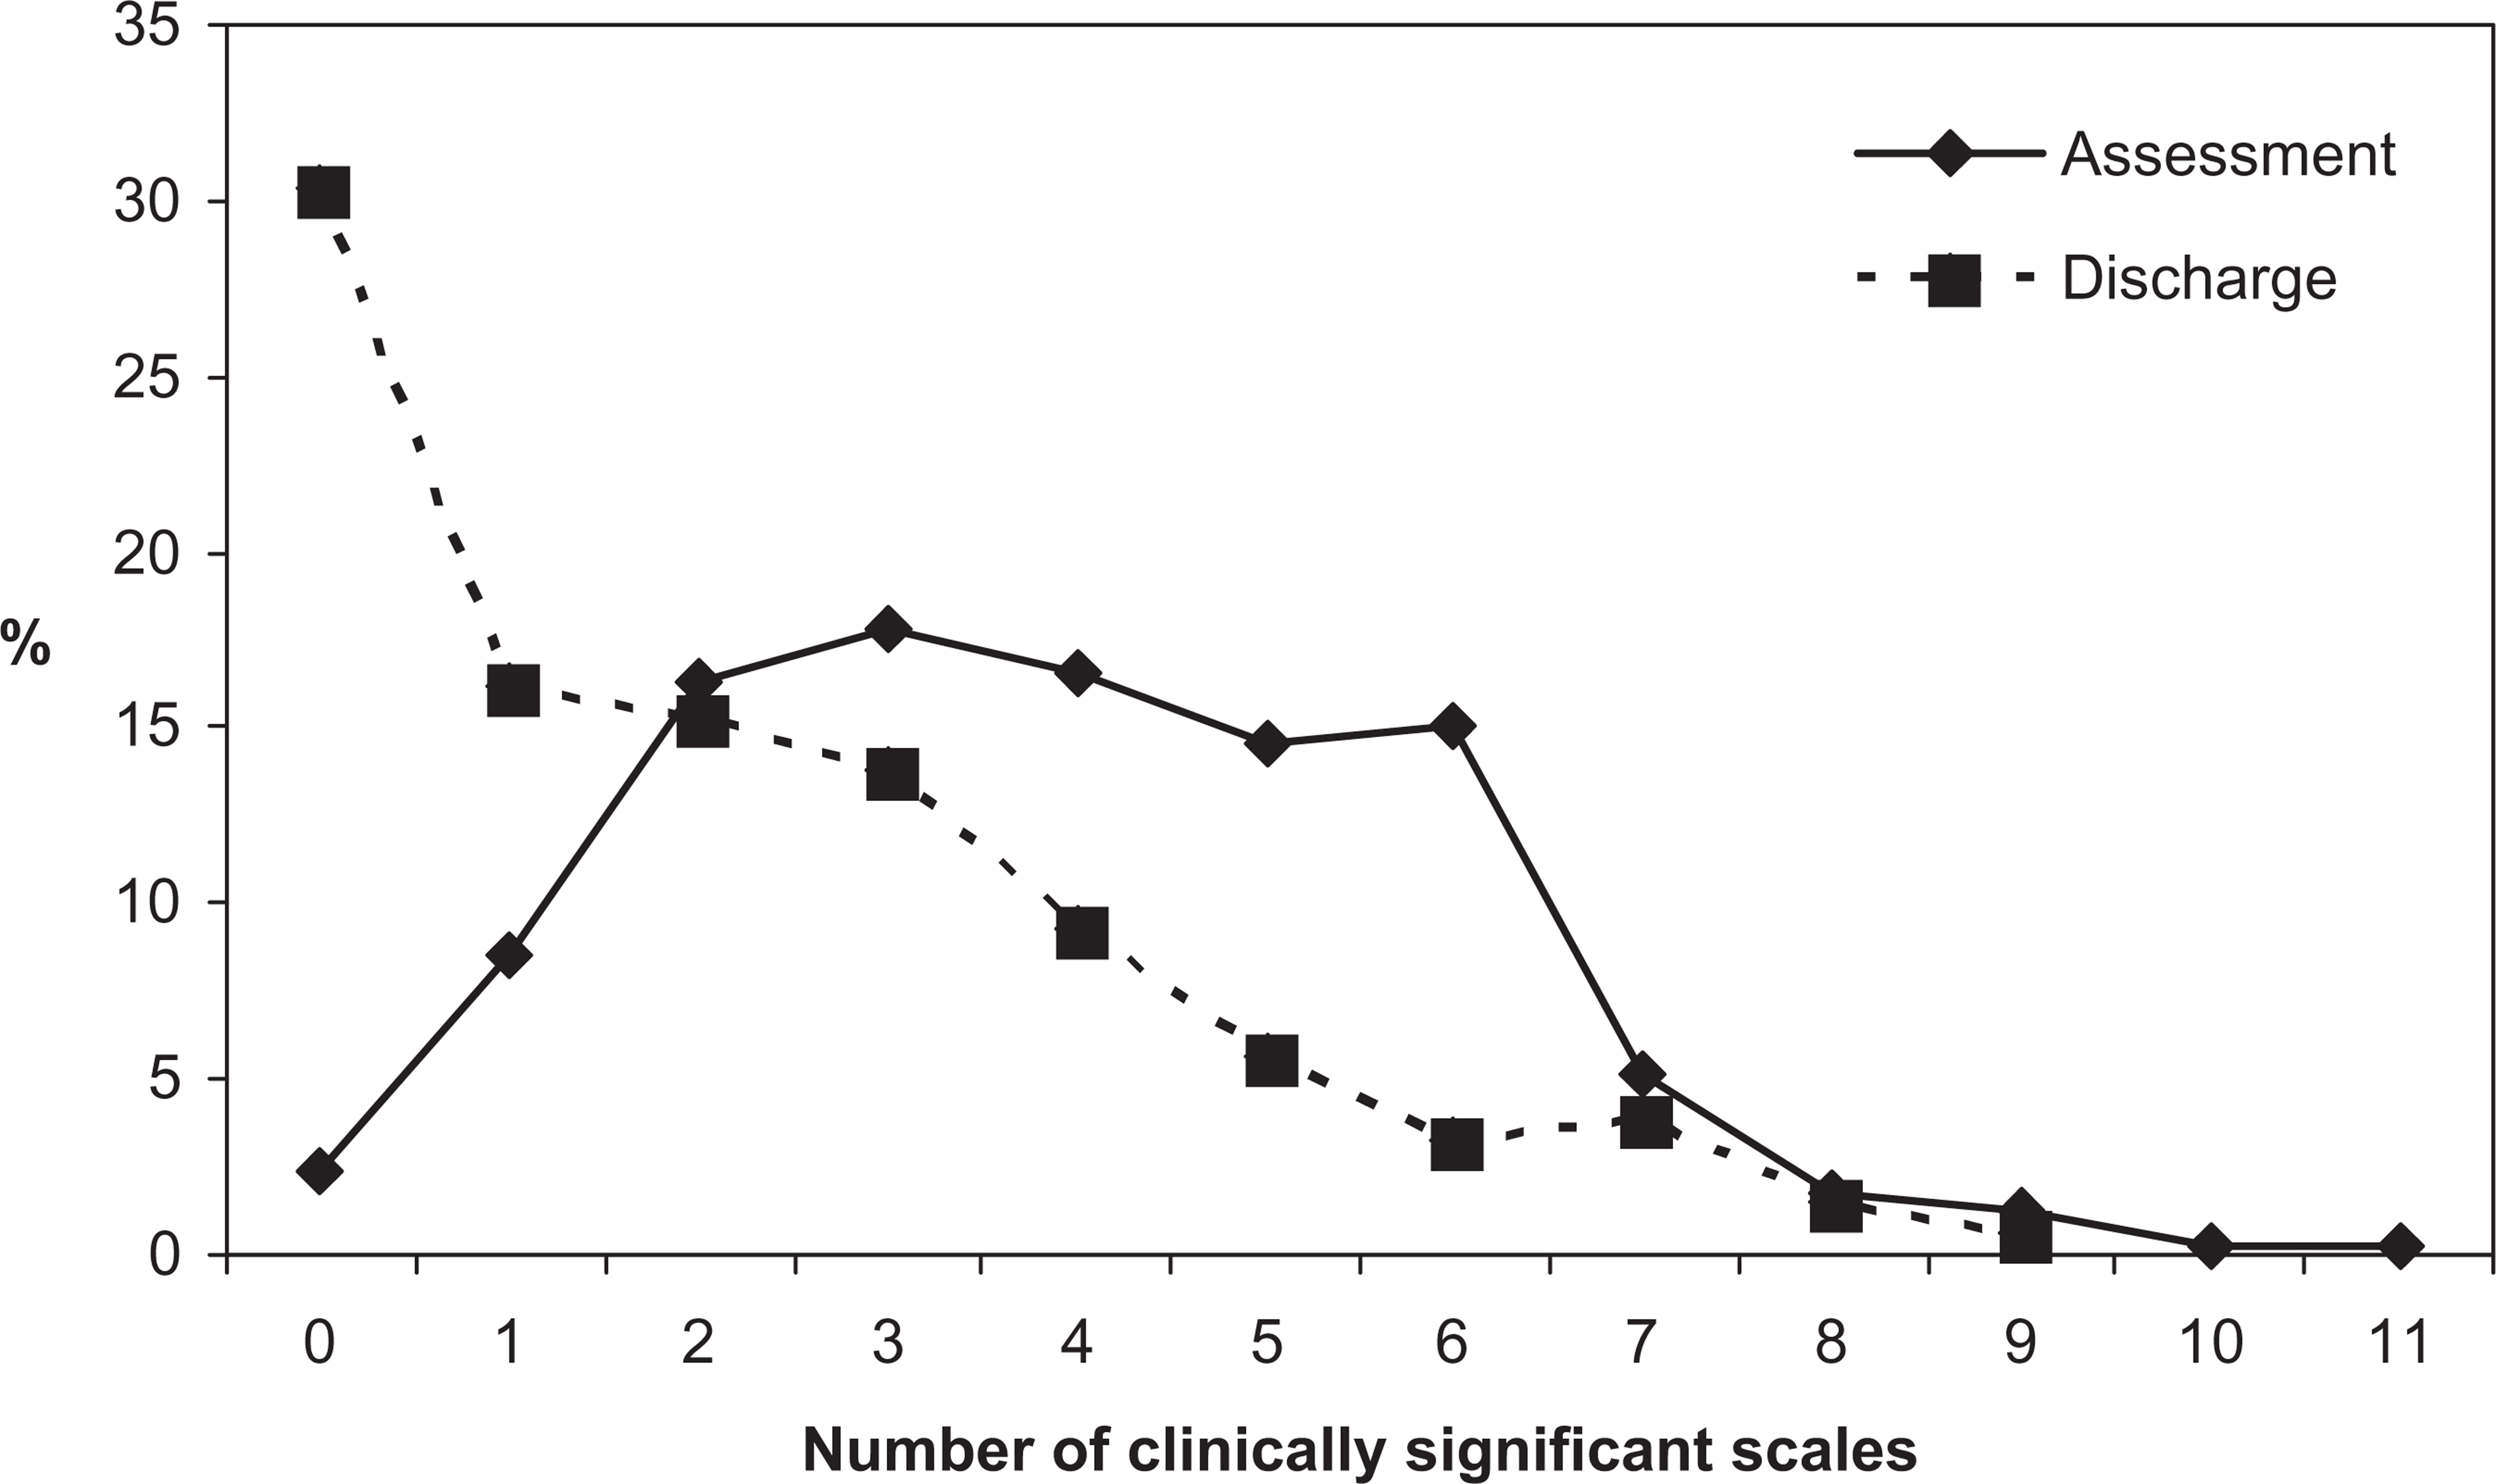
Number of clinically significant scales at assessment and discharge.
The reliable change index and the total score
The reliable change index (RCI) for the HoNOSCA total score can be calculated with a 95% confidence interval as [26]:
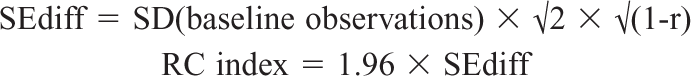
The obtained RCI for the total score in the current sample was 7.4; 1% of the sample would be considered to have reliably deteriorated. Reliable improvement occurred for 28.5% and the status of the remaining 70% would be classified as uncertain.
Who is included in estimates of change?
Previously it was noted that the mean scores for all scales decreased significantly from time 1 to time 2 with the exception of Abnormal perceptions. With completed treatment, Substance misuse did not appear to change. This is not solely a function of which collection occasions are included: the capacity of clients to change is important. The following analysis uses the clinically grounded dichotomy where ratings of two or greater indicate clinical significance (‘problem’) and zero or one as indicates a lack of clinical significance (‘no problem’) on that scale.
Using this dichotomy with Abnormal perceptions as the example, only 3% of the sample improved from clinically significant symptoms at assessment to clinically insignificant symptoms at discharge. However, when only those who had or developed a problem are included, 44% improved. Including only those who started with a problem resulted in 57% of the sample improving to the extent of having no clinically significant symptoms. Including those for whom improvement is impossible (i.e. they neither had nor developed a problem in this symptom area) underestimates the effectiveness of the treatment or intervention for those who have a problem in this area (Figure 3). Figure 3 also illustrates this issue for Disruptive, Self-harm, Substance misuse and Emotional symptoms.
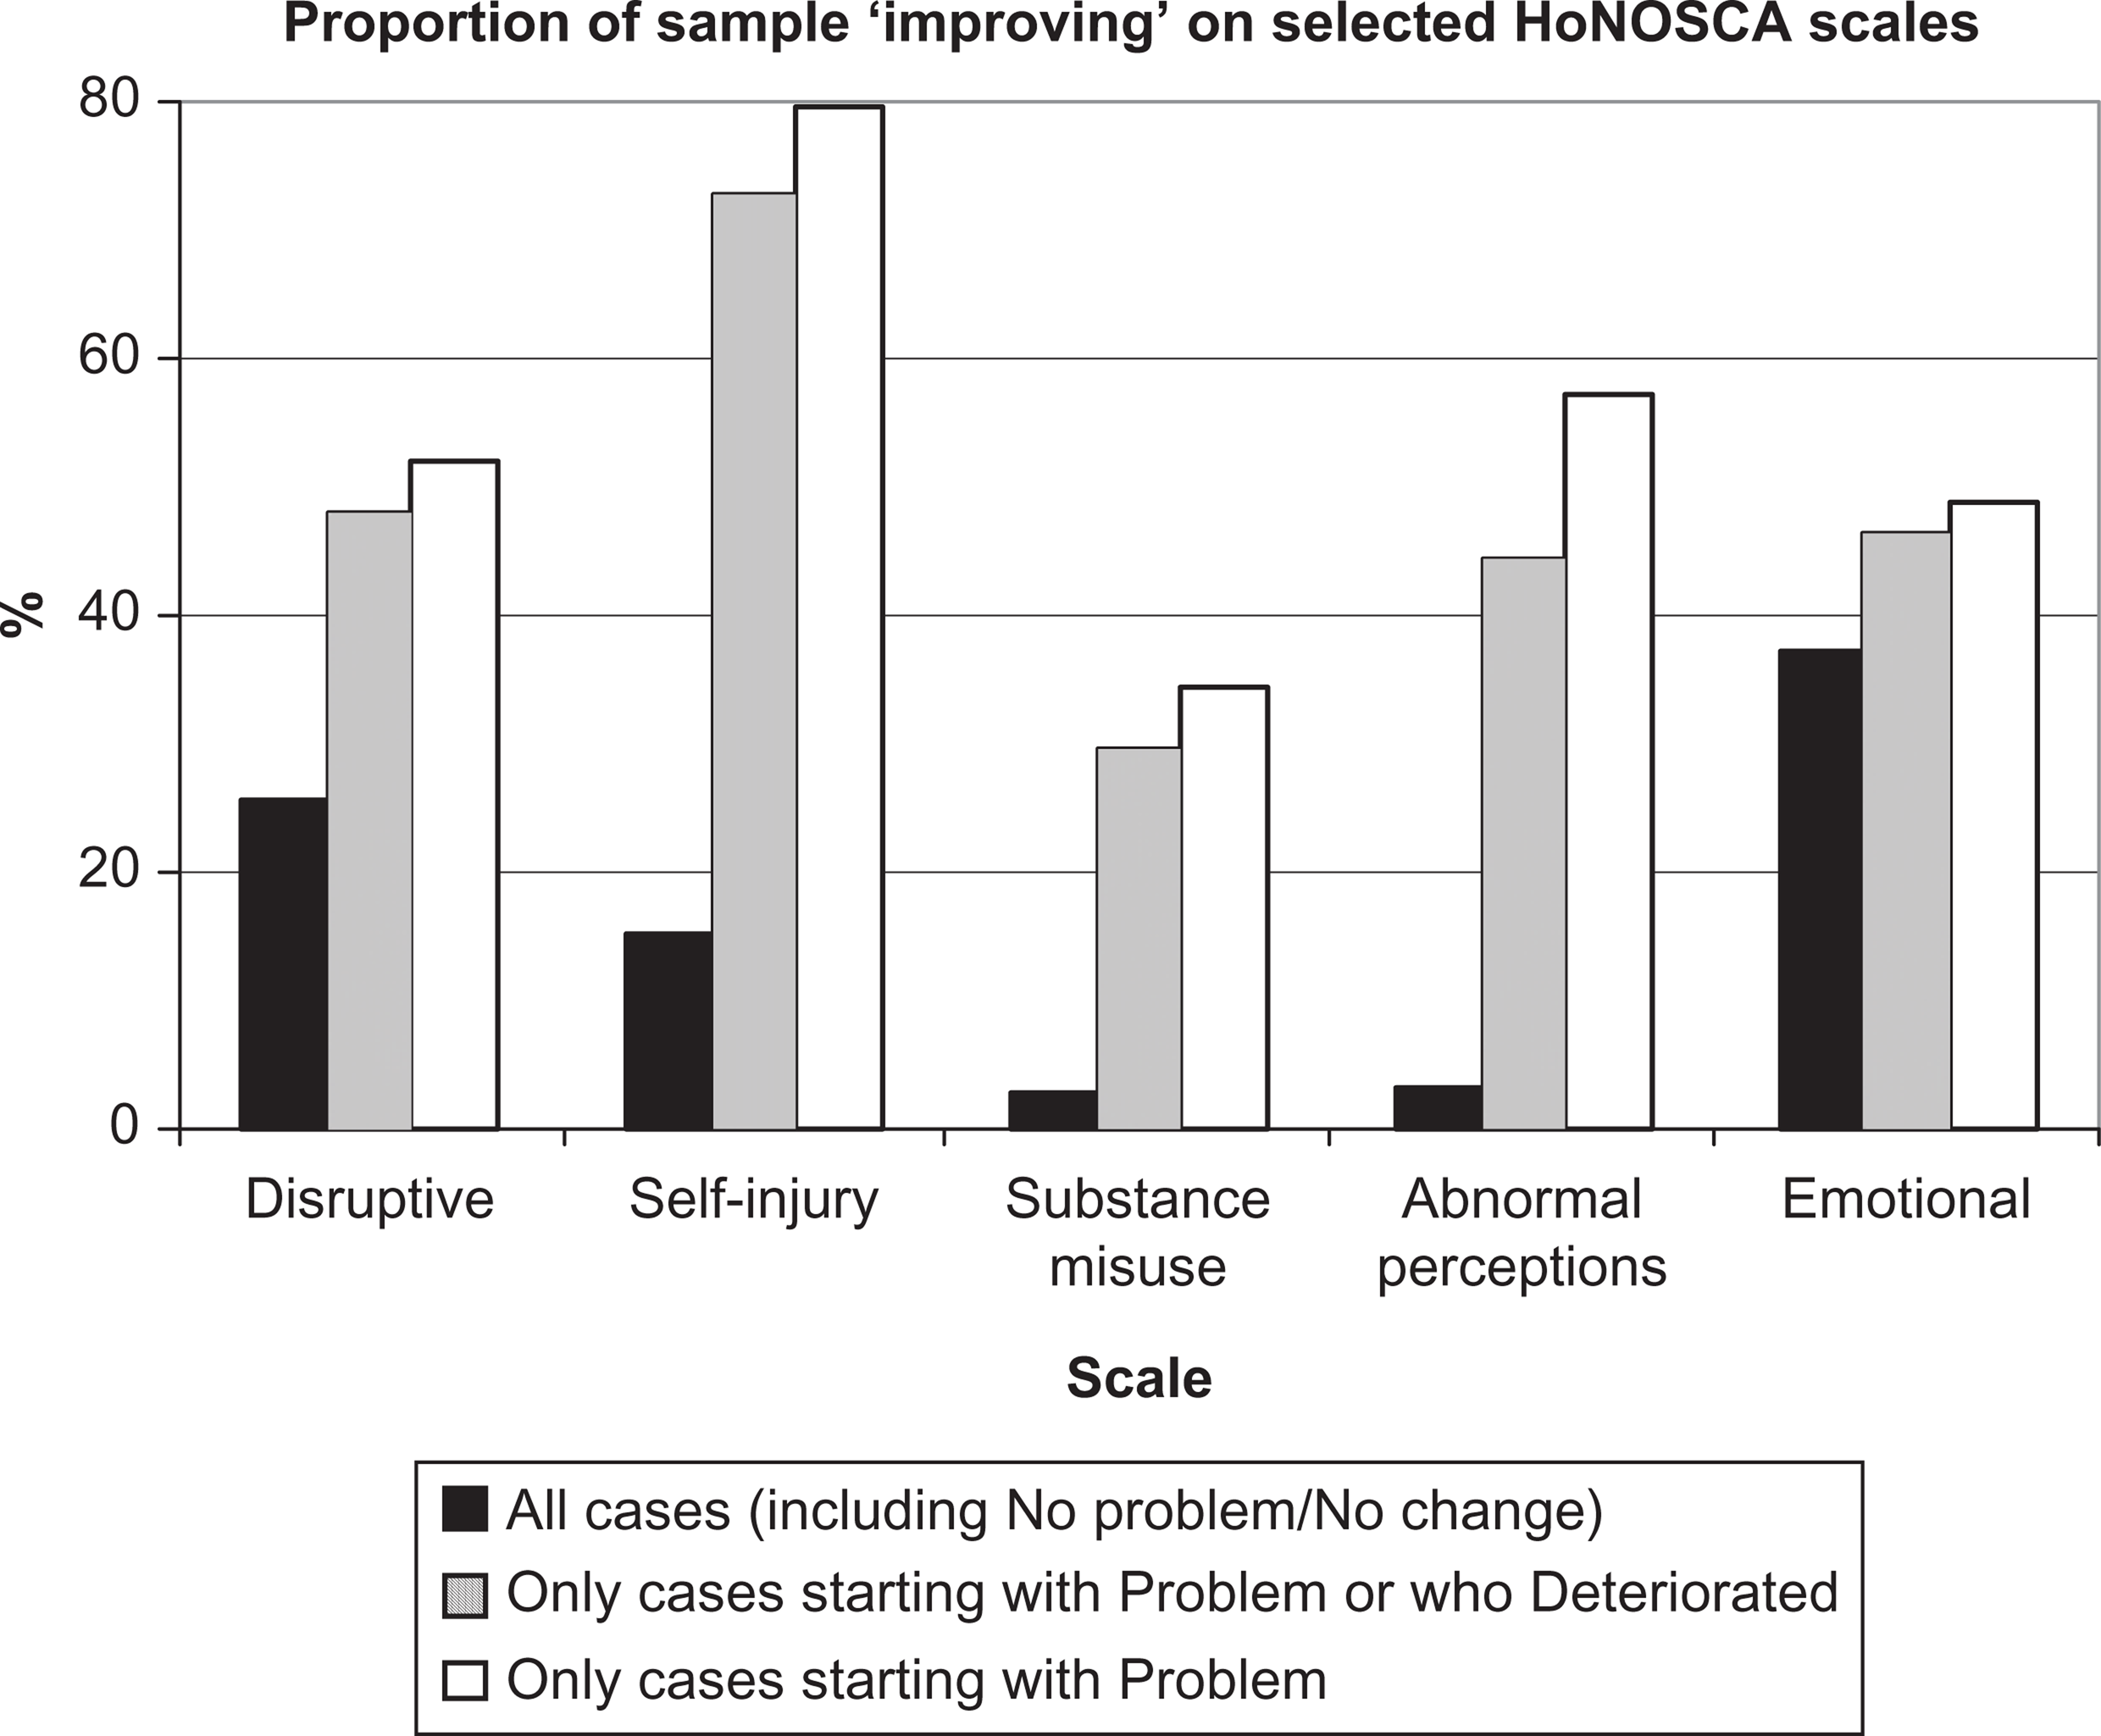
Percentage of patients improving from clinically significant symptoms for all cases, those who had or developed a problem, and those who had a problem.
Discussion
Irrespective of the method of evaluation, HoNOSCA is sensitive to change in clinical populations. There are statistically significant decreases in total score severity, decreases in the number of clinically significant scales, an effect size approaching one standard deviation and changes within individual scales. This sensitivity to change will be important to funding bodies seeking to ensure limited resources are directed efficaciously.
Using the RCI [25] appears to account for instruments’ reliability; however, there are important caveats. It is typically premised on higher confidence levels (95%) than characterizes clinical decision making. It has the usual statistical and logical problem where no reliable change occurs from assessment to review, from review to review, and from review to discharge, yet reliable change occurs from assessment to discharge. The clinical difficulty is the impact of feedback to patient, parent or clinician indicating there is not yet any reliable change. The suggestion that between assessment and review there has been no reliable change at the 95% confidence interval may be both accurate and simultaneously undermine everyone's motivation for continuing with treatment. It is prudent to account for the level of reliability of the instrument; however, privileging this approach to change is fraught with therapeutic risks. Intriguingly, the obtained RCI of seven from assessment to discharge is similar to the change required for clinicians to assess patients as ‘much better’ [16]. As HoNOSCA continues to appear reliable, valid and feasible enough for routine use, the calculation of reliable change across different parameters and conversion of this information to a form usable by consumers is an important challenge.
Wolpert
Funders are likely to seek a single indicator. Reduction in total scores indicates a drop in symptom severity that is relatively easy to understand although there is no absolute reference point indicating the clinical meaning of any particular total score. Both funders and parents may find difficulties interpreting the meaning of an ‘average decrease of x points’. It may be useful for services to document changes as a percentage of the assessment score. Expressing change as a percentage reduction in symptoms or as changes in percentile rankings may be easier to interpret [36, Table 1. 1.4.1] and enhance comparisons with similar services [40]. Improvement in the number of clinically significant scales is an important approach as it reflects both a qualitative improvement in symptomatology and contextualizes the statistically significant shift in the total score. For example, while only 2.4% had no clinically significant scales at time 1, almost 30% had no clinically significant scales at time 2.
However, all approaches that exclusively use the total score risk ignoring important changes on individual scales. For example, of those for whom there was no reliable change in the total score, almost one third actually improved in non-accidental self-harm from clinically significant to clinically insignificant symptoms.
Typically, all patients with valid data are included in analyses of change. Routine outcome measures are designed for real-world clinical services where the impact of statements such as, ‘there is no significant change in Hallucinations, Delusions or Abnormal perception symptoms for those attending this service’ is likely to be demoralizing for patients and clinicians alike. While that statement is accurate when all are included, it needs to be accompanied by the equally accurate observation that ‘of those who come here with problems in Hallucinations, Delusions or Abnormal perceptions, 57% will not have a clinically significant problem at discharge’. Including patients with no capacity for change in a specific problem area or those who have not finished treatment will underestimate the benefit received by those who have problems.
Excluding the ‘no problem, no change’ group neither minimizes the importance of the overall comparison nor artificially inflates the estimated effect size: It is aimed at answering a parent's question ‘Can you help my child with his or her problem?’ HoNOSCA appears to be able to contribute to answering these questions but the answer requires selecting the patients relevant to the analysis in question. Compared with funders, parents may be more interested in problem areas relevant to their situation. Use of the appropriate sample is also relevant to parametric analyses. Analyses of mean scores will be affected by the size of the ‘no problem, no change’ group. As the ‘no problem, no change’ group will vary by scale, there can be no global exclusion of a particular group of patients from analysis of change.
For those who arrived with a clinically significant problem, substantial proportions left EHCAMHS without clinically significant symptoms. Kiser
The approach of dividing HoNOSCA scale scores into clinically significant or insignificant categories may be more robust but it does risk obscuring other changes. A change in rating from severe disruptive problems to only mild problems is important yet will not occasion ‘improved’ status.
A limitation of the obtained effect size was the long test-retest period used to estimate reliability. Some authors consider one week to be optimal [42] for test-retest although the longer period may increase confidence that any effect is not overestimated. Importantly, while there is evidence of change, there was no control group and alternative interventions could have produced equal effect sizes [43]. Weisz and Jensen described effectiveness as relating to ‘evidence that a treatment has beneficial effects when delivered to heterogeneous samples of clinically referred individuals treated in clinical settings by clinicians rather than research therapists’ [44, p. 125]. While child psychotherapy studies have a mean effect size of 0.77, Weisz and Jensen noted that restricting estimates to actual effectiveness studies produced a much lower effect size (0.01). The effect size in the current study was much larger at 0.79, and comparable to the effect size of 0.88 on HoNOSCA scores recently reported from the first round of the Australian national outcomes dataset [36]. In any analysis where random allocation to contrasting and equivalent groups is not possible, caution in interpretation is essential [45]. Simply put, it is not possible to conclude that this, or any Australian CAMHS produced greater effects with real patients and real clinicians than the published clinical effectiveness studies. With mounting support for HoNOSCA's validity, future clinical research will be better placed to examine alternative approaches or compare groups in routine clinical settings using HoNOSCA.
In conclusion, routine outcome measurement is an important yet recent development in CAMHS. Whether using categorical or reliable change approaches, total scores or individual scales, services need to carefully consider the impact of outcomes information on parents, patients and clinicians. Selection of the correct denominator for assessing change is crucial. The impact of feedback on engagement and motivation is likely to be an important area for research. It may be premature to settle on one index of change. All have strengths and flaws. It is only through ongoing use and comparison of different approaches that we can truly understand what questions they may be addressing.
Footnotes
Acknowledgements