
Abstract
Idiopathic unconjugated hyperbilirubinemia (Gilbert's syndrome; GS) is a relatively common congenital hyper-bilirubinemia occurring in 3–7% of the population [1]. In Japan, the prevalence of this syndrome is 2.4% (3.3% in men, 1.6% in women) in general healthy populations [2]. Since the condition was first described in 1901 [3], it has been recognized as being a benign familial condition in which hyperbilirubinemia occurs in the absence of structural liver disease or haemolysis while the plasma concentration of conjugated bilirubin is normal. This benign but chronic disorder encompasses a heterogeneous group of biochemical defects. The precise mode of inheritance is still unclear, and this syndrome occurs sporadically in many patients.
Recently it was reported that unconjugated bili-rubin had a neurotoxic effect on the developing nervous system [4]. The evidence linking schizophrenia to neuropathological changes in the brain and to early brain development (the so-called neurodevelopmental hypothesis) consists of increased frequency of minor physical anomalies and obstetric complications, increased association with prenatal viral exposure, premorbid cognitive and neuromotor abnormalities, morphological deviations in neuroimaging studies, morphometric deviations without gliosis in necropsy studies, and cytoarchitectural abnormalities in histo-logical studies [5]. This suggests that schizophrenia is due to subtle neuropathological changes occurring in utero or early postnatal life.
It has been reported that schizophrenia patients have a significantly higher frequency of hyperbilirubinemia relative to patients suffering from other psychiatric disorders and the general healthy population [6]. Dalman and Cullberg reported that neonatal hyperbilirubinemia might be a vulnerability factor in mental disorders [7]. We also have observed that patients suffering from schizophrenia frequently present an increased bilirubin plasma concentration when admitted to the hospital [8,9]. Moreover, schizophrenia patients with GS had a significant enlargement of almost all cerebrospinal fluid (CSF) spaces on brain computed tomography (CT) [10]. Furthermore, considering the heterogeneity of schizophrenia, there may be a poor prognosis for the subtype of schizophrenia with GS [11].
Our previous fluid-attenuated inversion recovery (FLAIR) magnetic resonance imaging (MRI) study, using the subjective rating method, suggested abnormalities in the hippocampus, amygdala, thalamus, anterior cingulate gyrus, insular cortex, and cerebellar vermis in patients with schizophrenia and GS [12,13]. Moreover, proton magnetic resonance spectroscopy of patients with schizophrenia with GS showed metabolic abnormalities in the hippocampus, basal ganglia, cerebellar vermis, anterior cingulate gyrus, insular cortex, and thalamus [14, 15].
Parameters of the MRI signal are useful indices of tissue integrity, and can be applied to the in vivo study of tissue pathology. In MRI, T1 relaxation time is sensitive to the quantity of hydrogen protons in tissue. Abnormally highly MR-visible water in tissue may result from pathologies such as abnormalities in the microtubular density in the cytoarchitecture of axon, or alterations in myelination or fibre density. In our previous FLAIR MRI study it was reported that the intensities were subjectively graded relative to cortical signal intensity in the frontal lobe by neuroradiologists [13]. The approach adopted in the present study was componential. Thus, an objective analysis of regions of interest (ROIs) may shed light on the specific brain regions with impaired neuronal integrity.
In the present study MRI was performed to determine whether schizophrenia patients with GS have specific changes in signal intensity on T1- and T2-weighted MRI via the more objective rating method than the previous FLAIR MRI findings [13].
Methods
Subjects
Schizophrenia patients diagnosed using DSM-IV criteria [16] with GS (n=24) and without GS (n = 60) were recruited. Subjects were outpatients or inpatients without acute psychiatric symptoms at the Department of Psychiatry, Shimane University School of Medicine Hospital. All patients were evaluated using the Structured Clinical Interview for DSM-IV (SCID). Furthermore, the diagnoses were determined by consensus of three senior psychiatrists based on extended interviews and medical chart reviews. Psychiatric symptoms were rated by a senior psychiatrist (TM) who was unaware of the MRI findings and diagnosis (with or without GS), using the Brief Psychiatric Rating Scale (BPRS) [17] and the Positive and Negative Syndrome Scale (PANSS) [18], on the same day as the MRI examination. Patients were matched for age and sex with healthy controls with (n=36) and without GS (n = 60; Table 1). Psychiatric symptoms (BPRS, PANSS) were not significantly different between schizophrenia patients with GS and without GS. None of the control subjects had any history of psychiatric disorders as evaluated on Structured Clinical Intrerview for DSM-IV–Non-Patient edition (SCID-NP), such as organic illness, alcoholism, or drug abuse. All schizophrenia patients were treated with neuroleptic agents, and all subjects were right-handed. The handedness was defined by the Edinburgh inventory [19]. After a complete and thorough description of the study was given to the subjects, written informed consent was obtained. All subjects gave informed consent according to institutional guidelines and the recommendations of the Declaration of Helsinki. The study was approved by the Ethics Committee (institutional review board) of Shimane University School of Medicine.
Subject characteristics
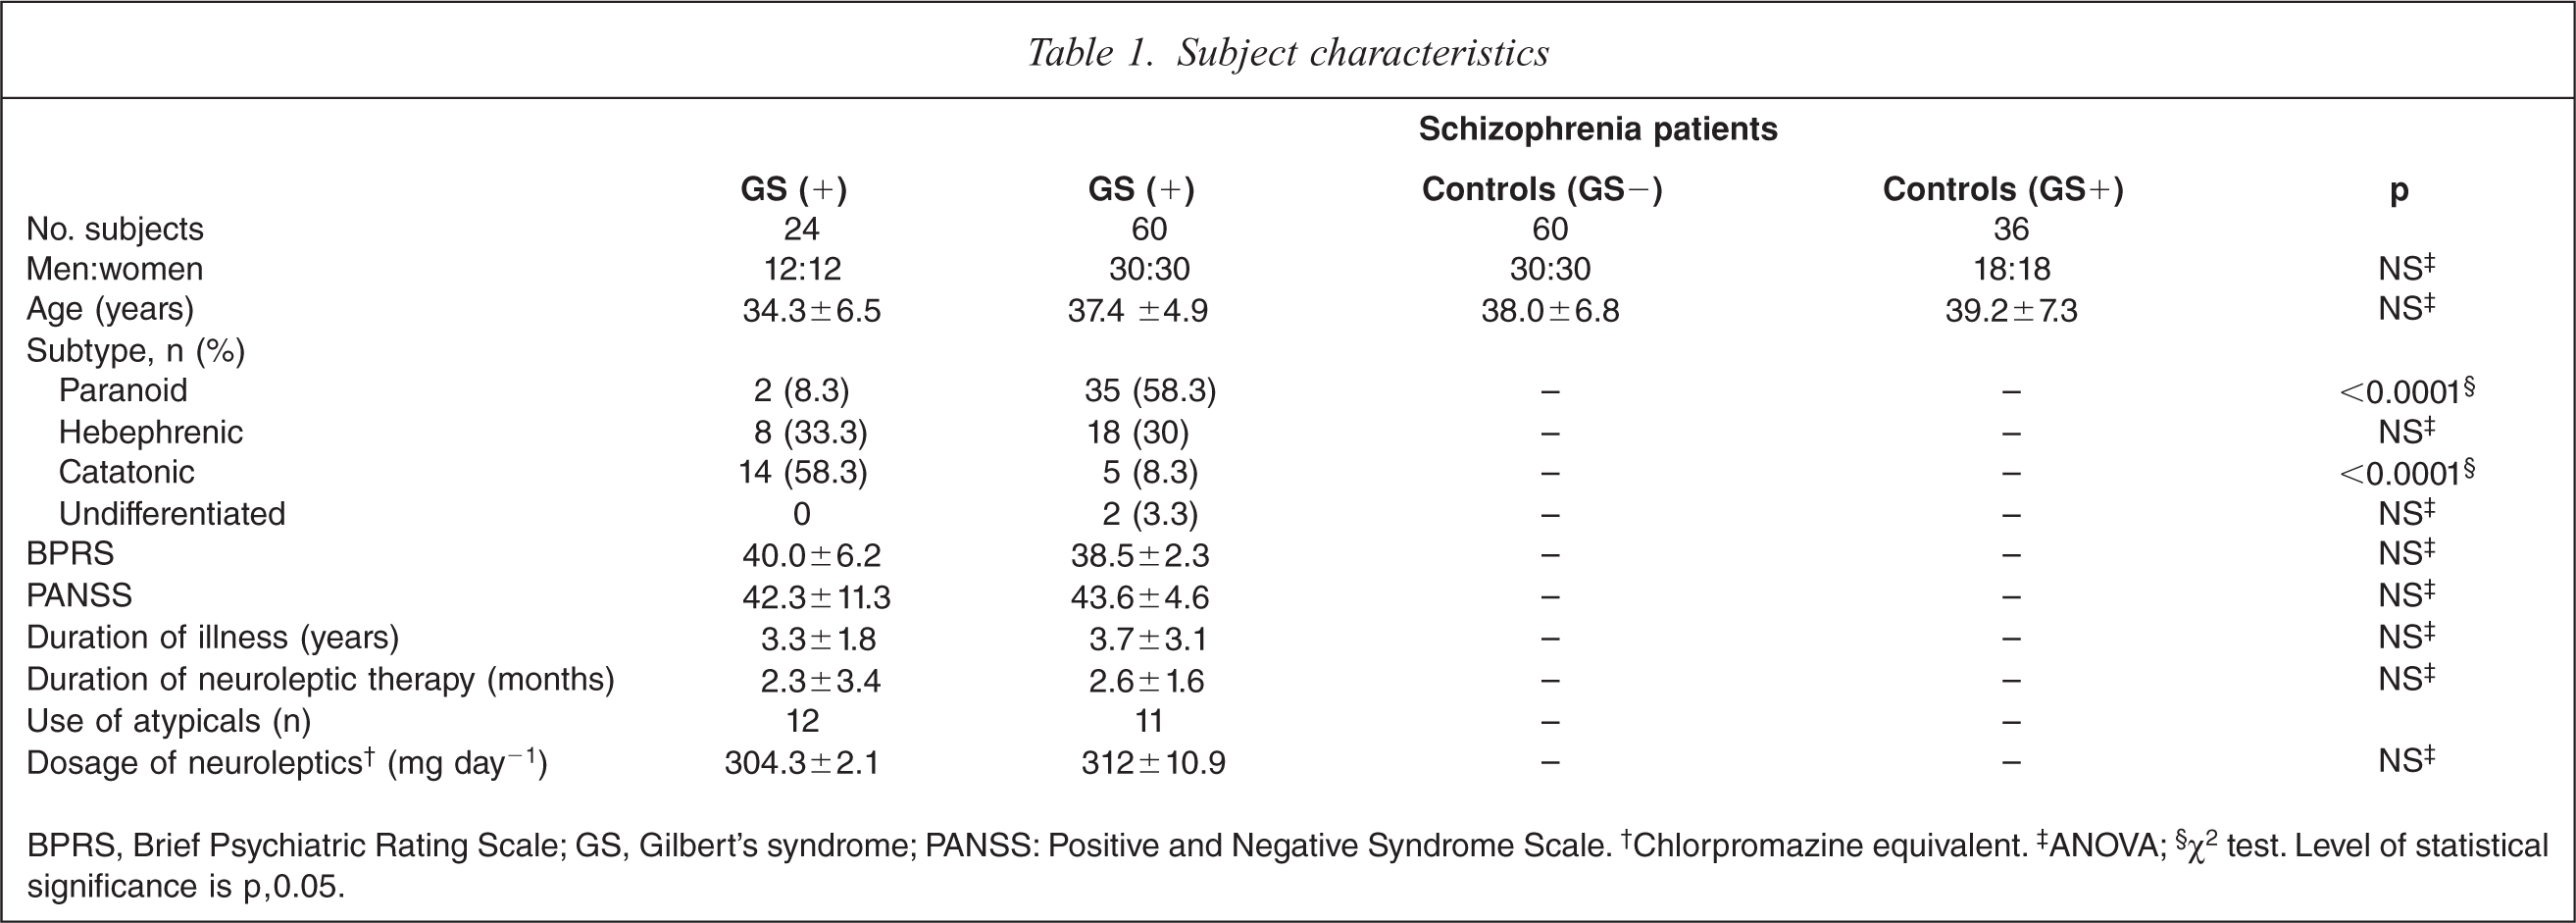
BPRS, Brief Psychiatric Rating Scale; GS, Gilbert's syndrome; PANSS: Positive and Negative Syndrome Scale. †Chlorpromazine equivalent. ‡ANOVA; §χ2 test. Level of statistical significance is p, 0.05.
Magnetic resonance imaging
MRI was performed using a General Electric (GE) Signa 1.5 T MRI system (GE Medical Systems, Milwaukee, WI, USA) with a standard head coil. T1- and T2-weighted fast spin echo images were obtained of sagittal and axial views of the brain (5 mm section thickness with 1 mm section gap). In all subjects, T1-weighted imaging parameters were repetition time (TR) = 670 ms, echo time (TEeffective) = 14 ms, 19 sections with an echo train length of 7, acquisition matrix = 256 × 256, and field of view (FOV) = 24 × 18 cm. T2-weighted imaging parameters were TR = 4500 ms, TEeffective = 96 ms with an echo train length of 7, acquisition matrix = 256 × 256, and FOV = 24 × 18 cm. The image data were identified by scan number alone in order to preserve anonymity, and were analysed using NIH IMAGE software (version 1.63) [20]. Using the co-registered axial T2-weighted MRI to identify anatomy, an individual circular ROI (diameter = 8.14 pixels) was selected within each of the following structures: hippocampus, amygdala, caudate, putamen, globus pallidus, thalamus, anterior cingulate gyrus, posterior cingulate gyrus, insular cortex, and cerebellum (Figure 1).
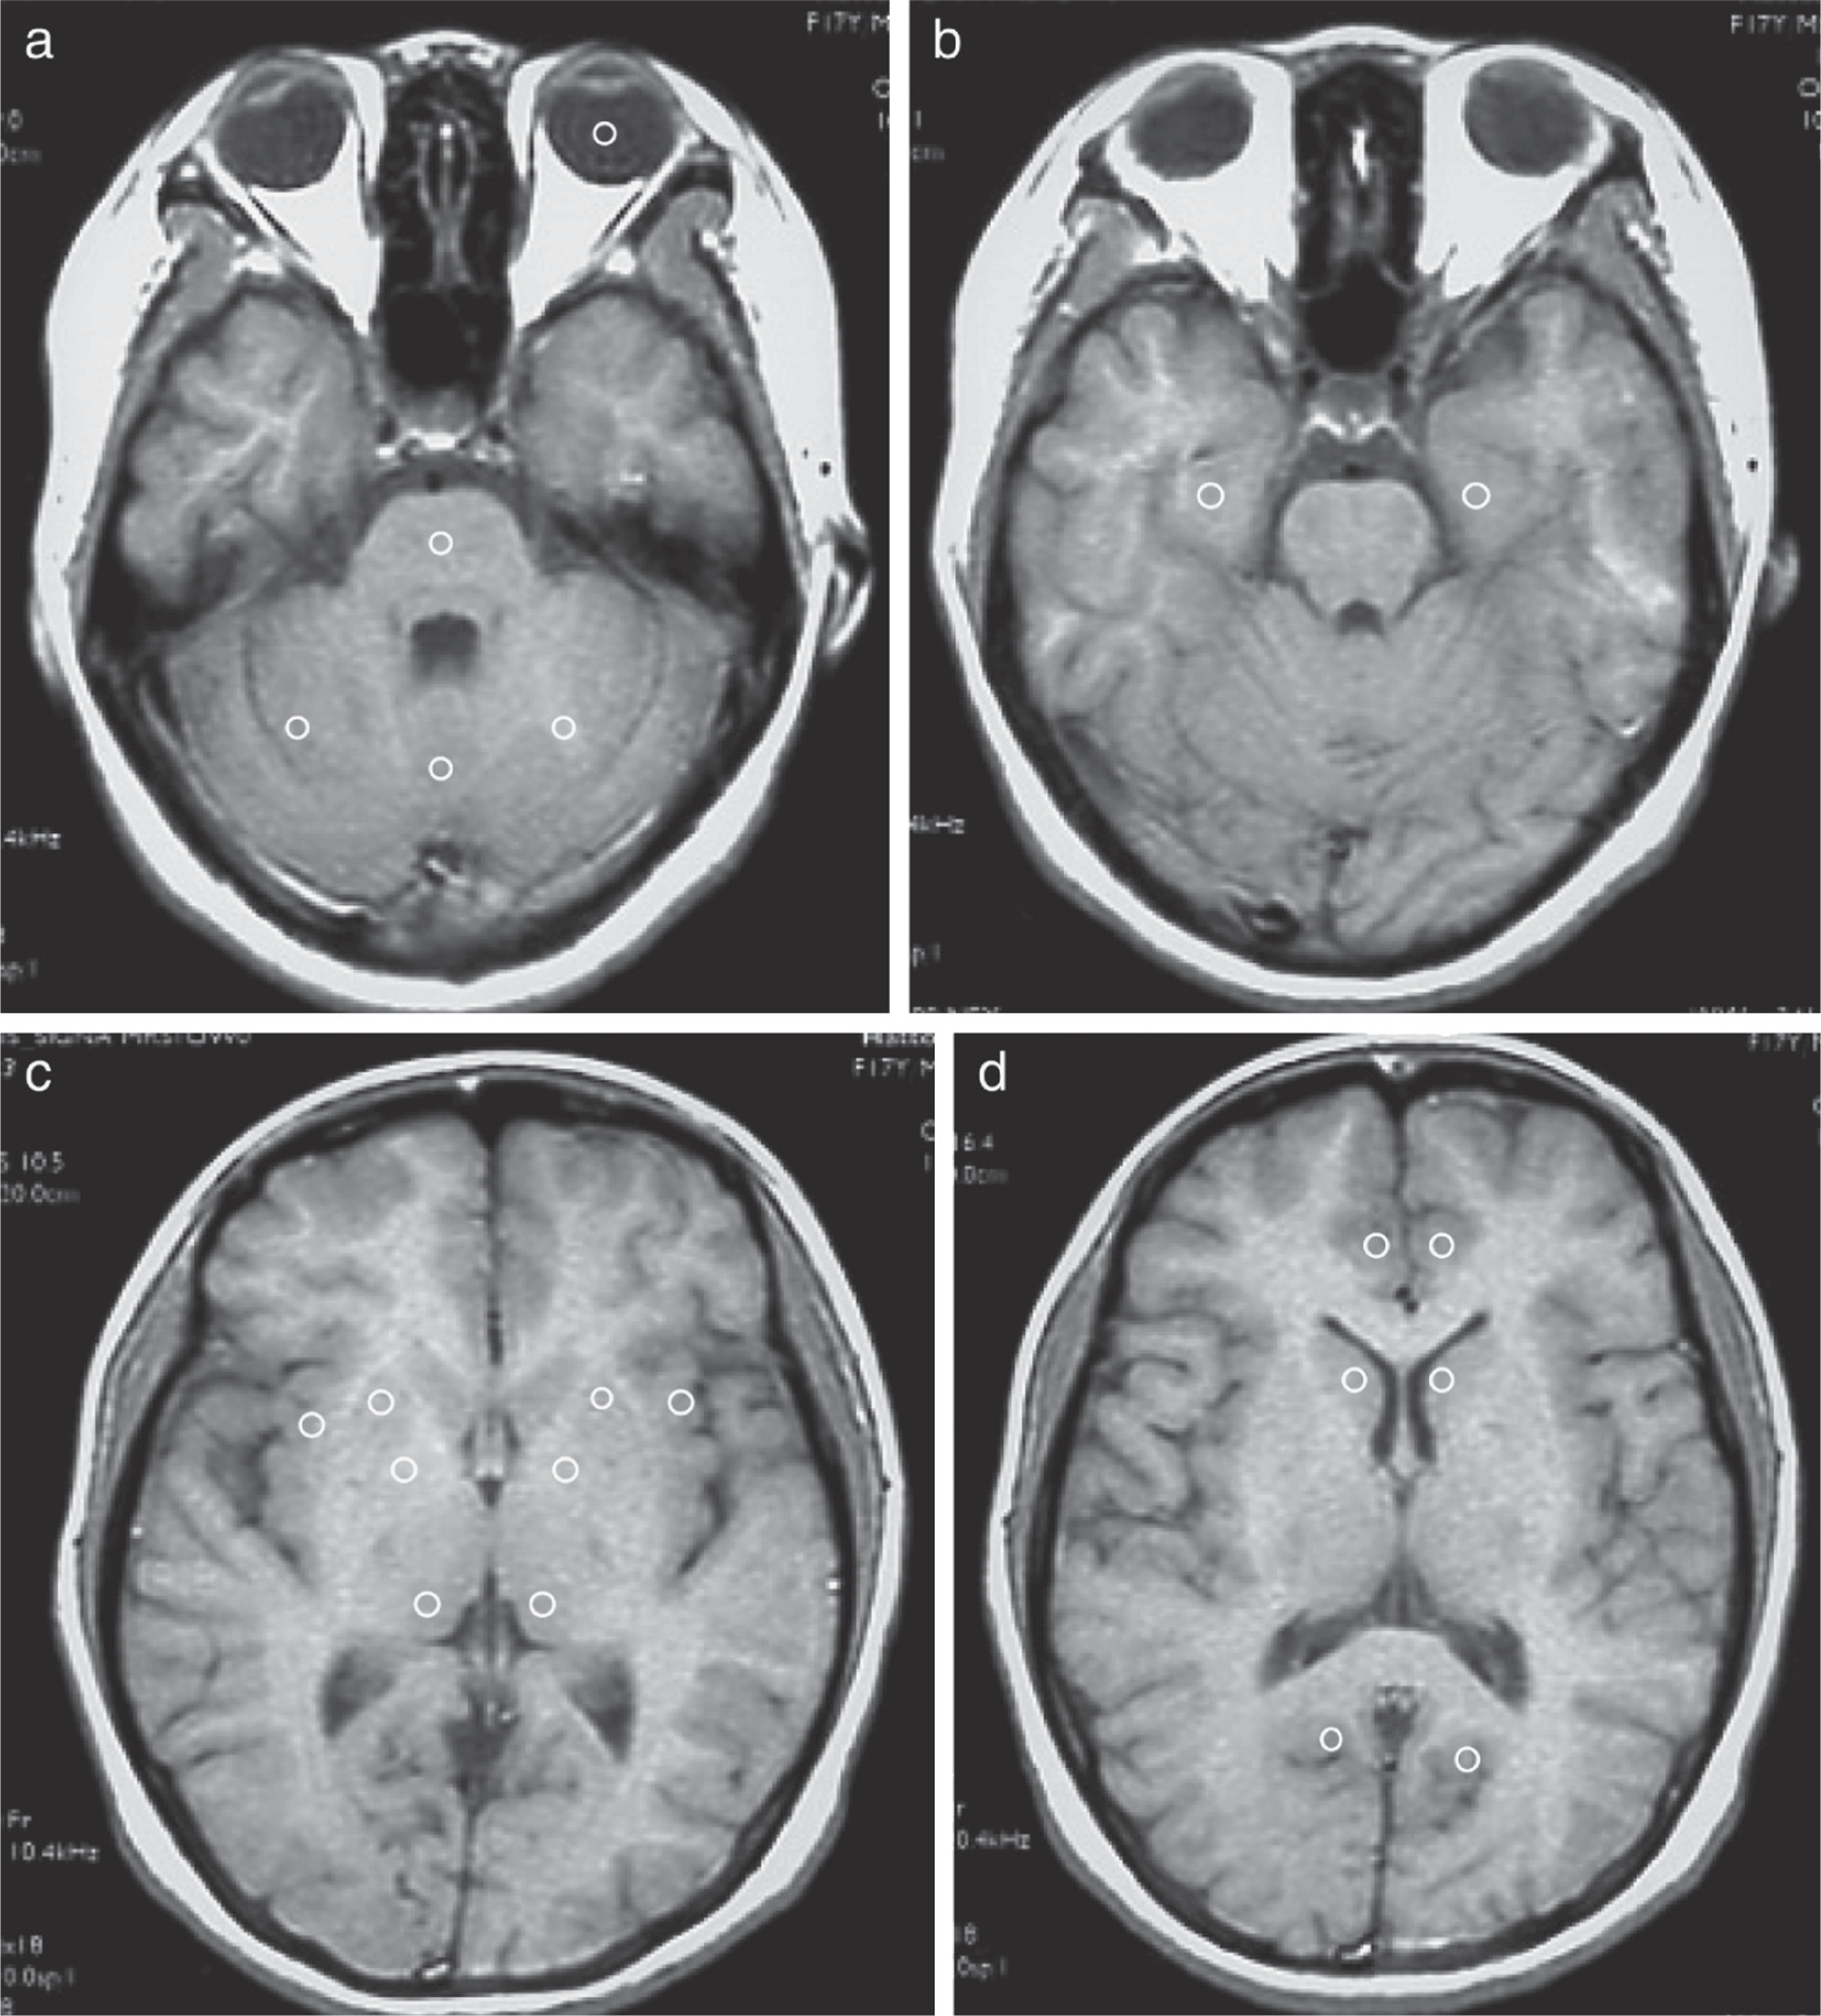
Horizontal T1-weighted magnetic resonance imaging of circular regions of interest in the (a) vitreous body, amygdala, pons, (b) cerebellum, hippocampus, (c) insular cortex, putamen, globus pallidus, thalamus, (d) caudate, and anterior and posterior angulate gyrus in schizophrenia patients.
Circular ROI placements and all data analysis were carried out by a trained radiologist who was unaware of the subject's diagnosis. The size used was easiest to fit within each region, thereby minimizing the effects of partial volume. For each subject, the signal from each ROI was normalized by dividing it by the signal intensity of a similarly sized ROI in a homogeneous region of the vitreous humour. Therefore, the normalization and intensity of non-neural structure rendered the data comparable across age and acquisition conditions. All analyses were conducted on the normalized signal intensities [20].
Statistics
To compare the effects of schizophrenia diagnosis, GS diagnosis and hemisphere, three different two-way repeated measures analysis of variance (ANOVA) were carried out for each ROI. All data are expressed as mean±SD. After we confirmed equal distribution by F-test, ANOVA with post-hoc Bonferroni protective least-significance difference (PLSD) was used to test for group differences in signal intensity, means of age, BPRS, PANSS, duration of illness, neuroleptic therapy, and mean dosage of neuroleptics. Post-hoc paired t-test was used when significant effects and interactions were found. χ 2 tests were used for the sex ratio, subtype of schizophrenia, and use of atypical antipsychotics. The level of statistical significance was set at p<0.05.
Results
Global group characteristics
General features of the schizophrenia patients with and without GS and control subjects with and without GS are shown in Table 1. There were no significant differences in sex, age, and dosage of antipsychotics (chlorpromazine equivalents) on χ2 test or ANOVA with post-hoc Bonferroni PLSD. There were no significant differences in severity of psychotic symptoms (BPRS and PANSS), duration of illness, duration of drug therapy, or dosage of atypical antipsychotics. In patients with GS, catatonic (n= 14) and hebephrenic (n = 5) were the most common schizophrenia subtypes, while in those without GS, paranoid (n=35) and hebephrenic (n = 18) schizophrenia subtypes were most common.
Hippocampus
On T1-weighted MRI, schizophrenia patients with GS had significant decrease of intensity compared to control subjects without GS on both sides (F(7359) = 7.99, p<0.001; Table 2). On T2-weighted MRI, schizophrenia patients with GS had significant increases compared to control subjects without GS on both sides, and control subjects with GS on the left side (F(7359)=4.72, p<0.05). MRI analysis indicated a significant interaction of GS diagnosis and schizophrenia diagnosis, and no difference in hemisphere.
Signal intensity and the effect of schizophrenia and GS: hippocampus
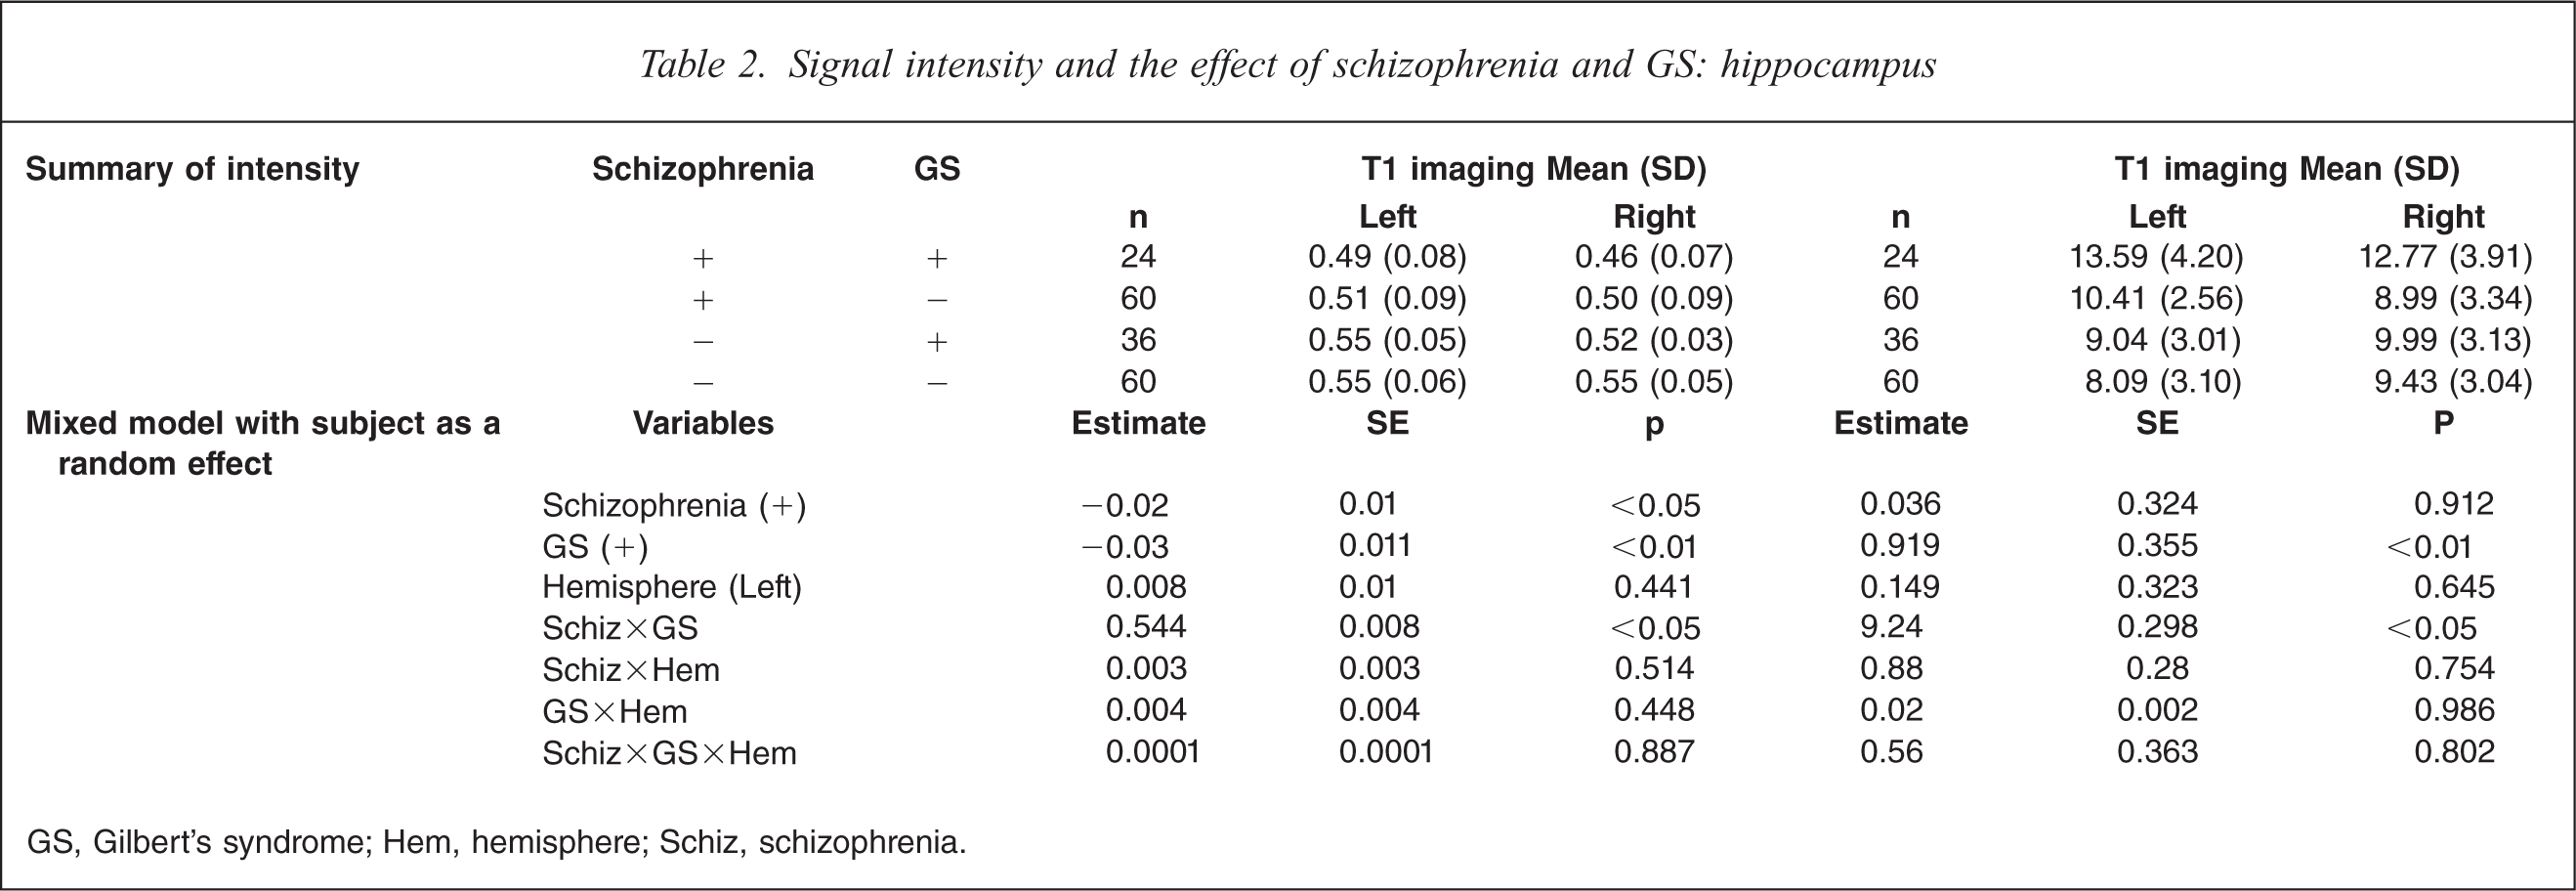
GS, Gilbert's syndrome; Hem, hemisphere; Schiz, schizophrenia.
Amygdala
On T1-weighted MRI, schizophrenia patients with GS had significant decrease of intensity compared to control subjects without GS on both sides and control subjects with GS on the left side (F(7,359) =4.74, p<0.05; Table 3). On T2-weighted MRI, schizophrenia patients with GS had significant increases compared to control subjects without GS, and control subjects with GS (F(7359) = 12.45, p<0.0001). MRI analysis indicated a significant interaction of GS diagnosis and schizophrenia diagnosis, and no difference in hemisphere.
Signal intensity and the effect of schizophrenia and GS: amygdala
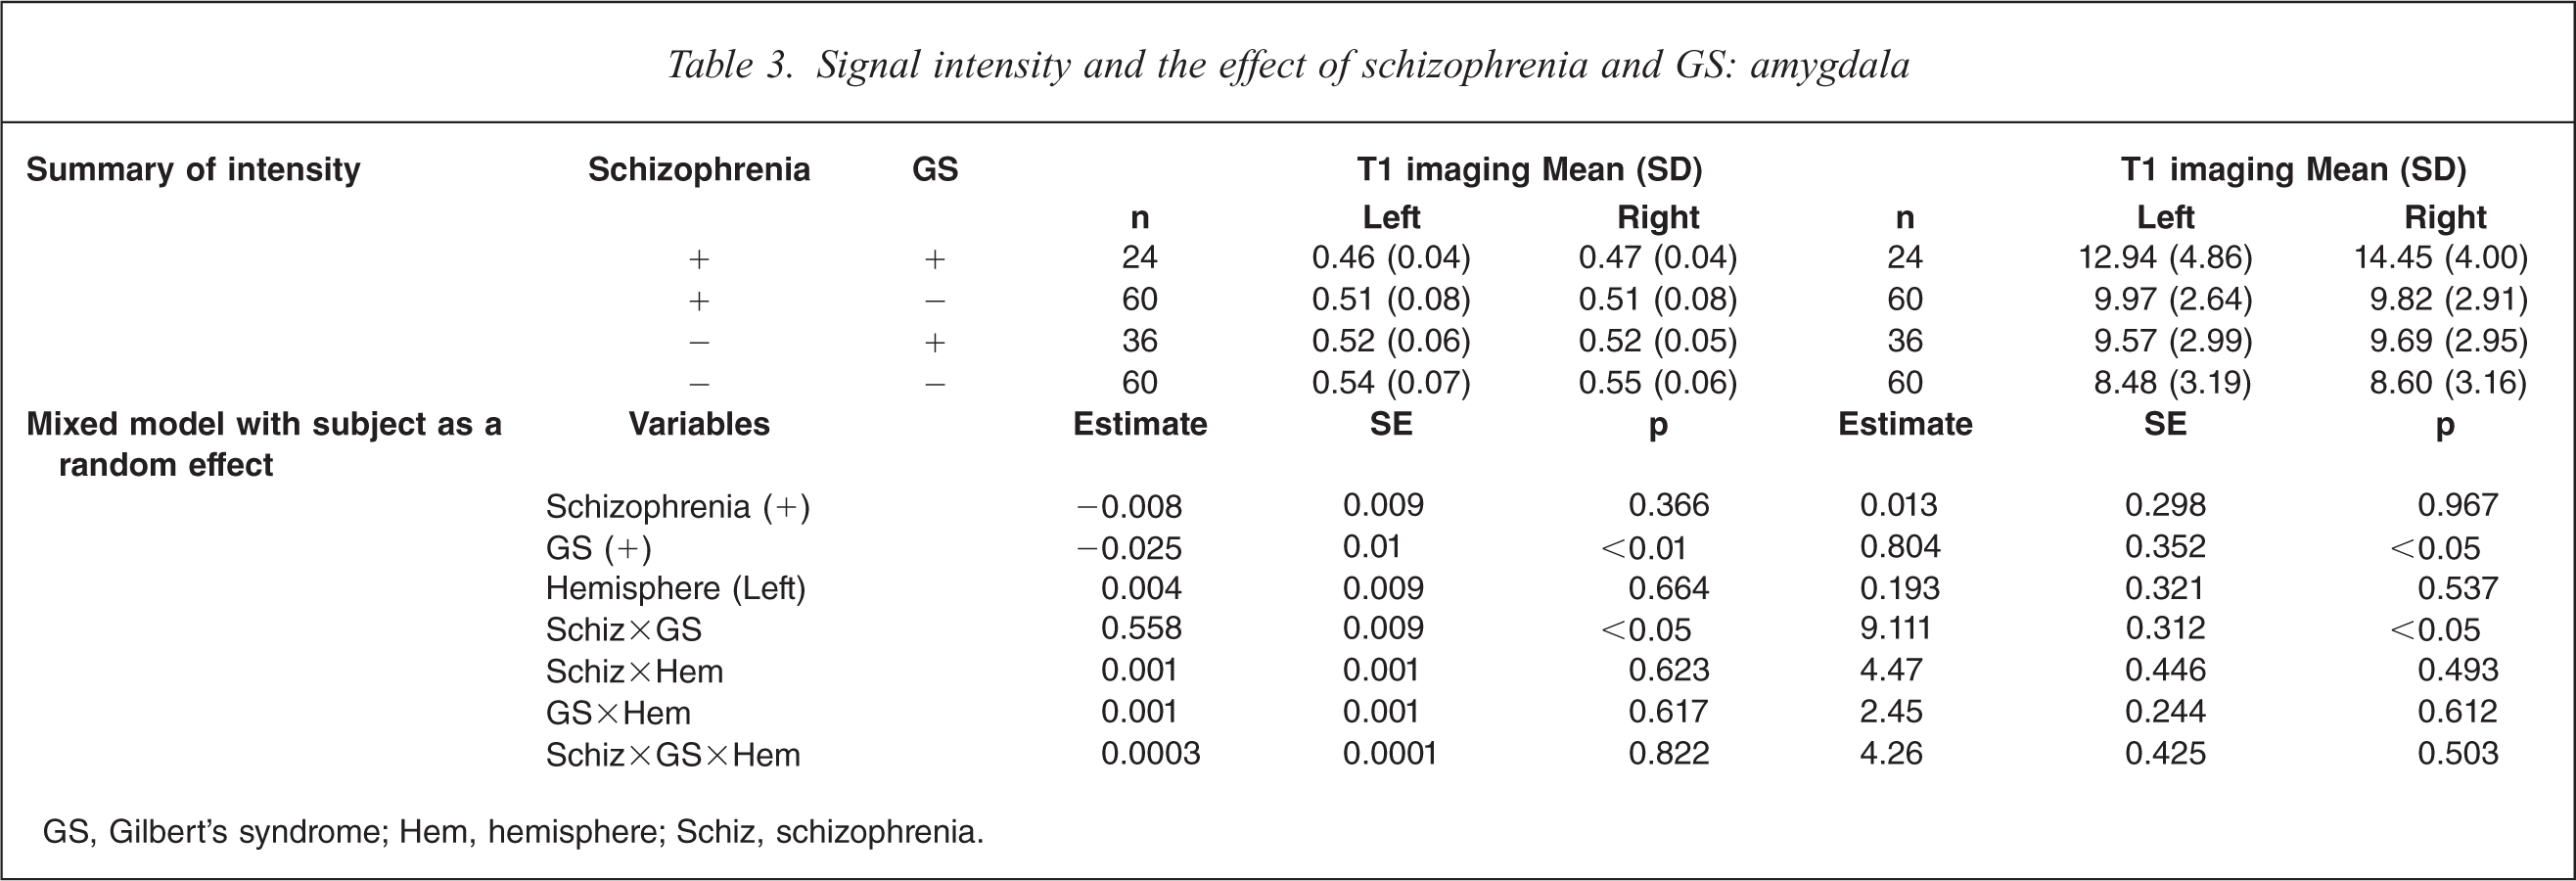
GS, Gilbert's syndrome; Hem, hemisphere; Schiz, schizophrenia.
Insular cortex
On T1-weighted MRI, schizophrenia patients with GS had significant decrease of intensity compared to control subjects without GS on both sides (F(7,359) = 4.12, p<0.05; Table 4). On T2-weighted MRI, schizophrenia patients with GS had significant increases on both sides compared to control subjects without GS and control subjects with GS, and to schizophrenia patients without GS (F(7359) = 13.51, p<0.0001). MRI analysis indicated a significant interaction between GS diagnosis and schizophrenia diagnosis, and no difference in hemisphere.
Signal intensity and effect of schizophrenia and GS: insula
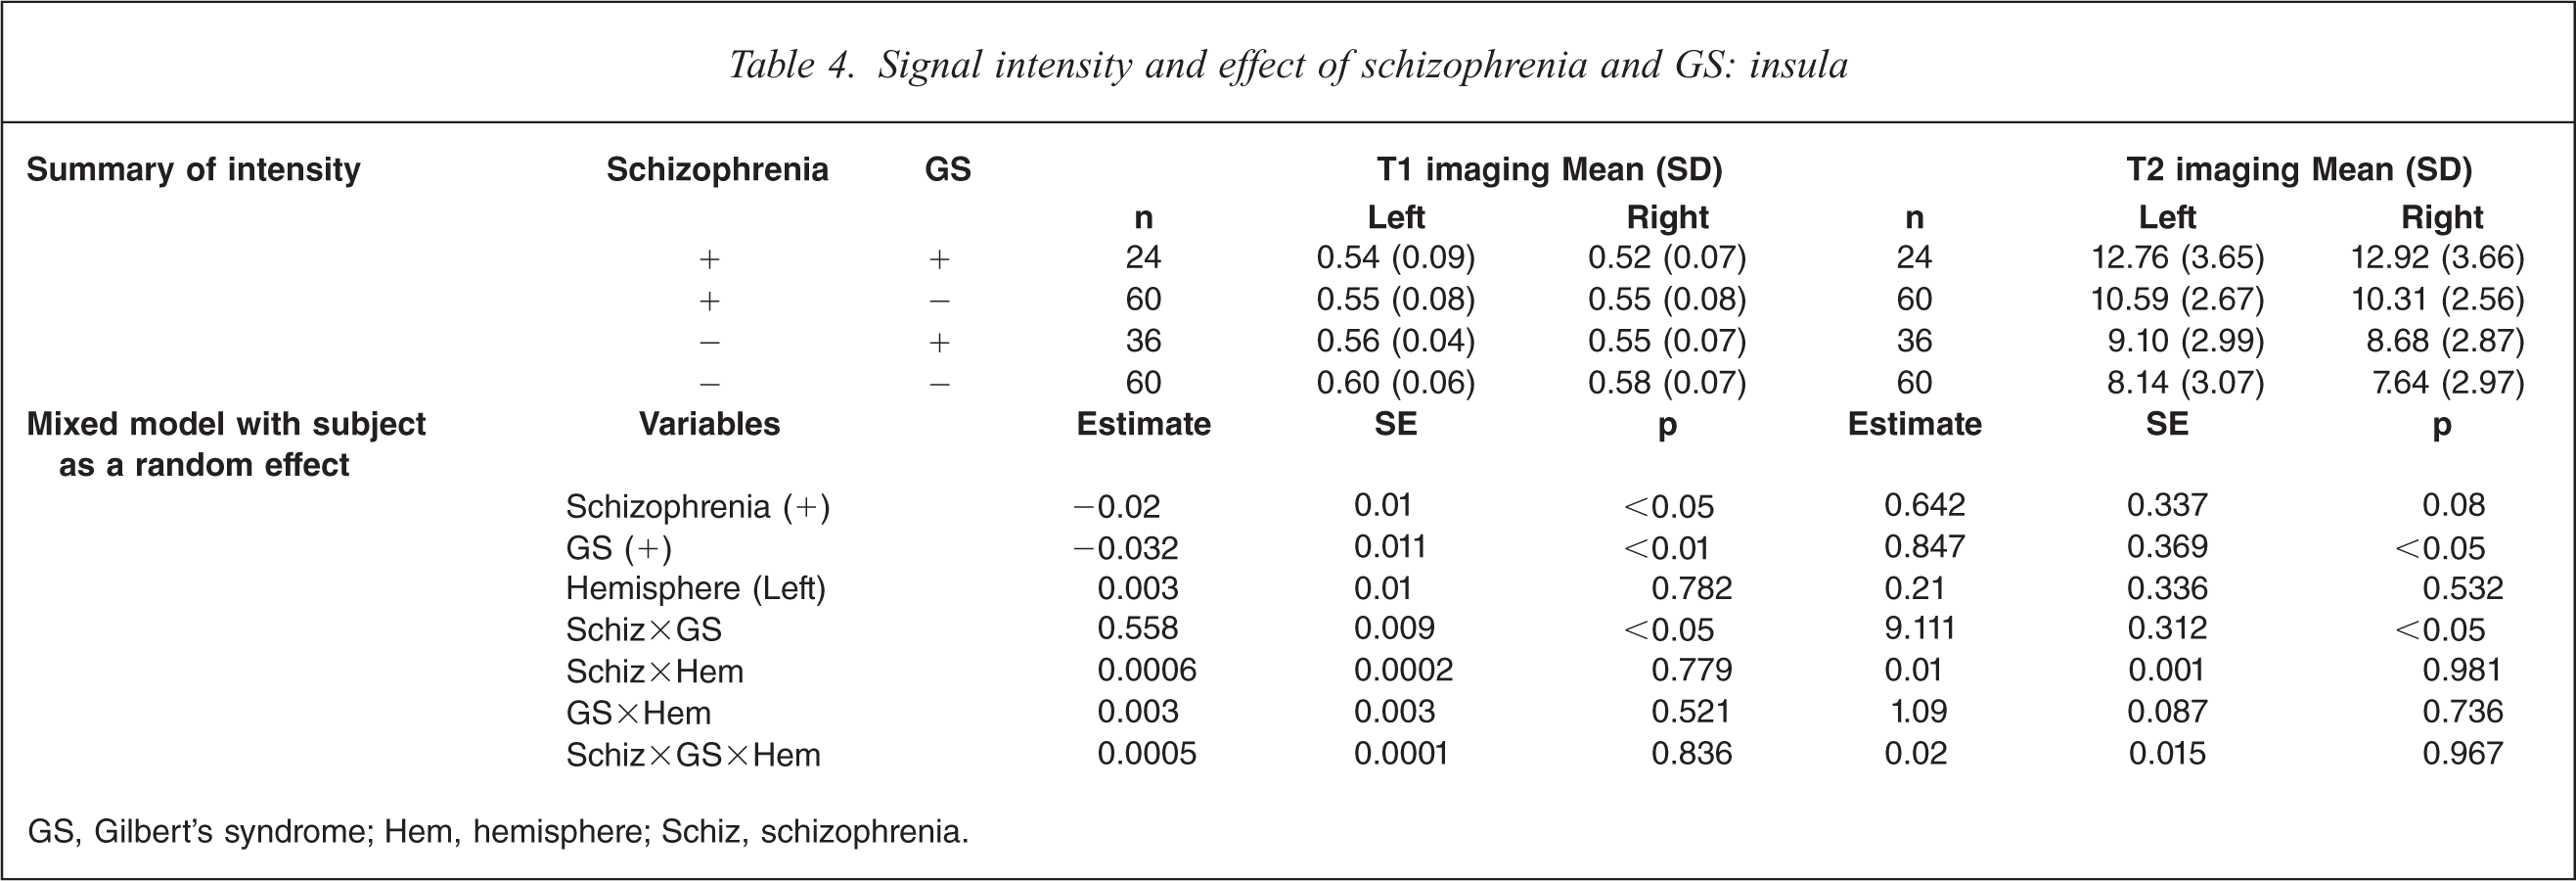
GS, Gilbert's syndrome; Hem, hemisphere; Schiz, schizophrenia.
Caudate
On T1-weighted MRI, schizophrenia patients with GS had significant decrease of intensity on both sides compared to control subjects without GS, and control subjects with GS on the left side (F(7359) = 6.46, p<0.05; Table 5). On T2-weighted MRI, schizophrenia patients with GS had significant increases on both sides compared to control subjects without GS, control subjects with GS, and schizophrenia patients without GS on both sides (F(7,359) = 9.88, p<0.0001). MRI analysis indicated a significant interaction of GS diagnosis and schizophrenia diagnosis, and no difference in hemisphere.
Signal intensity and the effect of schizophrenia and GS: caudate
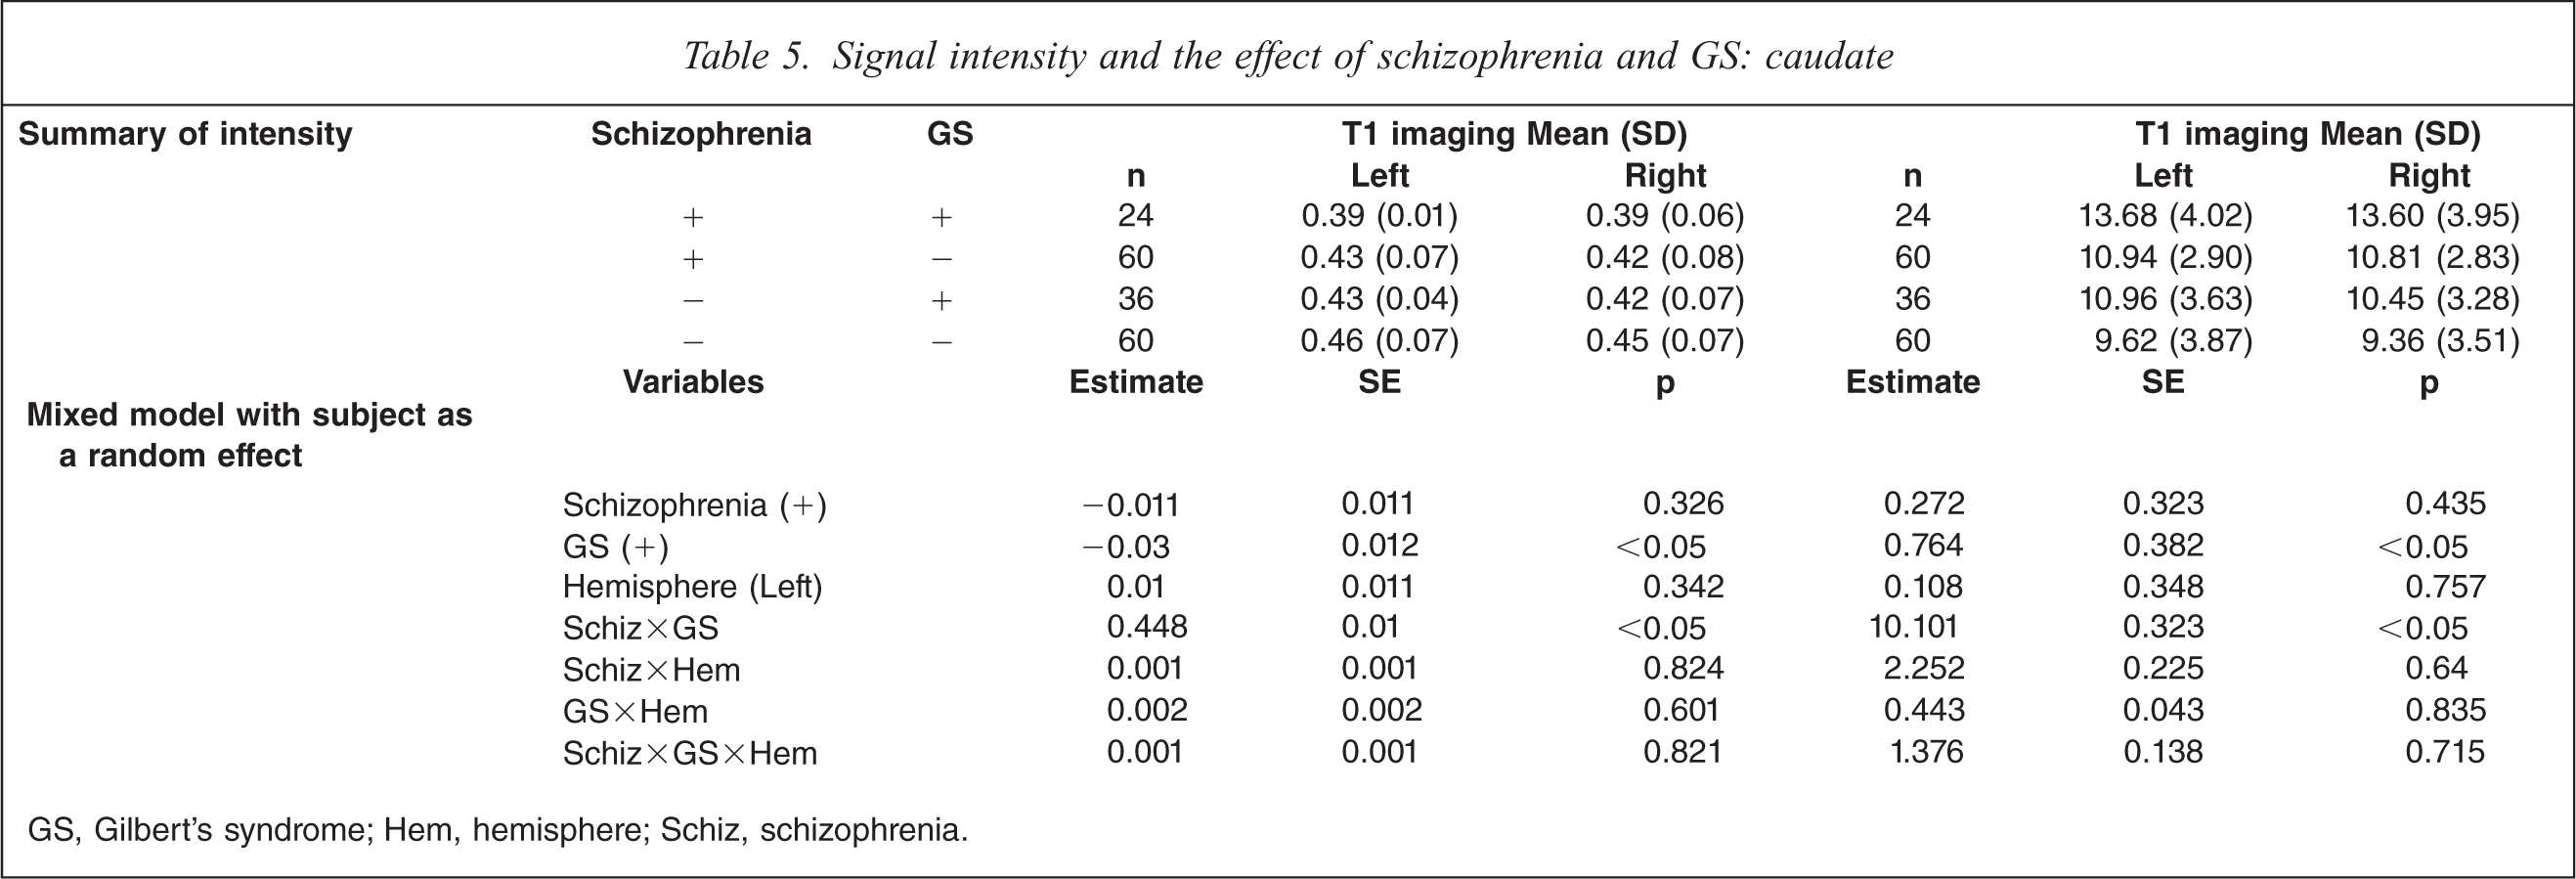
GS, Gilbert's syndrome; Hem, hemisphere; Schiz, schizophrenia.
Putamen
On T1-weighted MRI, schizophrenia patients with GS had significant decrease of intensity compared to control subjects without GS, control subjects with GS on both sides, and schizophrenia patients without GS on the right side (F(7,359) = 7.28, p<0.05; Table 6). On T2-weighted MRI, schizophrenia patients with GS had significant increases on both sides compared to control subjects without GS, control subjects with GS, and schizophrenia patients without GS (F(7,359) = 13.03, p<0.0001). MRI analysis indicated a significant interaction of GS diagnosis and schizophrenia diagnosis, and no difference in hemisphere.
Signal intensity and the effect of schizophrenia and GS: putamen
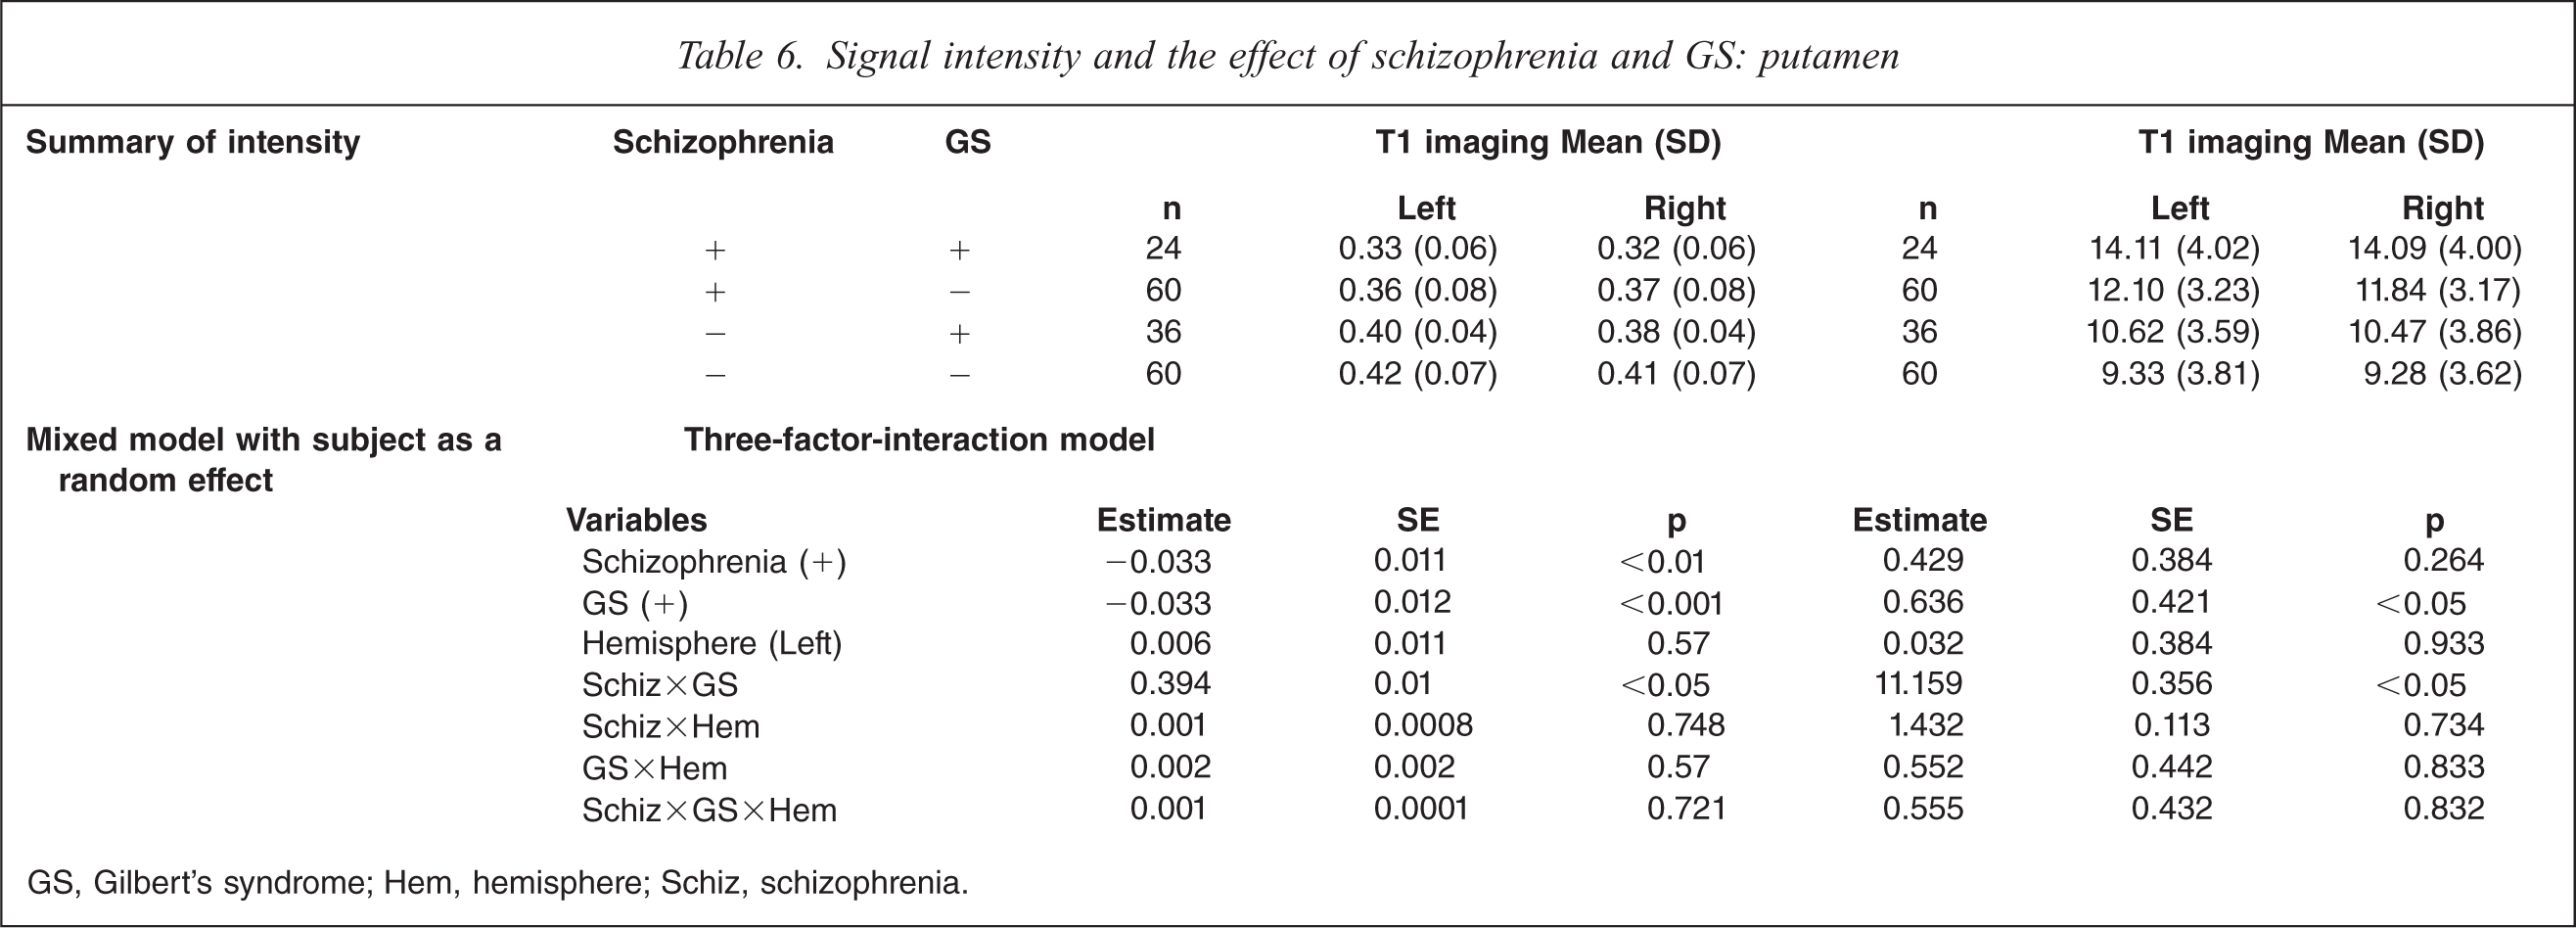
GS, Gilbert's syndrome; Hem, hemisphere; Schiz, schizophrenia.
Globus pallidus
On T1-weighted MRI, schizophrenia patients with GS had significant decrease of intensity compared to control subjects without GS, control subjects with GS on both sides, and schizophrenia without GS on the right side (F(7,359) = 8.33, p<0.001; Table 7). On T2-weighted MRI, schizophrenia patients with GS had significant increases on both sides compared to control subjects without GS and control subjects with GS (F(7,359) = 13.59, p<0.0001). MRI analysis indicated a significant interaction of GS diagnosis and schizophrenia diagnosis, and no difference in hemisphere.
Signal intensity and the effect of schizophrenia and GS: globus pallidus
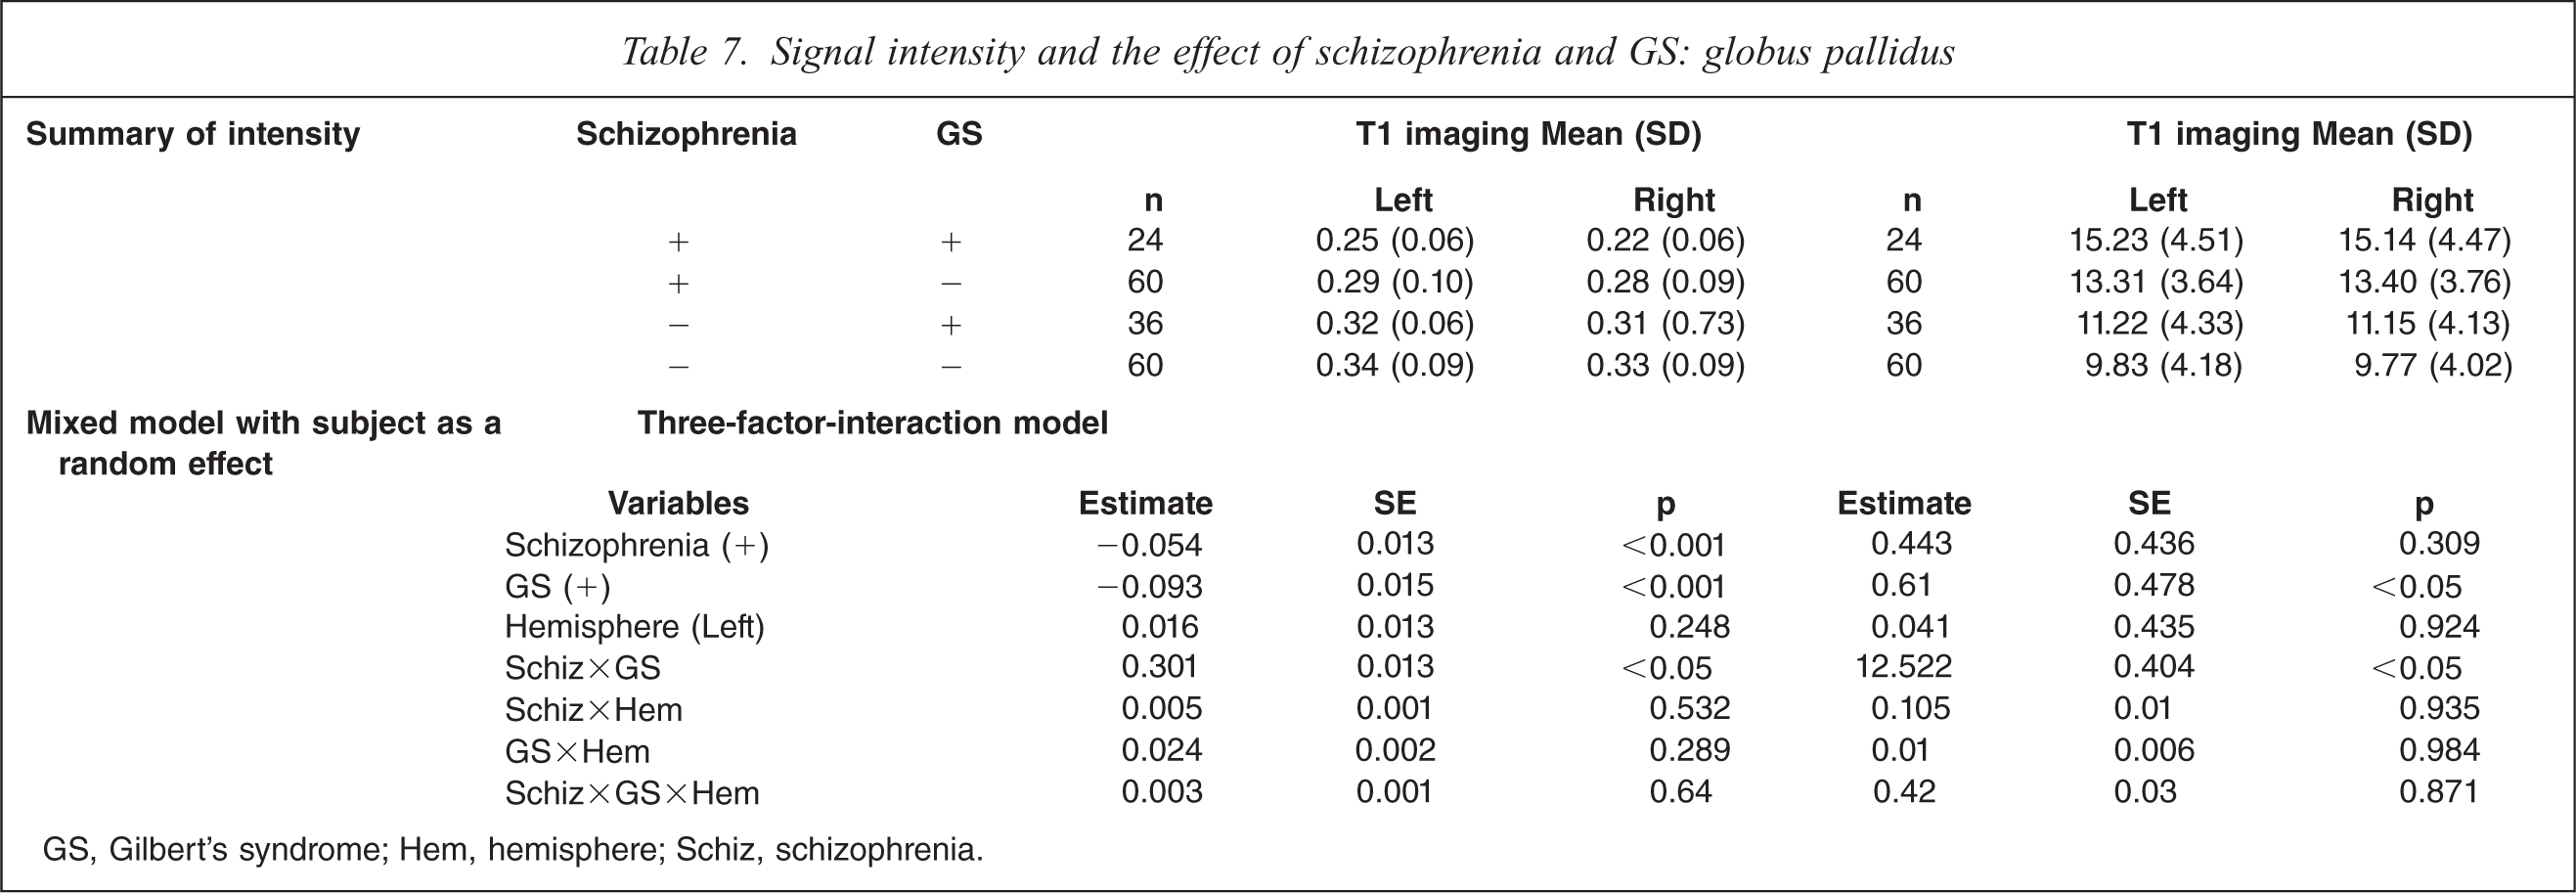
GS, Gilbert's syndrome; Hem, hemisphere; Schiz, schizophrenia.
Thalamus
On T1-weighted MRI, schizophrenia patients with GS had significant decrease of intensity compared to control subjects without GS on both sides, and control subjects with GS on the left side (F(7,359) =4.82, p<0.01; Table 8). On T2-weighted MRI, schizophrenia patients with GS had significant increases compared to control subjects without GS on both sides, control subjects with GS on the left side, and schizophrenia patients without GS on the left side (F(7,359) = 9.73, p<0.0001). MRI analysis indicated a significant interaction of GS diagnosis and schizophrenia diagnosis, and no difference in hemisphere.
Signal intensity and the effect of schizophrenia and GS: thalamus
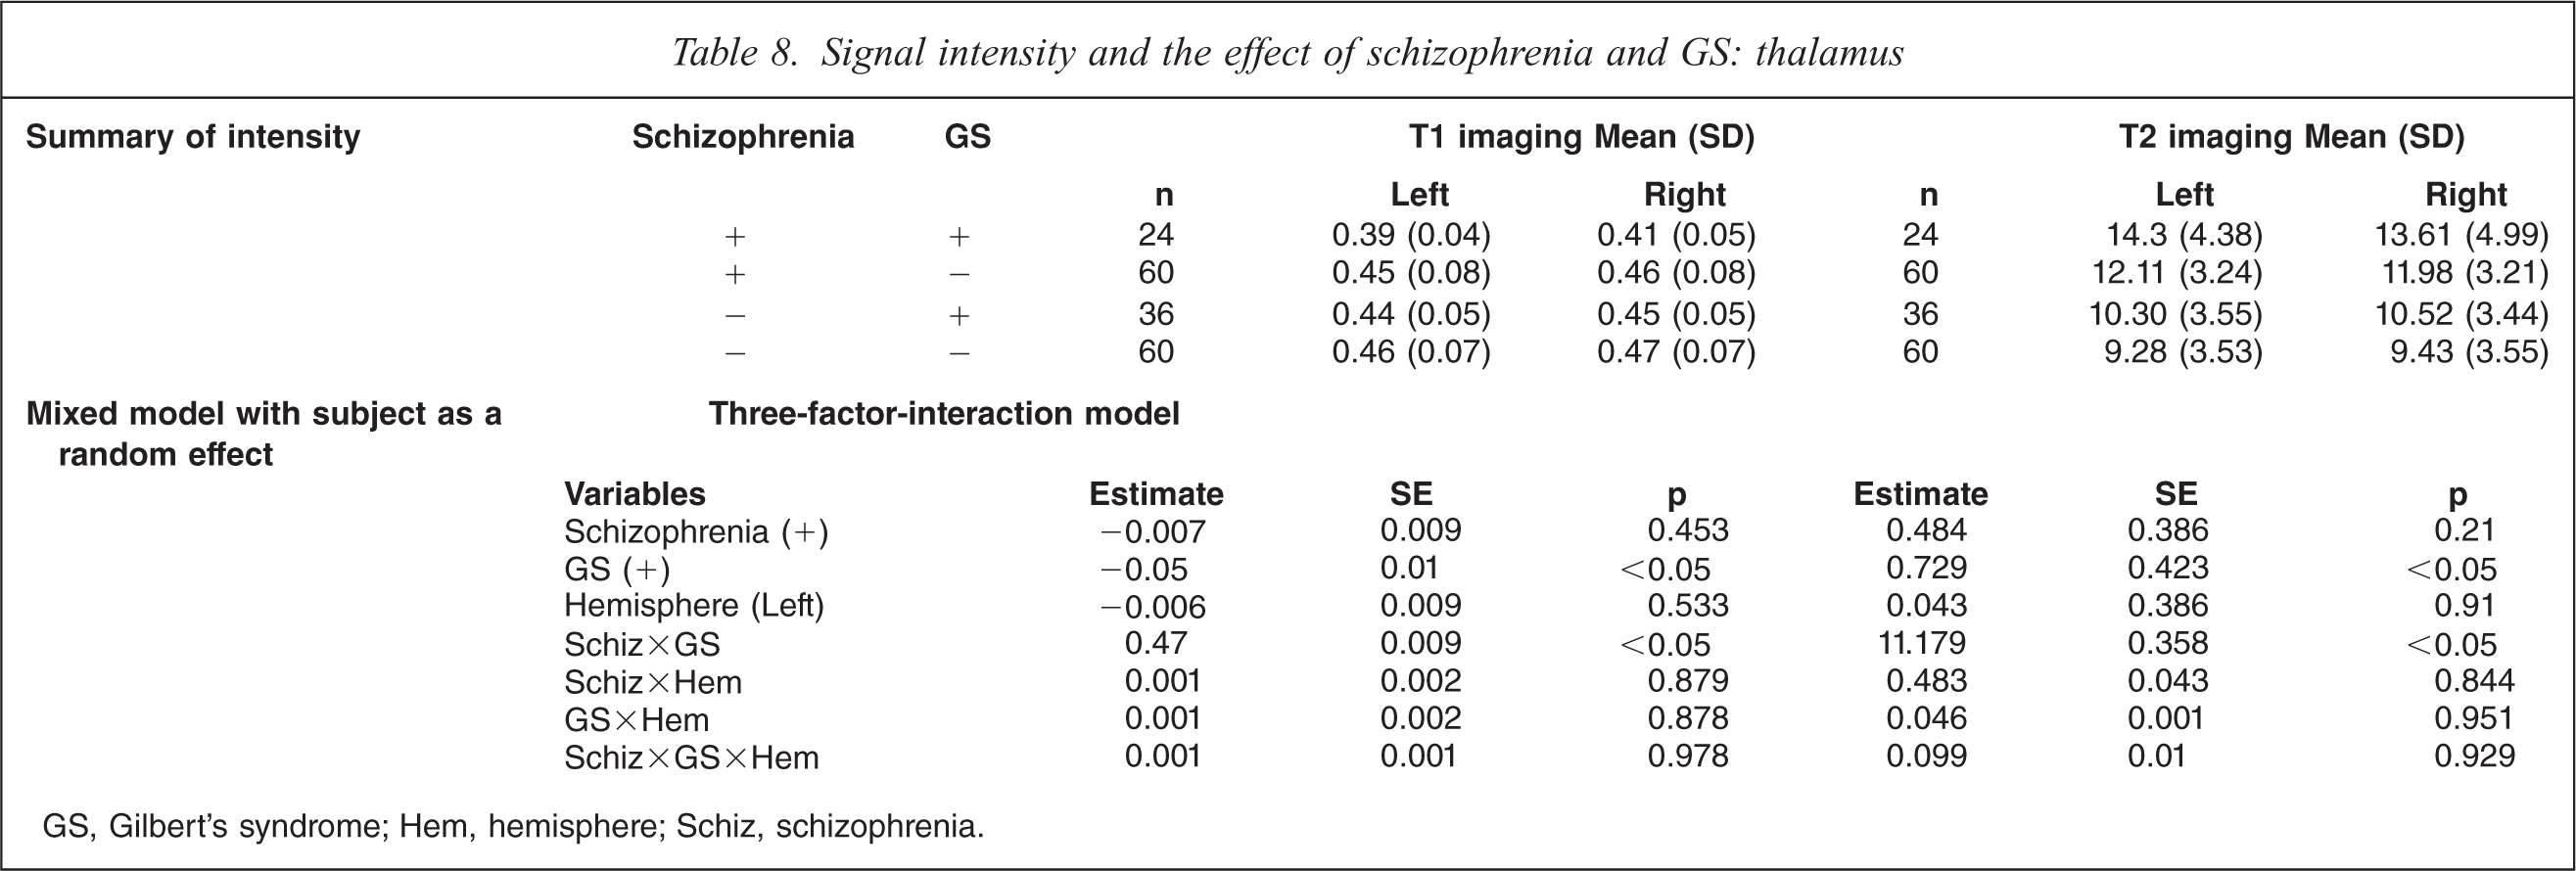
GS, Gilbert's syndrome; Hem, hemisphere; Schiz, schizophrenia.
Anterior cingulate gyrus
On T1-weighted MRI, schizophrenia patients with GS had significant decrease of intensity on both sides compared to control subjects without GS, control subjects with GS, and schizophrenia patients without GS (F(7,359) = 10.77, p<0.0001; Table 9). On T2-weighted MRI, schizophrenia patients with GS had significant increases on both sides compared to control subjects without GS, control subjects with GS, and schizophrenia patients without GS (F(7359) = 10.68, p<0.0001). MRI analysis indicated a significant interaction of GS diagnosis and schizophrenia diagnosis, and no difference in hemisphere.
Signal intensity and the effect of schizophrenia and GS: Anterior cingulate gyrus
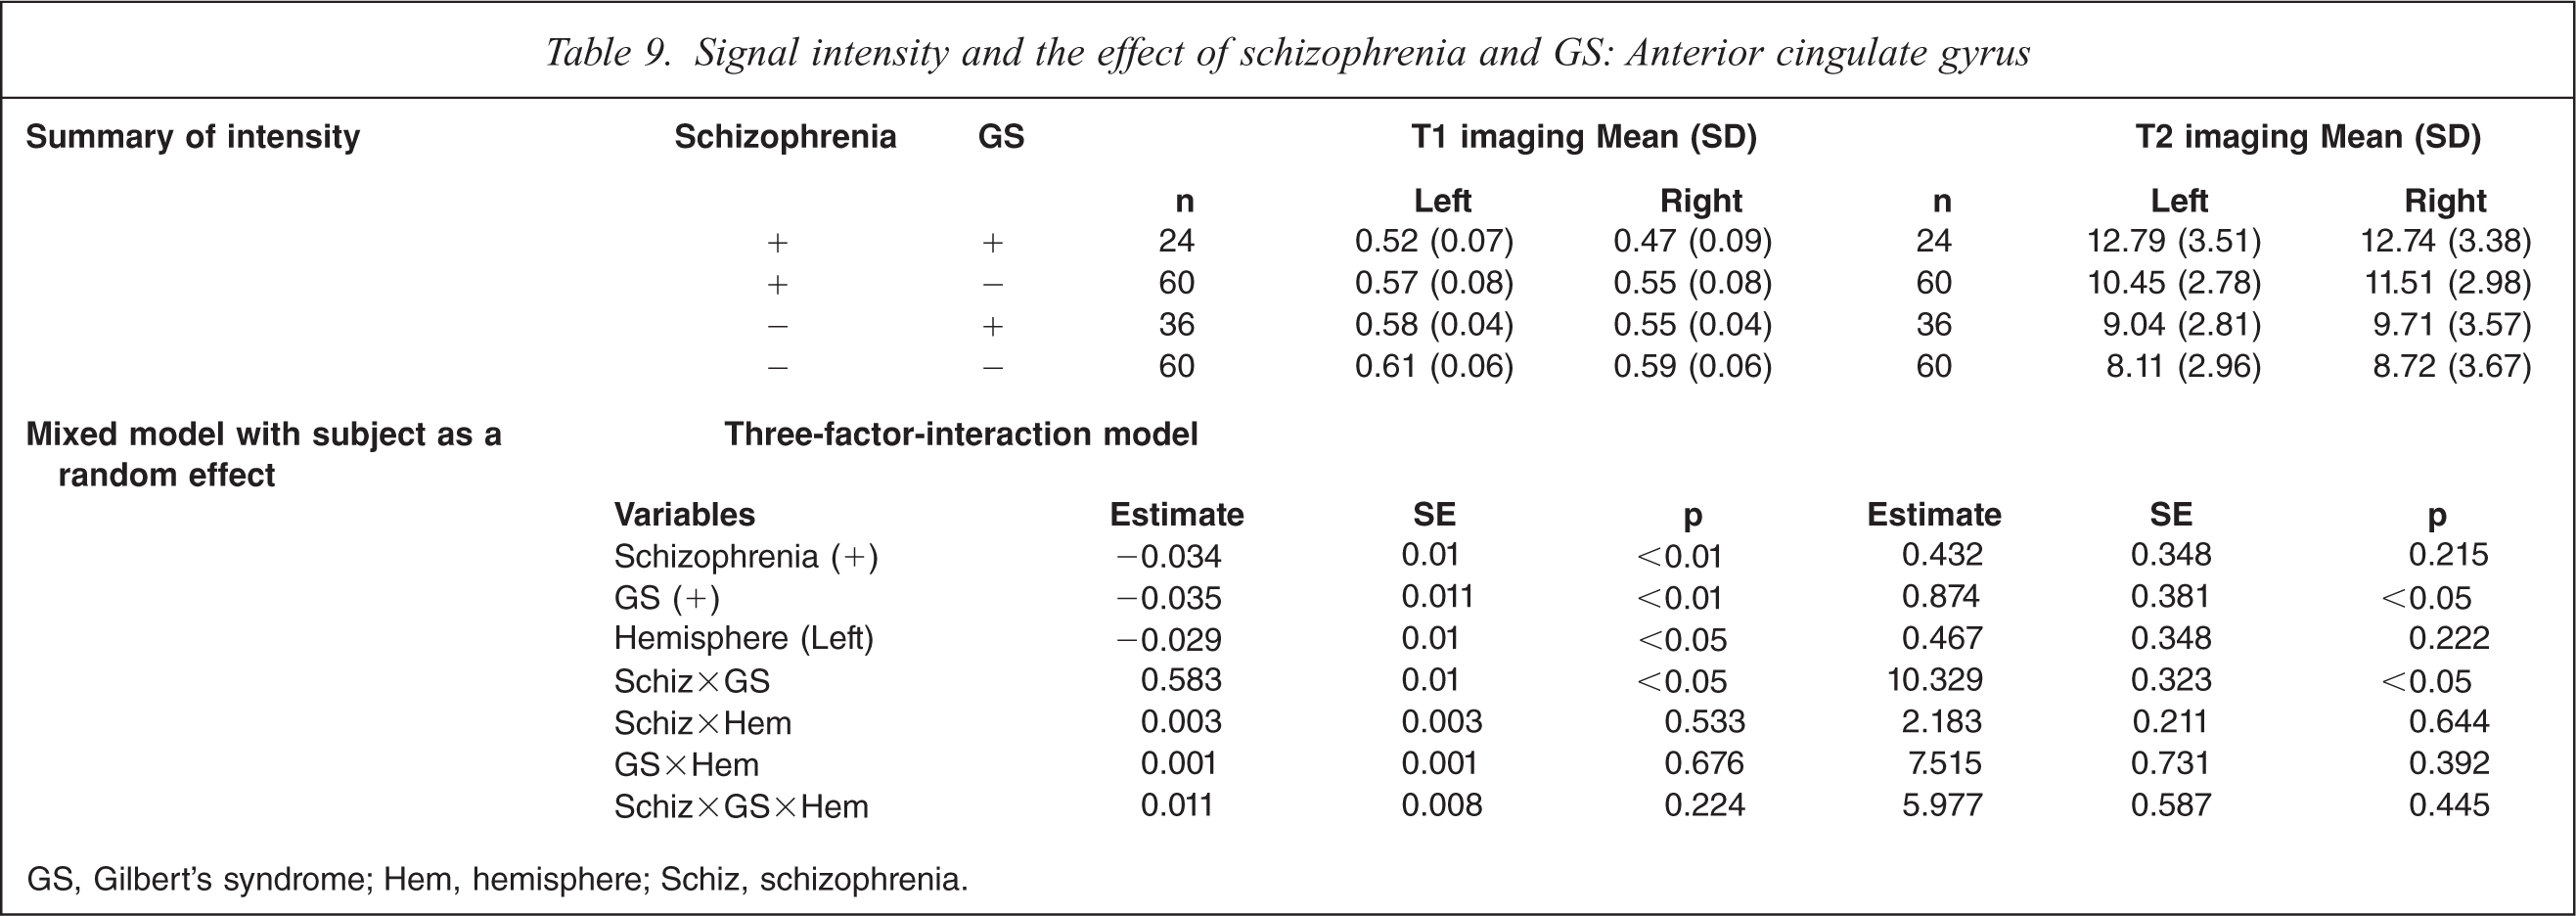
GS, Gilbert's syndrome; Hem, hemisphere; Schiz, schizophrenia.
Posterior cingulate gyrus
On T1-weighted MRI, schizophrenia patients with GS had significant decrease of intensity on both sides compared to control subjects without GS, control subjects with GS, and schizophrenia patients without GS (F(7,359) = 12.32, p<0.0001; Table 10). On T2-weighted MRI, schizophrenia patients with GS had significant increases compared to control subjects without GS, control subjects with GS on both sides, and schizophrenia patients without GS on the left side (F(7,359) = 12.68, p<0.0001). MRI analysis indicated a significant interaction of GS diagnosis and schizophrenia diagnosis, and no difference in hemisphere.
Signal intensity and the effect of schizophrenia and GS: posterior cingulate gyrus
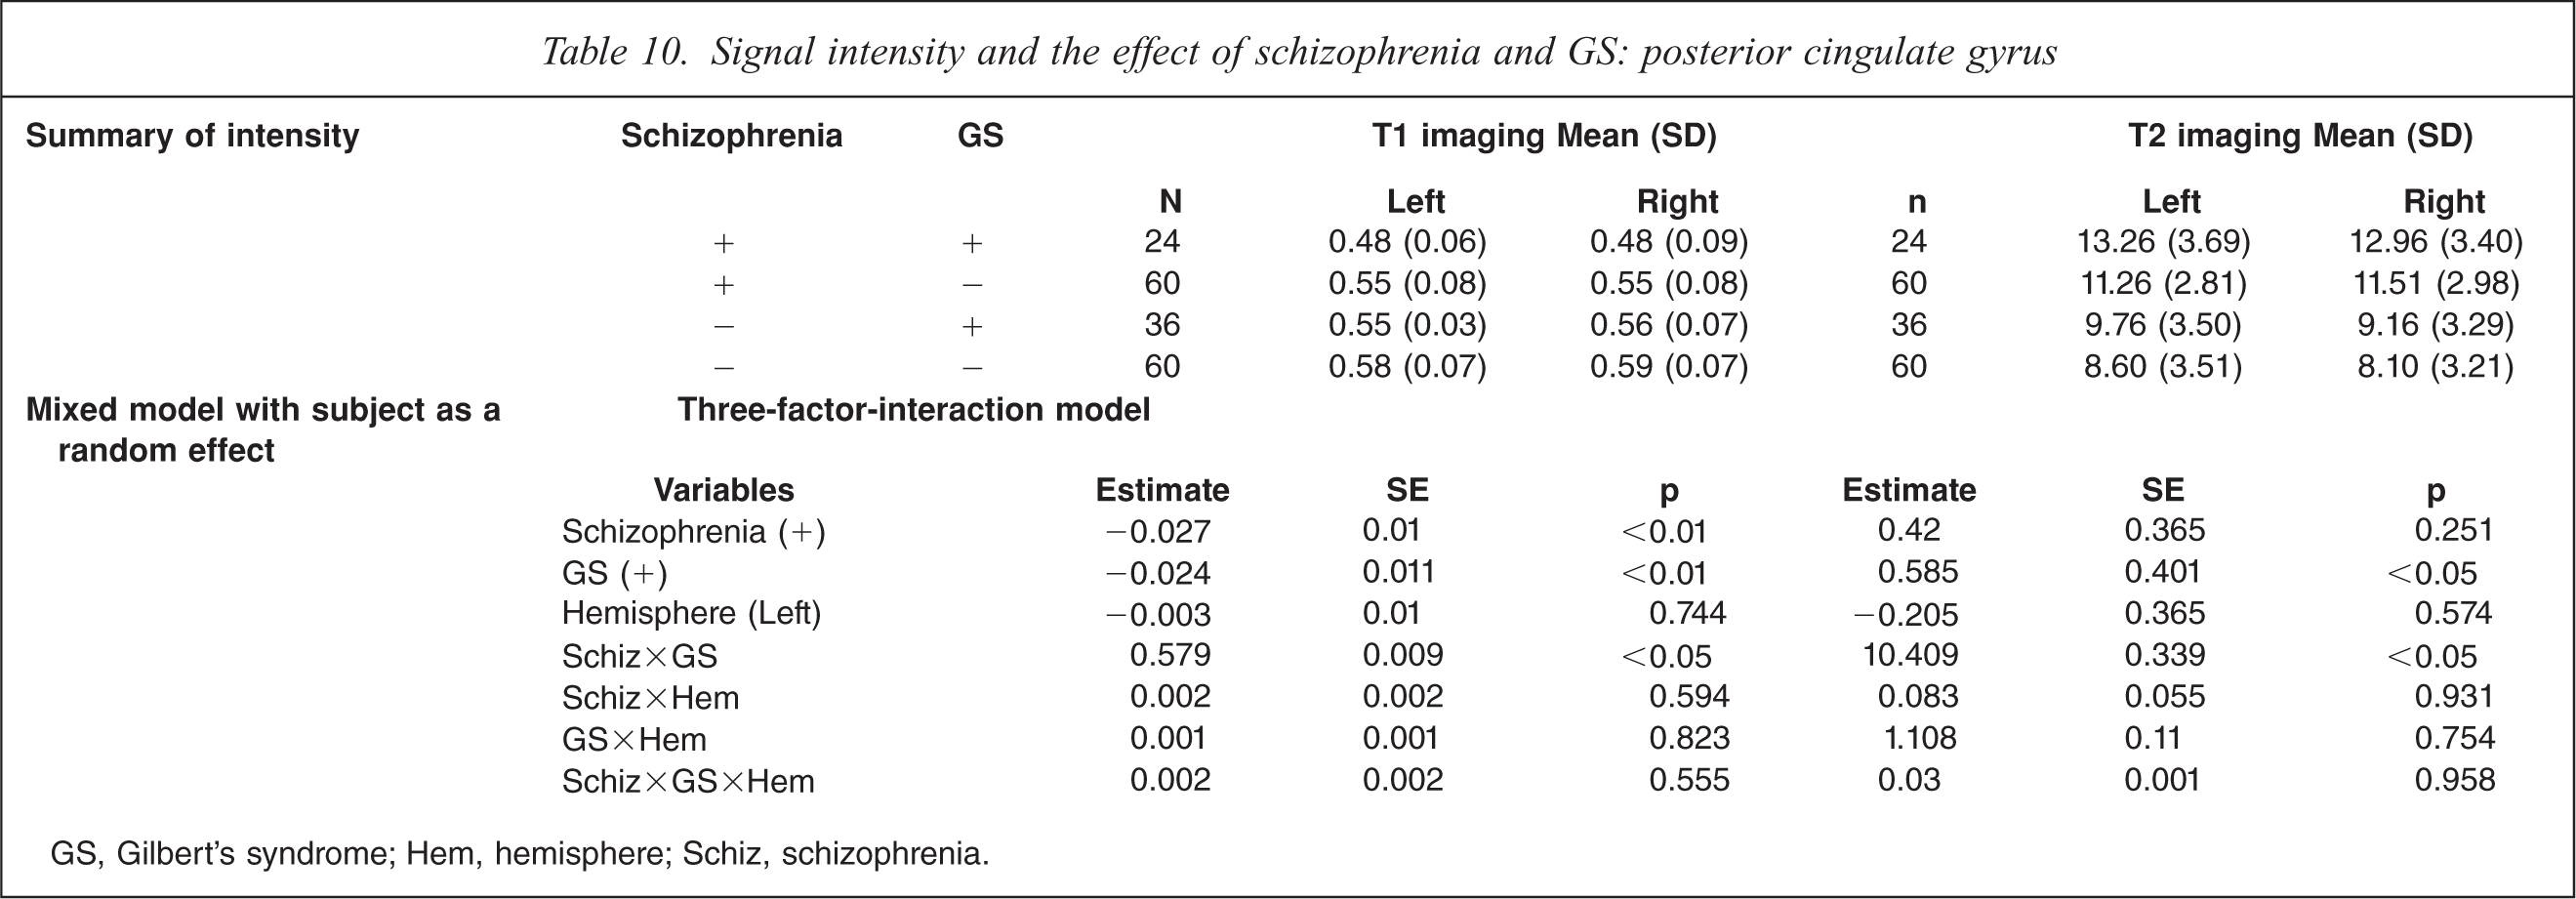
GS, Gilbert's syndrome; Hem, hemisphere; Schiz, schizophrenia.
Cerebellum
Cerebellar hemisphere
On T1-weighted MRI, schizophrenia patients with GS had significant decrease of intensity compared to control subjects without GS on both sides and control subjects with GS on the left side (F(7,359)=4.82, p<0.01; Table 11). On T2-weighted MRI, schizophrenia patients with GS had significant increases on both sides compared to control subjects without GS, control subjects with GS, and schizophrenia patients without GS (F(7359) = 13.07, p<0.0001). MRI analysis indicated a significant interaction of GS diagnosis and schizophrenia diagnosis, and no difference in hemisphere.
Signal intensity and the effect of schizophrenia and GS: putamen
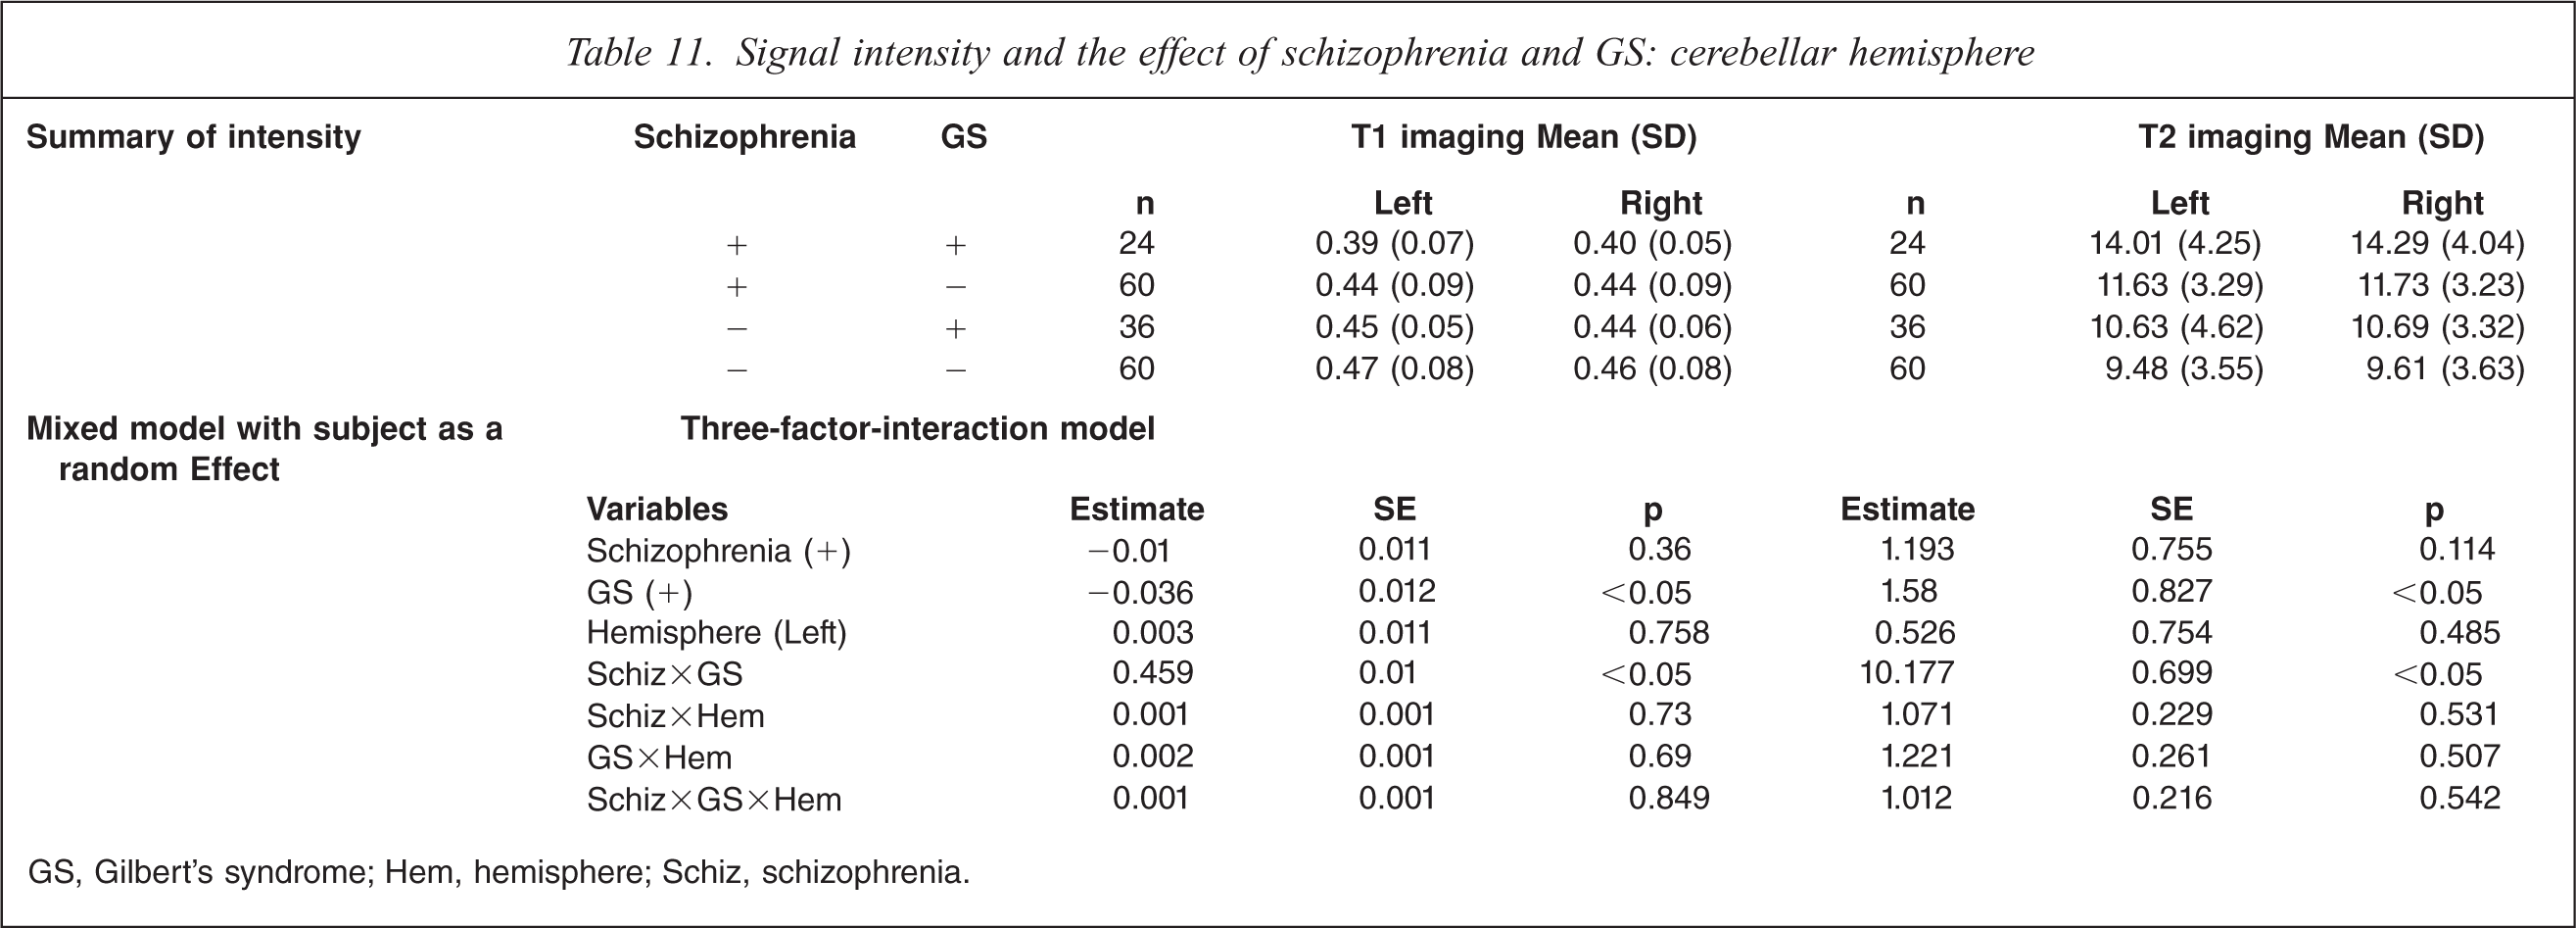
GS, Gilbert's syndrome; Hem, hemisphere; Schiz, schizophrenia.
Vermis of cerebellum
On T1-weighted MRI, schizophrenia patients with GS had significant decrease of intensity compared to control subjects without GS in the vermis of the cerebellum (F(3,179) = 2.45, p<0.05; Table 12). On T2-weighted MRI, schizophrenia patients with GS had significant increases compared to control subjects without GS and schizophrenia patients without GS in the vermis of the cerebellum (F(3,179) = 12.98, p<0.0001). MRI analysis indicated a significant interaction of GS diagnosis and schizophrenia diagnosis.
Signal intensity and the effect of schizophrenia and GS: vermis of cerebellum
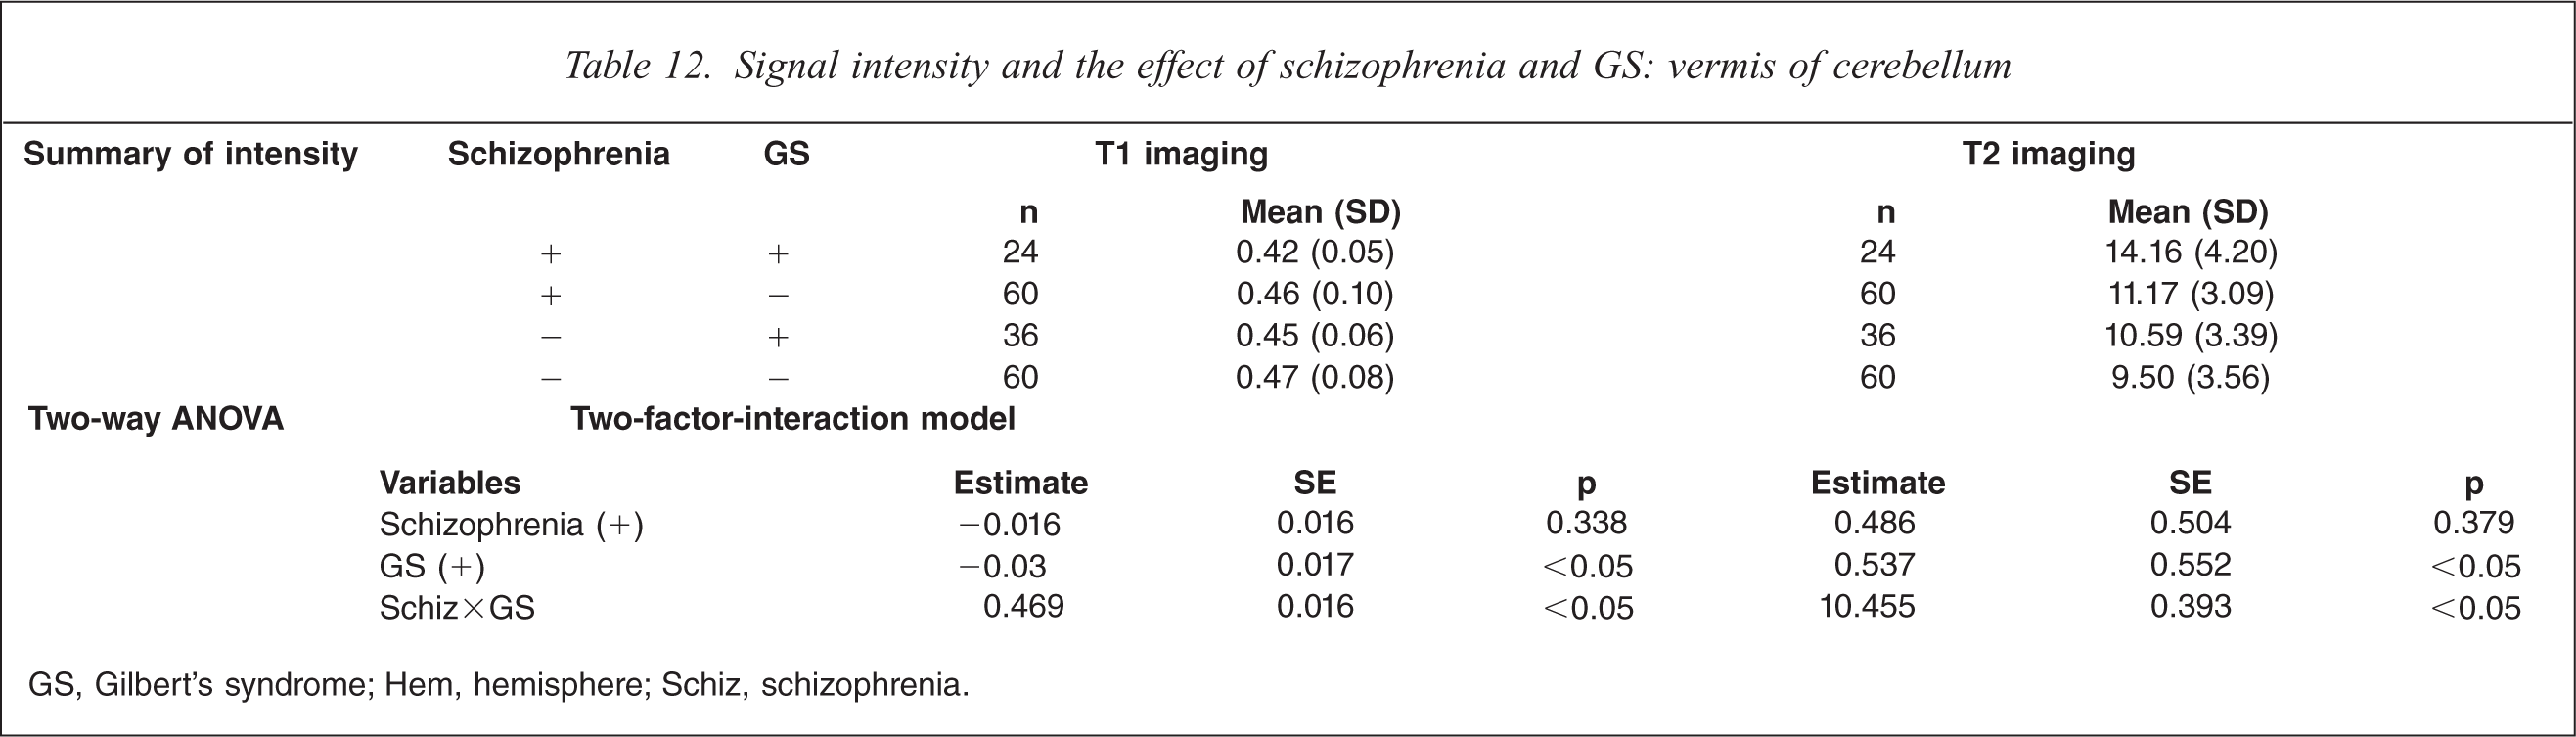
GS, Gilbert's syndrome; Hem, hemisphere; Schiz, schizophrenia.
Discussion
The investigation of structural abnormalities in schizophrenia has great potential for determining the underlying pathophysiology of schizophrenia. In T2-weighted MRI studies, Smith et al. reported higher image intensity in both the white and gray matter in selected brain areas in schizophrenia patients than in controls [21], and Rossi et al. reported lower image intensity in the temporal and frontal regions in schizophrenia patients than in controls on T1-weighted MRI [22]. T1-weighted MRI of first-episode schizophrenia patients showed reductions in signal intensity in all callosal subregions, the genu, body, isthmus, and splenium [20]. The abnormalities may reflect distributed interhemispheric disconnectivity that extends beyond the heteromodal association cortices [23]. The lack of specificity of signal intensities not withstanding, this measurement provides a useful reflection of the water concentration in tissue, something that may be an important secondary indicator of tissue pathology. The observation of signal intensity abnormalities across the subregions of brain structures suggests that schizophrenia may be characterized by widespread disconnectivity between cortical regions, rather than focal morphometric abnormalities in specific structures [24].
The major finding in the present study is that in schizophrenia patients with GS, compared to both schizophrenia without GS and controls with or without GS, there was significantly decreased signal intensity on T1-weighted imaging and increased signal intensity on T2-weighted imaging in almost all regions of the brain. Moreover, the findings in all regions clarified the interaction of schizophrenia and GS diagnosis. These abnormalities show that the various problems of acknowledgment, emotion, and integration of senses may be unusual in schizophrenia patients with GS. Previously, we used FLAIR MRI to compare different brain regions in schizophrenia patients with or without GS to controls without GS. We therefore focused the discussion on the comparisons between the schizophrenia patients with or without GS, as well as on the role of diffuse brain changes in the pathophysiology of characteristic symptoms in schizophrenia with GS.
Schizophrenia patients with GS had diffuse enlargement in almost all CSF spaces [10]. Subtle frontotemporal and ventricular enlargements have been reported on CT and MRI in schizophrenia patients [5, 16, 25, 26]. These studies agree with the present findings in schizophrenia patients. In the present study, schizophrenia with GS was characterized as changed signal intensity in all regions by the interaction of schizophrenia and GS (Tables [2–12]), and may therefore be considered to represent the more severe schizophrenia subtype in both acute clinical symptomatology and underlying brain pathology. We previously reported that schizophrenia patients with GS had higher scores on the positive and general subscales of PANSS than patients without GS, although there were no differences in scores on the negative subscales [9]. Thus, schizophrenia patients with GS tended to show more acute psychiatric symptoms of an almost catatonic type. Cortical sulcal enlargement was shown in catatonic schizophrenia patients on planimetric CT [27]. Because of the heterogeneity of schizophrenia, there may be an acute and severe subtype of catatonic schizophrenia with GS. Moreover, we reported that there were significant clinical character differences between schizophrenia patients with GS and without GS, and with regard to heterogeneity of schizophrenia, there might be a poorer outcome for the subtype of schizophrenia with GS [11]. It is also possible that a higher concentration of bilirubin in serum affects psychiatric symptoms. Abnormalities of brain structure in schizophrenia may be exacerbated by hyperbilirubinemia. There may be a specific relationship between catatonia and bilirubinemia. Therefore the present findings might not be a reflection only of differences in subtype composition; the diffuse, changing intensities in almost all regions may be closely related to the pathophysiology of schizophrenia with GS. It is not clear, however, if the present findings are influenced by factors such as subtype of schizophrenia, laterality, symptomatology, medications, age, or gender. Moreover the exact relationship between characteristic symptoms of schizophrenia with hyperbilirubinemia and diffuse increasing signal intensities in almost all regions remains unclear.
With regard to limitations of the present study, the slices were very thick and so partial volume is a serious problem. This is particularly so in ROIs that can be contaminated by CSF, because this will have a very different signal from the grey/white matter. And because sulcal enlargement has been shown in schizophrenia with GS, the change of intensities in ROIs was thought to tend to show neural structure changes.
In future, the relationship between measured intensity and clinical variables should be considered specifically with regard to schizophrenia with GS. The present findings should stimulate further prospective studies such as those using diffusion tensor imaging on hyperbilirubinemia in schizophrenia patients, to evaluate differences in neuronal connectivity.
Hyperbilirubinemia has been considered to be a risk factor for brain injury. At autopsy it appears as a yellow stain, known as kernicterus. It has been reported that the Gunn rat, which is a model for hyperbilirubinemia, had brain hypoplasia [28, 29]. McDonald et al reported on the role of glutamate receptor-mediated excitotoxicity in bilirubin-induced brain injury in the Gunn rat [30]. These reports suggest that bilirubin affects brain development or is neurotoxic and may play an important role in brain tissue changes, as seen in changes of signal intensities in schizophrenia patients with GS.
The present findings should stimulate further prospective and laboratory studies on hyperbilirubinemia in schizophrenia patients in order to evaluate this longstanding phenomenon.
Footnotes
Acknowledgement
Part of this work was supported by Grants-in-Aid for Scientific Research on Priority Areas No. 13770544, 15790622, and 20591366 from the Ministry of Education, Science, Sports and Culture of Japan.