
Abstract
This article explores innovations for parameter estimation in generalized linear and nonlinear models, which may be used in item response modeling to account for guessing/pretending or slipping/dissimulation and for the effect of covariates. We introduce a new implementation of the EM algorithm and propose a new algorithm based on the parametrized link function. The two novel iterative algorithms are compared to existing methods in a simulation study. Additionally, the study examines software implementation, including the specification of initial values for numerical algorithms and asymptotic properties with an estimation of standard errors. Overall, the newly proposed algorithm based on the parametrized link function outperforms other procedures, especially for small sample sizes. Moreover, the newly implemented EM algorithm provides additional information regarding respondents’ inclination to guess or pretend and slip or dissimulate when answering the item. The study also discusses applications of the methods in the context of the detection of differential item functioning and addresses the measurement error. Methods are offered in the
Keywords
1. Introduction
In fields such as education, psychology, and health, constructs are commonly measured through multi-item instruments, where understanding how each individual item functions is crucial. Analyzing item functioning not only aids in refining measurement instruments but also provides valuable insights into the behavior and characteristics of different respondent groups. The three-parameter logistic (3PL) and four-parameter logistic (4PL) models are flexible tools that allow capturing of complex item response patterns and accommodating a more comprehensive range of item characteristics, including possible guessing and slipping rates in the context of educational measurement and pretending and dissimulation in the context of psychological and health measurement. However, estimation in these models, both in the item response theory (IRT) (Barton & Lord, 1981; Birnbaum, 1968) and non-IRT framework (Drabinová & Martinková, 2017; Hladká & Martinková, 2020), may become challenging due to several factors, including the complexity of these models caused by their nonlinearity, high-dimensionality of the parameter space, and the nature of the data being analyzed. These models typically require a large sample size (Kim & Oshima, 2013), which can result in computationally demanding fitting. Therefore, efficient algorithms, advanced estimation techniques, and software implementation are crucial for the effectiveness and accessibility of these models’ use in practice.
Recent research renewed interest in the 3–4PL IRT models since the availability of computing resources is on the rise. New approaches in estimation are being studied extensively (Battauz, 2020; Culpepper, 2016; Fu et al., 2021; Loken & Rulison, 2010; Meng et al., 2020), which helps solve some of the computational issues. However, their focus is mainly limited to large-scale assessments, while estimating item parameters with moderate sample sizes is still unreachable. To address the computational issues more effectively and accurately recover item characteristics such as guessing and slipping, the IRT models may benefit from traditional item analysis and generalized linear and nonlinear models (GLNMs), their simpler score-based counterparts (Martinková & Hladká, 2023). The GLNMs can offer improved and more precise starting values for related IRT models and allow for statistical inference regarding item parameters while still being less computationally complex compared to IRT models.
GLNMs incorporate a class of generalized logistic regression models that are natural extensions of the logistic regression model to describe item functioning. Analogous to 3–4PL IRT models, generalized logistic regression may account for the possibility that an item can be correctly answered or endorsed without the necessary knowledge or trait, for example, due to guessing or pretending. In this case, the logistic regression model is extended by including a parameter defining a lower asymptote of the probability curve, which may be larger than zero. Similarly, the model can consider the possibility that an item is incorrectly answered or opposed by a respondent with a high level of a particular trait due to issues such as inattention, lack of time, or dissimulation; this model includes an upper asymptote of the probability curve, which may be lower than one. These models can be seen as score-based counterparts to 3–4PL IRT models since they assume the same shape of the item response curve; however, in contrast to the class of latent variable models, this approach uses an observed estimate of the underlying latent trait.
Furthermore, logistic regression, its extensions, and their latent variable counterparts have become widely used for identifying between-group differences on item level when responding to multi-item measurements (Swaminathan & Rogers, 1990). The phenomenon, known as differential item functioning (DIF), indicates whether responses to an item vary for respondents with the same level of an underlying latent trait but from different groups (e.g. defined by gender, age, or socioeconomic status). In this vein, DIF detection is essential for a deeper understanding of group differences, assessing the effectiveness of various treatments, or uncovering potential unfairness in educational tests. It is identified as one of the crucial topics in measurement (AERA, APA, & NCME, 2014).
The estimation in the logistic regression model is a straightforward procedure, but extending the parametric space by including additional parameters in this model makes it more statistically and computationally challenging and demanding and may result in convergence issues. This is even more present in IRT modeling, where latent ability is estimated together with item parameters. In this vein, GLNMs can be seen as a helpful alternative in describing item functioning and identifying DIF, accounting for possible guessing or inattention while also being accessible in practice.
Therefore, this article examines innovations in the item parameter estimation for the GLNMs in the context of DIF detection. As the main contribution, the work proposes novel iterative algorithms, examines their theoretical properties, and compares the newly proposed methods to existing ones in a simulation study. The use of estimation procedures is then exemplified on real data examples with an application to DIF detection, with the secondary goal of providing possibilities for more accurate DIF detection. Given that GLNMs treat ability as observed, we also address potential biases this approach may bring due to measurement error.
The rest of the manuscript is organized as follows: To begin, Section 2 introduces the GLNMs and its relationship to IRT framework, examining the estimation techniques. This section provides a detailed description of two existing methods for parameter estimation, the nonlinear least squares (NLS) and the maximum likelihood (ML) method, and their application to fitting GLNMs. Furthermore, as an alternative to the direct implementation of the ML method, this study proposes a novel implementation of the expectation-maximization (EM) algorithm and a new approach based on a parametrized link function (PLF). Additionally, this section provides asymptotic properties of the estimates, an estimation of standard errors, and a software implementation, including a specification of starting values in iterative algorithms. Subsequently, Section 3 describes the design and results of the simulation study. To illustrate the differences and challenges between the existing and newly proposed methods in practice and the context of DIF detection, this work provides two real data analyses in Section 4. Section 5 contains the discussion and concluding remarks. Finally, Supplemental Appendix A provides asymptotic properties of the discussed estimation approaches, Supplemental Appendix B lists item parameter estimates of real data examples, and Supplemental Appendix C presents an additional study on measurement error. All Supplementary material is available at https://osf.io/eu5zm/
2. Methodology
2.1 Generalized Linear and Nonlinear Models for Item Functioning
GLNMs extend the logistic regression model by accounting for the possibility of guessing or inattention when answering an item. The simple 4PL model describes functioning of the item
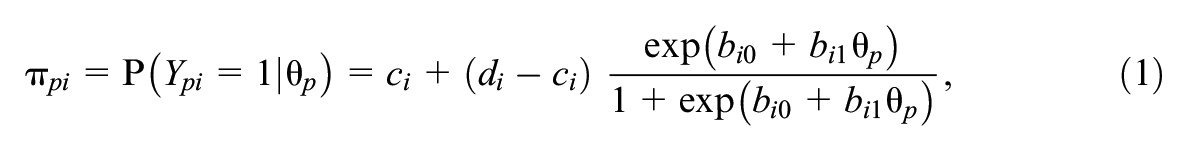
with
2.1.1 Parameter Interpretation
All four parameters have an intuitive interpretation: The parameters

where
In psychological and health-related assessments, the asymptotes
2.1.2 Adding Covariates, Group-Specific 4PL Model
The simple model (1) can be further extended by incorporating additional respondents’ characteristics. As a typical example, a binary grouping variable
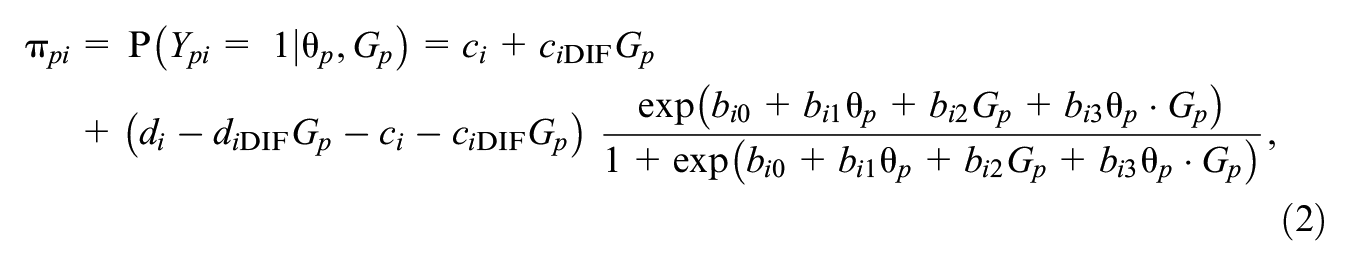
which is suitable for testing DIF; see also Hladká and Martinková (2020) and Martinková and Hladká (2023, Chapter 9).
However, the models (1) and (2) can be further generalized. Instead of using a single variable
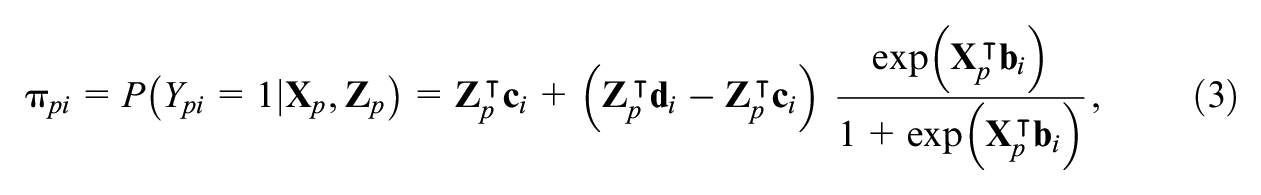
where
2.1.3 Testing for DIF
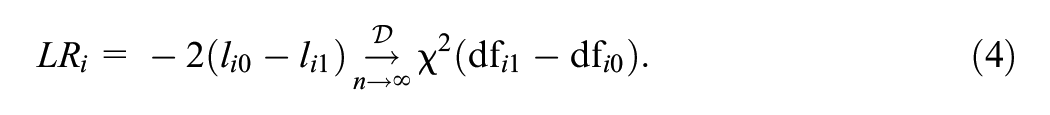
The group-specific 4PL model (2) can be then used for testing between-group differences on the item level with a DIF analysis (Hladká & Martinková, 2020) with, for example, the likelihood ratio test. The likelihood ratio test measures the difference between the log-likelihood
Similarly, any two nested submodels of the group-specific 4PL model (2) can be compared to test for the significance of group-related item parameters. Note that in GLNMs, DIF detection is usually performed item by item.
2.1.4 Matching Criterion
In these models,
2.1.5 IRT Framework
Within the IRT framework, the matching criterion
2.2 Estimation of Item Parameters
Numerous algorithms are available to estimate item parameters in the covariate-specific 4PL model (3). First, this section describes two methods that may be directly implemented in the existing software: The NLS method and the ML method. Next, the study introduces two newly proposed iterative algorithms, which might improve the implementation of the computationally demanding ML method: The EM algorithm inspired by the work of Dinse (2011) and an iterative algorithm based on PLF. The described and proposed algorithms treat ability as known or estimated a priori and estimate parameters for each item separately, which is suitable in the GLNM framework. We provide a discussion on incorporating joint ability and item parameter estimation in Section 5.
2.2.1 Nonlinear Least Squares
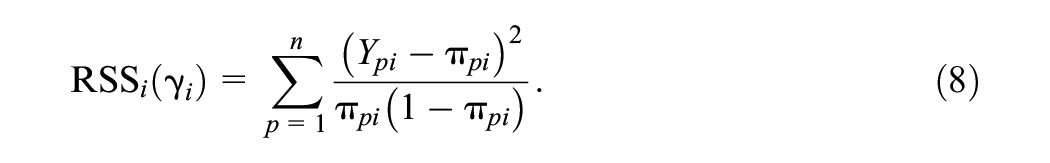
The parameter estimates of the covariate-specific 4PL model (3) can be determined using the NLS method (Dennis et al., 1981; Drabinová & Martinková, 2017; Hladká & Martinková, 2020), which is based on minimization of the residual sum of squares (RSS) of item
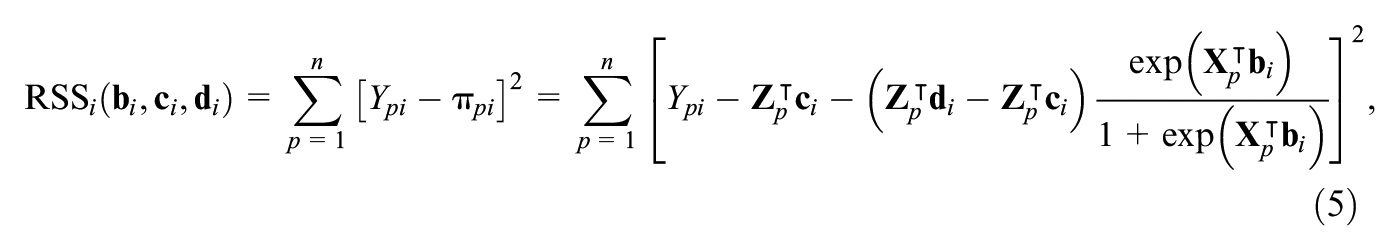
where
The asymptotic properties of the NLS estimator, such as consistency and asymptotic distribution, can be derived under the classical set of regularity conditions (e.g., van der Vaart, 1998, Theorems 5.41 and 5.42; see also Supplemental Appendix A.1 for more details). This study proposes a sandwich estimator defined by Equation (A1) in Supplemental Appendix A.1, as a natural estimate can be used as a natural estimate of the asymptotic variance of the NLS estimate.
2.2.2 Maximum Likelihood
The second option for estimating item parameters in the covariate-specific 4PL model (3) is the ML method (Hladká & Martinková, 2020). Using a notation
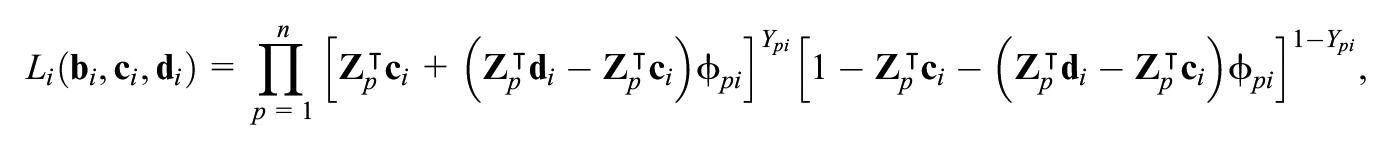
and the log-likelihood function is then given by,
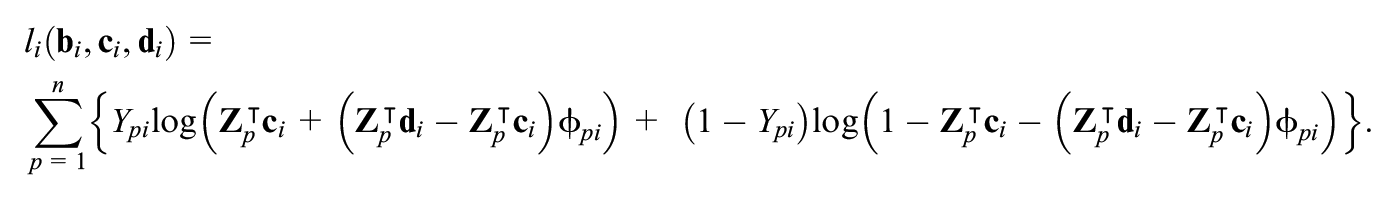
The parameter estimates are obtained by maximization of the log-likelihood function. Thus, this approach proceeds similarly to the logistic regression model, except for a larger dimension of the parametric space. To find the maximizer of the log-likelihood function
Using van der Vaart’s (1998) Theorems 5.41 and 5.42, consistency and asymptotic normality can be shown for the ML estimator; see Supplemental Appendix A.2 for more details. Additionally, the estimate of the asymptotic variance of the item parameters is an inverse of the observed information matrix defined by Equation (A2).
2.2.3 EM Algorithm
The ML method may be computationally demanding, and iterative algorithms might help in those situations. Inspired by the work of Dinse (2011), this study adopts a version of the EM algorithm (Dempster et al., 1977) for parameter estimation in the covariate-specific 4PL model (3).
To make use of the EM algorithm, the original 4PL model can be reformulated as a mixture model employing latent classes indicating different types of respondents. In our setting, we consider four mutually exclusive latent variables (
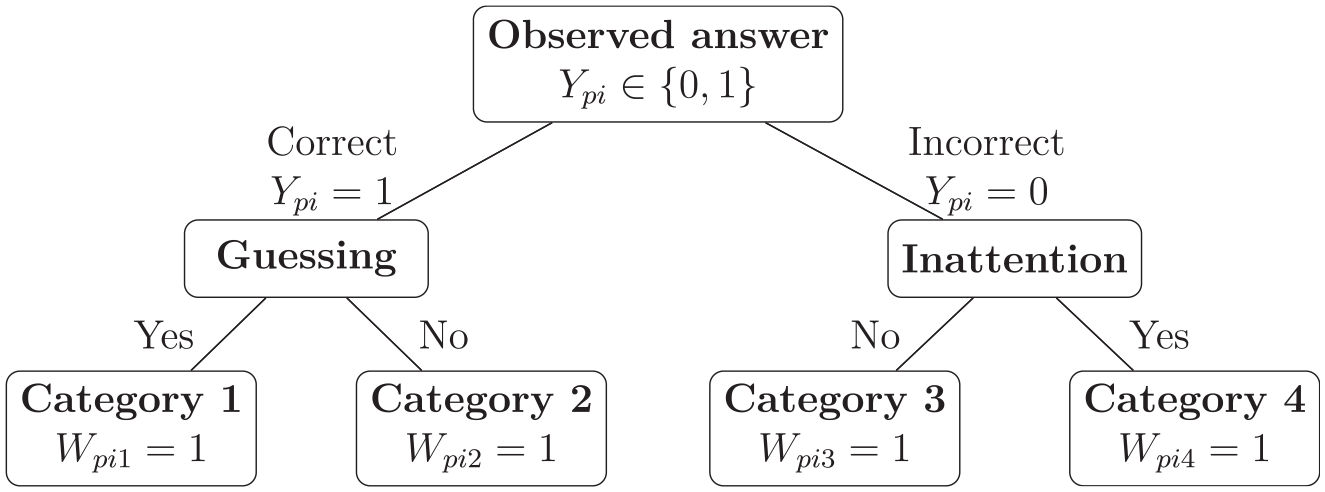
Graphical representation of the relationships among latent variables for the EM algorithm.
Let
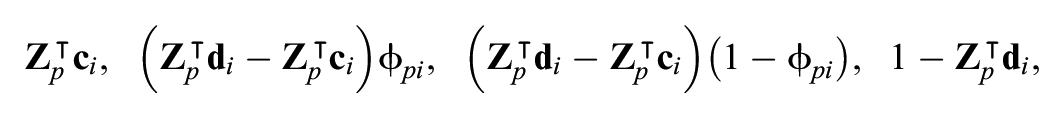
and the probability of a correct response or endorsement is given by
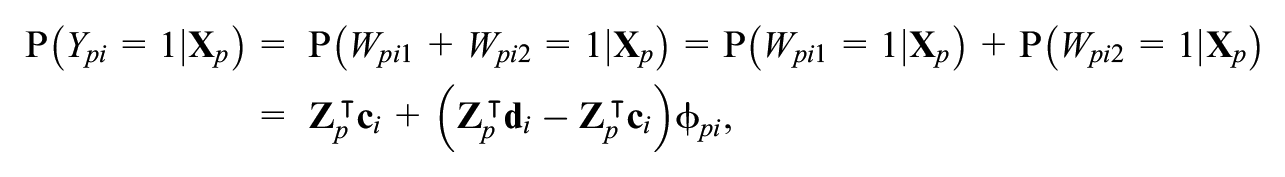
which under the logistic model
Using the setting of the latent variables, the corresponding log-likelihood function for item
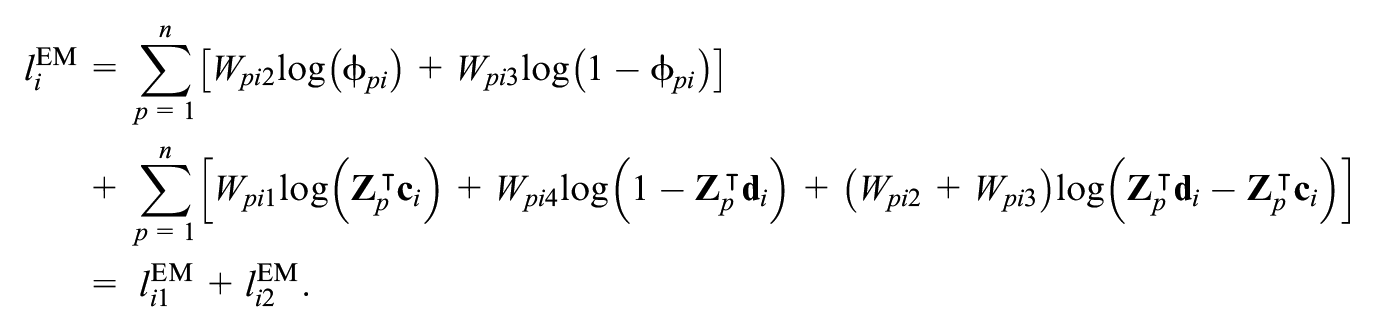
The log-likelihood function
The EM algorithm estimates item parameters in two steps—expectation and maximization. These two steps are repeated until the convergence criterion is met, such as until the change in log-likelihood is lower than a predefined value. Since the EM algorithm is designed to obtain ML estimates, their asymptotic properties are the same as described in Supplemental Appendix A.2.
2.2.3.1 Expectation
At the E-step, conditionally on the item responses
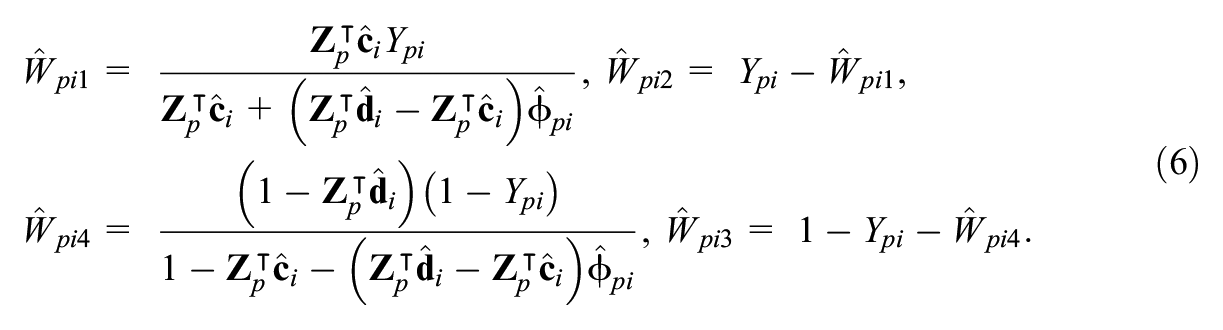
2.2.3.2 Maximization
At the M-step, conditionally on the current estimates of the latent variables
The EM algorithm is designed to gain the ML estimates of the item parameters, so estimates have the same asymptotic properties as described above.
Additionally, it might be of practical interest that the EM algorithm provides estimates of latent variables
2.2.4 Parametrized Link Function
In our setting, the covariate-specific 4PL model (3) can be viewed as a generalized linear model with a known PLF,
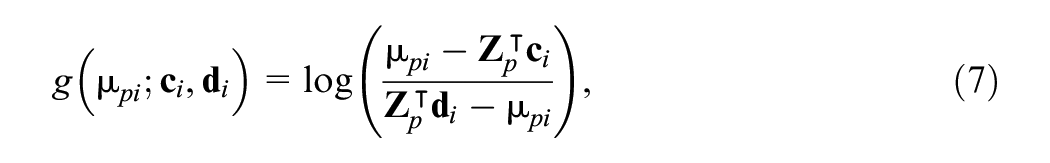
where the parameters
Keeping this setting in mind, this study proposes a new two-stage algorithm to estimate item parameters using the PLF, see Equation (7), which involves repeating two steps until the convergence criterion is fulfilled. Similar to the EM algorithm, the PLF-based estimation method is designed to compute ML estimates; their asymptotic properties align with those detailed in Supplemental Appendix A.2.
2.2.4.1 Step One
First, conditionally on current estimates
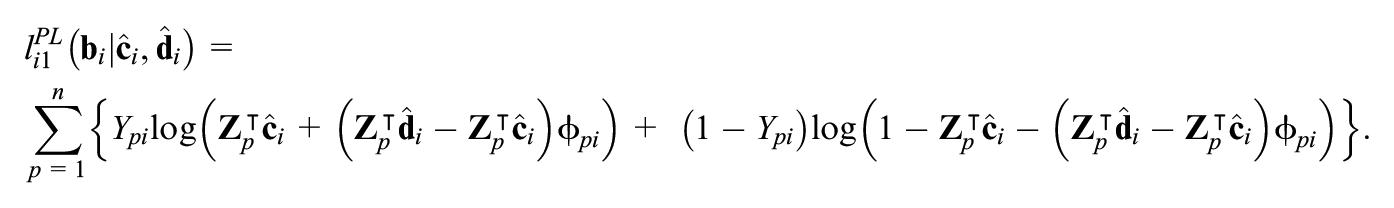
The log-likelihood function
2.2.4.2 Step Two
Next, estimates
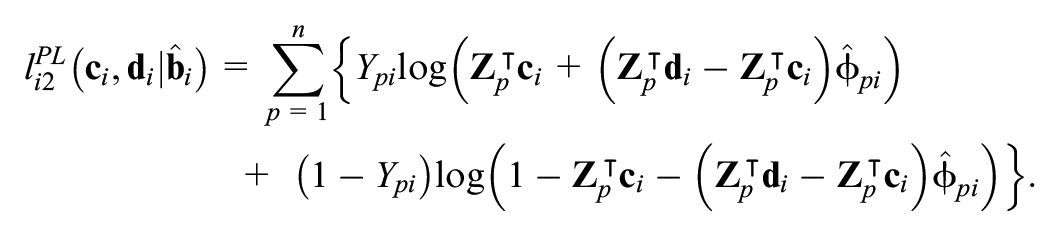
Again, the parameters
In summary, the division into the two sets of parameters makes the algorithm based on PLF easy to implement in the
2.3 Implementation and Software
For all analyses, software
2.3.1 Initial Values
Starting values for item parameters were calculated as follows: The respondents were divided into three groups based upon tertiles of the matching criterion
3. Simulation Study
A simulation study was performed to compare various procedures to estimate parameters in the generalized logistic regression model, including the NLS, the ML method, the EM algorithm, and the newly proposed algorithm based on PLF. Two models were considered—the simple 4PL model (1) and the group-specific 4PL model (2).
3.1 Simulation Design
3.1.1 Data Generation
To generate data, ten sets with different combinations of item parameters were considered. The item parameters were chosen to correspond to common values: Parameters
3.1.2 Simulation Evaluation
To compare estimation methods, we first computed mean and median numbers of iteration runs and the convergence status of the methods, meaning the percentage of converged simulation runs; the percentage of runs that crashed (caused an error when fitting, e.g. due to singularities); and the percentage of those which reached the maximum number of iterations without convergence. Next, we selected only those simulation runs for which all four estimation methods converged successfully. We computed the mean parameter estimates and parametric confidence intervals, that is, average intervals found for estimated standard errors derived for the respective algorithm. When confidence intervals for asymptote parameters exceeded their boundaries of 0 or 1, confidence intervals were truncated at the boundary value. The proportion of confidence intervals covering the true parameter value was calculated. Subsequently, the mean bias (i.e. the mean difference between estimates and true values) and root mean squared error (RMSE; i.e. the square root of the average of squared errors) were calculated with respect to sample size. Finally, for a deeper insight into ML-based methods (i.e. traditionally implemented ML, the EM algorithm, and the algorithm based on PLF), we compared log-likelihoods for these three methods to those based on true values of parameters.
3.2 Simulation Results
3.2.1 Convergence Status
All four methods had low percentages of simulation runs that crashed for all sample sizes in the simple 4PL model (1). Still, the rate was mildly increased in the group-specific 4PL model (2) for the NLS method (6.72%) and for the algorithm based on PLF (9.22%) when
Convergence Status, Proportion of Suspicious Simulation Runs, and the Number of Iterations for the Four Estimation Methods.
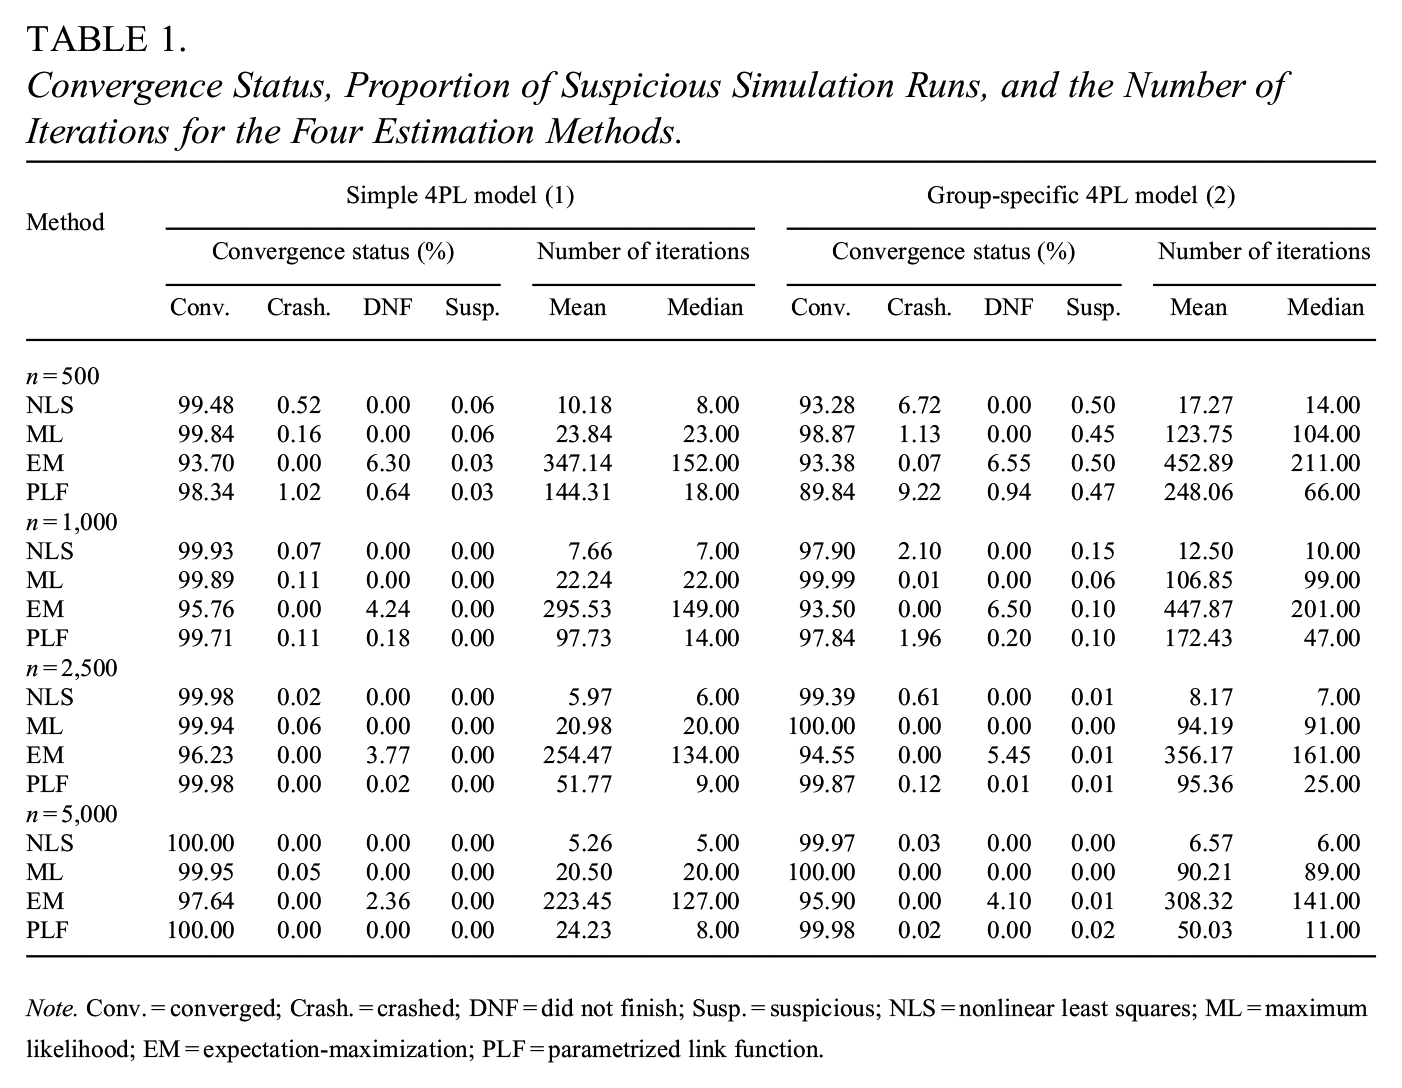
Note. Conv. = converged; Crash. = crashed; DNF = did not finish; Susp. = suspicious; NLS = nonlinear least squares; ML = maximum likelihood; EM = expectation-maximization; PLF = parametrized link function.
3.2.2 Number of Iterations
Furthermore, the methods differed in the number of iterations needed until the estimation process successfully ended. The EM algorithm yielded the largest mean and median numbers of iterations, which were somehow overestimated by simulation runs that did not finish without convergence (i.e. the maximum limit of 2,000 iterations was reached). The fewest iterations were needed for the NLS method. As expected, all the procedures required fewer simulation runs when the simple 4PL model (1) was considered than in the group-specific 4PL model (2). Beyond this, the number of iterations was decreasing with the increasing sample size in both models for all the methods (Table 1).
In both models, some estimation procedures produced nonmeaningful estimates of parameters
3.2.3 Parameter Estimates
In the simple 4PL model (1), the PLF-based algorithm gained the most precise estimates of parameters
Bias, RMSE, and Confidence Interval (CI) Coverage by Four Estimation Methods Using the Simple Model (1).
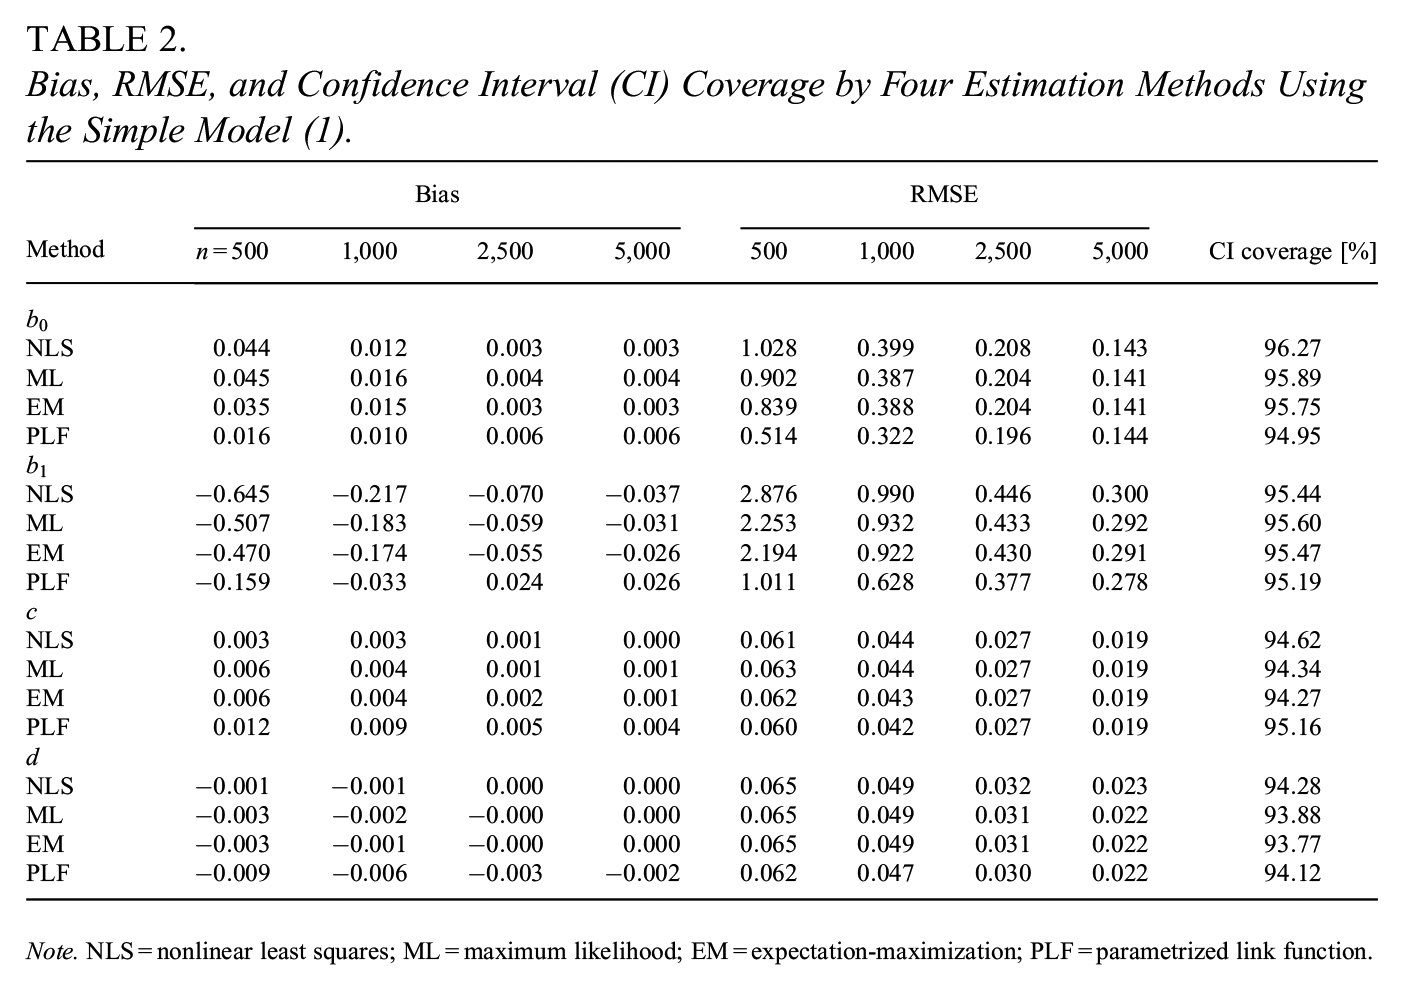
Note. NLS = nonlinear least squares; ML = maximum likelihood; EM = expectation-maximization; PLF = parametrized link function.
In the group-specific 4PL model (2), the PLF-based algorithm yielded the most precise estimates of parameters
Bias, RMSE, and Confidence Interval (CI) Coverage by Four Estimation Methods Using the Group-Specific Model (2).
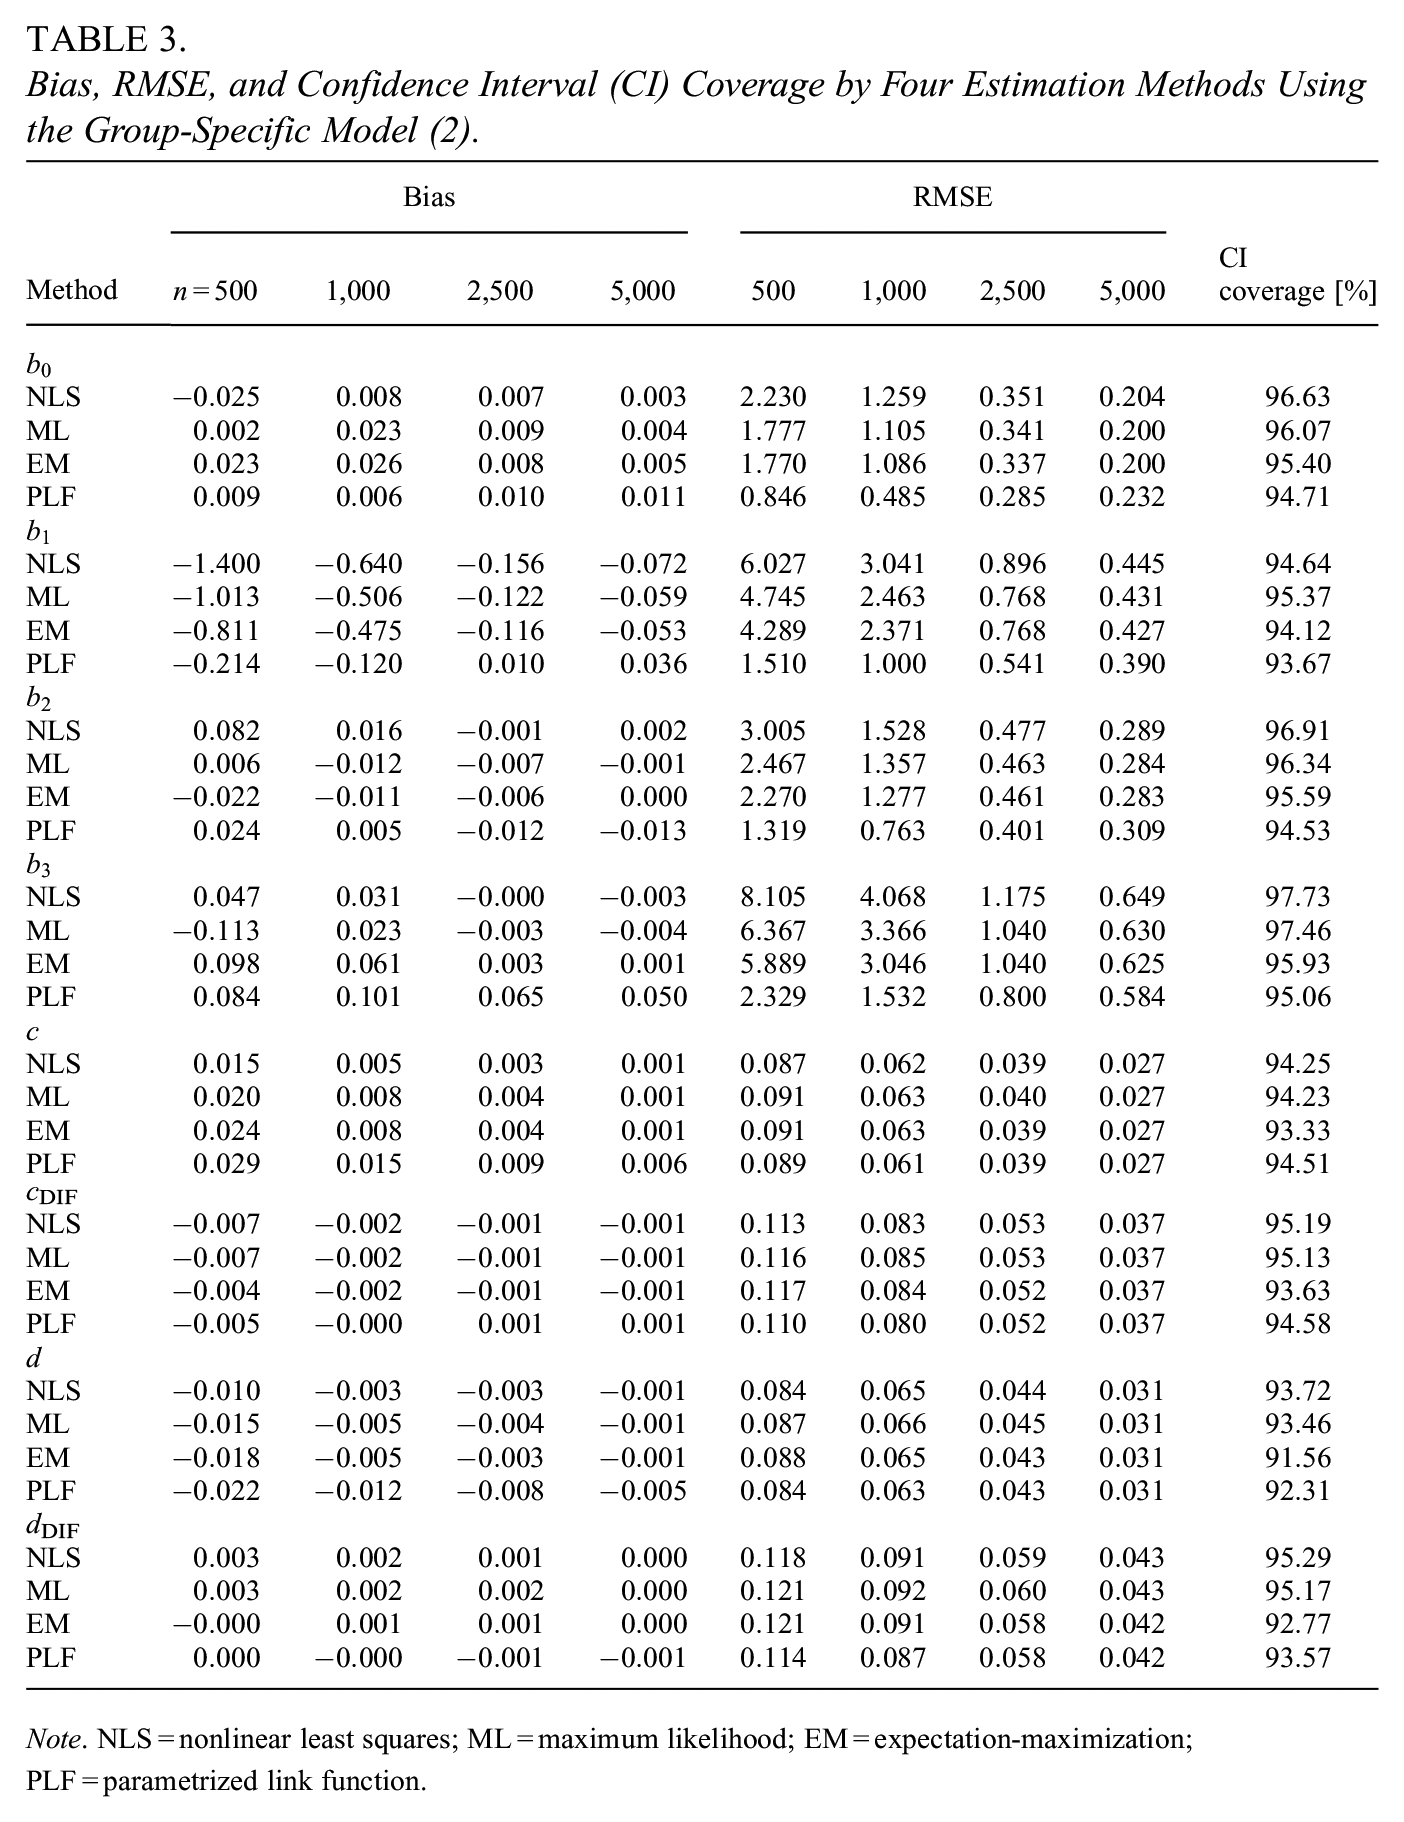
Note. NLS = nonlinear least squares; ML = maximum likelihood; EM = expectation-maximization; PLF = parametrized link function.
3.2.4 Log-Likelihood Comparison
In the simple 4PL model (1), the algorithm based on PLF yielded log-likelihood values nearest to those computed based on true parameters in 91.31% of cases, followed by the EM algorithm in 8.45% and the directly implemented ML method in 0.23% of cases. There were similar differences between the three ML-based methods in the group-specific 4PL model (2). The algorithm based on PLF outperformed other likelihood-based estimation procedures in 87.56% of cases, while the EM algorithm worked the best in 12.06% and the ML method in 0.38%.
4. Real Data Examples
4.1 Data Description
We demonstrate the estimation procedures with an application to DIF detection on two real-data examples, which are available in the
4.1.1 Anxiety Scale
The Anxiety dataset consisted of responses to 29 Likert-type questions (1 = never, 2 = rarely, 3 = sometimes, 4 = often, and 5 = always) from 766 respondents. Additionally, the dataset included information on the respondents’ age, education, and gender (0 = male and 1 = female). Overall, there were 369 male participants and 397 female participants.
For this work, item responses were dichotomized as follows: 0 was assigned to response Never (i.e. response
4.1.2 Learning Competence
The LearningToLearn dataset consisted of binary-coded responses from 782 subjects to (mostly) multiple-choice test consisting of 41 items within seven subscales. Each respondent was tested twice—the first time in the sixth grade and the second time in the ninth grade; responses from the sixth grade only were considered for this analysis. Among other variables, the dataset included information on the school track of respondents (basic school track = 0, academic school track = 1). Overall, 391 students attended basic school, and 391 pursued selective academic school.
4.2 Real Data Analysis Design
This work considered the simple 4PL model (1) and the group-specific 4PL model (2) with different constraints on asymptote parameters, yielding the 3PL models. In the Anxiety dataset, the lower asymptotes were set to zeros, that is,
The matching criterion
The two newly proposed estimation methods were applied for the two datasets and models: the EM algorithm and the algorithm based on PLF. The same approach for computing starting values as in the simulation study was used to analyze both datasets. In the case of convergence issues, the initial values were re-calculated based on successfully converged estimates provided by other methods.
In this study, item parameter estimates were computed and reported with confidence intervals. Next, the likelihood-ratio test using the test statistic from Equation (4) was performed to compare the two nested models (simple and group-specific) to identify the DIF for all items and both novel estimation methods. Finally, for the EM algorithm, mean values of estimated latent variables over all items were computed. A significance level of .05 was used for all the tests.
4.3 Real Data Analysis Results
4.3.1 Anxiety Scale
4.3.1.1 DIF Detection
Using the likelihood-ratio test, the simple 4PL model (1) with constraints on lower asymptotes was rejected for items R6 (“I was concerned about my mental health”;
We now take a closer look at DIF item R7, for which the confidence interval of estimated parameter
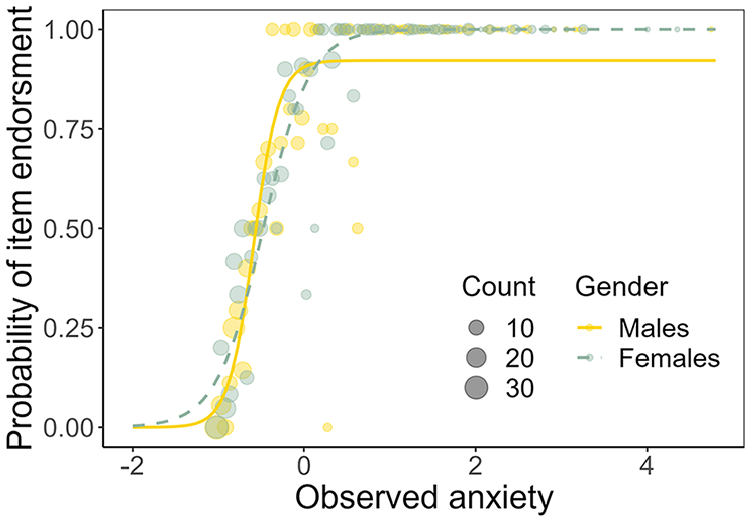
Estimated item characteristic curves of item R7 of the Anxiety dataset for the group-specific 4PL model (2) with constraints on lower asymptotes.
4.3.1.2 Latent Variables Estimates by EM Algorithm
Using the group-specific model (2), male respondent 272 with an overall level of anxiety equal to 0.62 had the highest “inclination to dissimulate,” equal to 0.20, meaning they would have dissimulated almost six items out of the 29-item Anxiety dataset. On the other hand, female respondent 264 with the same overall anxiety level had a probability equal to 0.06, which would correspond to the dissimulation of less than two items.
4.3.2 Learning Competence
4.3.2.1 DIF Detection
Using the likelihood-ratio test, the simple 4PL model (1) with constraints on upper asymptotes was rejected for items 1A (
Items 6F and 6H were identified as functioning differently due to differences in lower asymptotes, that is, confidence interval of estimated parameter
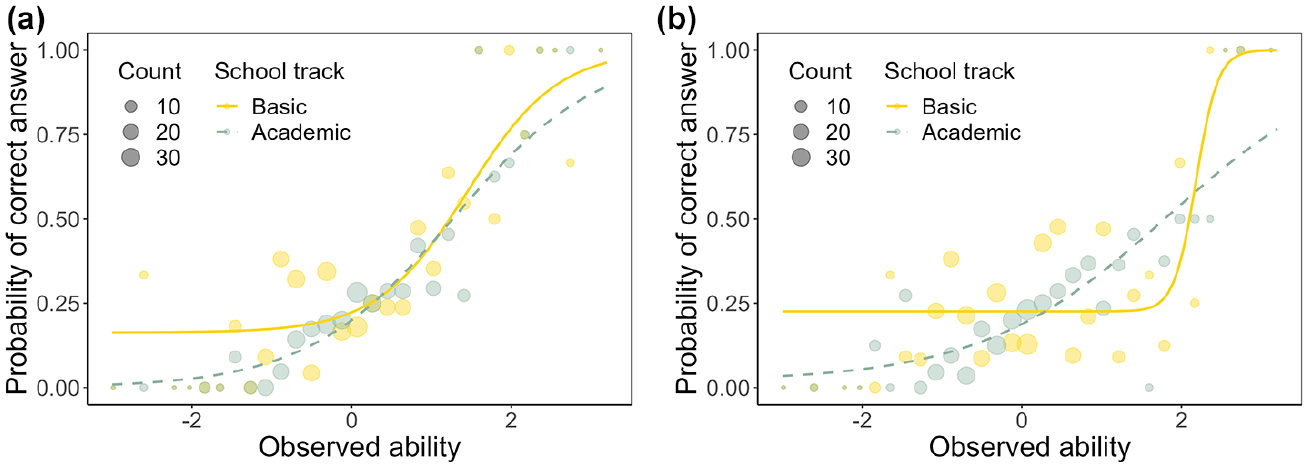
Estimated item characteristic curves of selected DIF items of the LearningToLearn dataset for the group-specific 4PL model (2) with constraints on upper asymptotes. (a) Item 6F and (b) Item 6H.
Both items were related to “solving tasks with invented mathematical operators which are conditionally defined depending on the value of the digits they connect” (Martinková et al., 2020). The original study suggested that students from academic schools might have been trying to solve these difficult items more often, while students from the basic school track might have been guessing more often.
4.3.2.2 Latent Variables Estimates by EM Algorithm
Considering the group-specific model (2), respondent 486, who attended basic school with an overall level of learning competence of
5. Discussion
This work explored novel approaches for estimating item functioning within the GLNMs framework. The study proposed two iterative procedures (a procedure using the EM algorithm and a new method based on PLF) as alternatives to the directly implemented ML method. The methods were compared via simulation with existing algorithms and implemented in
In the simulation study, the traditional NLS approach produced the most biased parameter estimates with wide confidence intervals. The directly implemented ML method performed satisfactorily; however, the newly proposed methods were superior in some aspects: The EM algorithm provided slightly less-biased parameter estimates than the directly implemented ML method, and it more often produced log-likelihood values closer to those computed based on true parameters. These were at the price of a higher number of iterations being needed for this approach to converge, while the maximum number of iterations was reached in several cases. As an added value, the EM algorithm provided additional information on respondents’ latent response styles. The newly proposed algorithm based on PLF yielded the least-biased parameter estimates of the expit function for most settings, especially when small sample sizes and additional covariates were considered. Moreover, in most scenarios, the PLF-based algorithm yielded log-likelihood values nearest to those computed based on true underlying parameters. Conversely, there was a higher rate of crashed simulations for the group-specific 4PL model (2) and small sample size. The precision of the asymptote parameters was similar for all four estimation techniques. As the sample size increased, differences between the estimation methods vanished, and all estimates were near the true values of the item parameters.
Using two real data examples, we illustrated the possible benefits of generalized logistic regression models in item response modeling, estimating asymptotes, and their application to DIF analysis. Further, we presented how the practitioners may benefit from the added value of the EM algorithm, which can be used to estimate the probability of guessing correctly answered items (in the context of psychological assessment, endorsing an item due to pretending) or answering incorrectly due to inattention (in the context of psychological assessment, not endorsing an item due to dissimulation) for individual respondents. We also demonstrated practical challenges in estimation procedures, including specifying initial values.
The EM algorithm proposed in this study builds on the work of Dinse (2011), while we extend their approach to the group-specific and the general covariate-specific models in multi-item measurement setting. Meng et al. (2020) proposed a similar EM algorithm for the 4PL simple model (without additional covariates) in the IRT framework. On the other hand, the PLF-based algorithm is novel and has not been proposed in this form for parameter estimation in the generalized logistic regression model. However, in recent decades, the idea of the PLF has been extensively discussed in the literature by many authors in various contexts, including Basu and Rathouz (2005), Flach (2014), and Scallan et al. (1984). For example, Pregibon (1980) proposed the ML estimation of the link parameters using a weighted least squares algorithm. Similarly, McCullagh and Nelder (1989) adapted this approach and presented an algorithm in which several models with the fixed link functions were fitted. Furthermore, Kaiser (1997) proposed a modified scoring algorithm to perform simultaneous ML estimation of all parameters. Scallan et al. (1984) proposed an iterative two-stage algorithm, building on the work of Richards (1961). This study examined generalized logistic regression, accounting for the possibility of guessing/pretending and inattention/dissimulation, whereas these features may depend upon the respondents’ characteristics.
The crucial part of each estimation process is specifying starting values for item parameters because these values may significantly impact the speed and precision of the estimation process. For instance, initial values far from the true item parameters may lead to situations where the estimation algorithm returns only a local extreme or does not converge. In this work, we used an approach based on an upper-lower index, resulting in low convergence rate issues with satisfactory estimation precision. However, other possible naive estimates of discrimination (and other parameters) could be considered, such as a correlation between an item score and the total test score without a given item.
This study has several limitations, and several possible further directions exist. First, the simulation study was limited to two models—the simple 4PL model (1) and the group-specific 4PL model (2), both of which included only one or two covariates. The simulation study suggested requiring a larger sample size with an increasing number of covariates. Second, all the described algorithms implement the estimation item-by-item, which is typical within the GLNM framework and suitable for the cases when the ability is known or estimated a priori. The benefits include the fact that the items do not necessarily need to be independent, given the ability. One possible path for future research would be to extend the proposed algorithms to estimate all item parameters simultaneously using a joint model (see, e.g. Martinková & Hladká, 2023, Section 6.8). Further, the proposed algorithms may also be implemented in the IRT framework to allow incorporating the latent ability
However, the number of observations on the tails of the matching criterion is typically tiny and provides only small variability at most. These heavy weights would require a nearly exact fit for cases with few observations. Nevertheless, the computation of the NLS estimates demonstrated in this work was straightforward and efficient, providing sufficient precision. Thus, this method could be helpful in some instances, such as producing an initial idea about parameter values and using these estimates as starting values for other approaches. Fourth, it is important to acknowledge that the estimation methods studied here can be sensitive to the choice of optimization algorithm and the control parameters. The directly implemented ML estimation was performed with the “L-BFGS-B” algorithm to account for constraints in asymptotes. Alternatively, asymptote parameters may depend on covariates through a transformation function, so the estimating algorithm does not need to incorporate constraints. The performance of these two approaches might differ. Moreover, the control parameters were set the same for all estimation methods, while the sensitivity of methods to their setting may vary and may be imposed in different quantities in different algorithms (e.g. deviation, likelihood, or the norm of gradient vector). For instance, the EM algorithm is known to require a large number of iterations till convergence, especially near the maximum. A potential improvement could involve a hybrid strategy, where the EM algorithm is run for a fixed number of iterations, followed by a single ML iteration at the end.
While the primary focus of this article lies in enhancing parameter estimation within GLNMs for multi-item measurement, it also touches upon the application of these algorithms in DIF detection. We illustrated the DIF detection by comparing the largest and the smallest models; however, a step-by-step procedure omitting the parameters with nonsignificant effects might be applied in practice to explore DIF in detail. Although DIF detection is not the central theme, practical examples illustrate the significance of assessing the fairness and validity of assessments across diverse groups. Nevertheless, this study does not aim to evaluate the properties of the underlying DIF detection procedure or to compare it with popular existing methods such as the anchor item-based approaches (Candell & Drasgow, 1988; Clauser et al., 1993; W.-C. Wang & Yeh, 2003; Kopf et al., 2015) or more recent regularization-based approaches (Magis et al., 2015; Tutz & Schauberger, 2015; Belzak & Bauer, 2020; C. Wang et al., 2023).
Establishing a common scale on which respondents from different groups can be scored and ranked is a crucial step in DIF analysis. In both the IRT and non-IRT frameworks (including, e.g., the Mantel–Haenszel test or SIBTEST procedure), the inclusion of DIF items in estimation or computation of ability estimate may have a severe impact on which items are detected as functioning differently. One possibility for dealing with such an issue is applying an item purification iterative algorithm (Lord, 1980). Additionally, as the number of hypotheses tested may get large, p-value adjustments could be considered (see Hladká et al., 2024, for discussion).
In contrast to the IRT framework, GLNMs offer flexibility in selecting the ability variable
Finally, GLNMs discussed in this article do not account for missing data. However, when estimation and potential DIF detection are performed for each item separately, this would minimize the omission of data.
This study’s real data examples explored item functioning in the multi-item measurement related to anxiety and learning competencies. However, the parameter estimation task in the presented models would also be relevant to many other educational, psychological, and health-related measurement areas, such as the assessment of well-being, fatigue, reading literacy, and others. Moreover, the generalized logistic regression model is not limited to multi-item measurements since the class determined by Equation (3) represents a broad family of the covariate-specific 4PL models. This model might be used and further extended in various study fields, including but not limited to quantitative pharmacology (Dinse, 2011), applied microbiology (Brands et al., 2020), modeling patterns of urban electricity usage (To et al., 2012), and plant growth modeling (Zub et al., 2012). Therefore, the estimation procedures proposed in this work are highly relevant for a wide range of researchers and practitioners, both within and outside the psychometric field.
To conclude, this study researched advances in fitting generalized logistic regression models using various estimation techniques, including two newly proposed ones. We demonstrated the superiority of the novel implementation of the EM algorithm and the newly proposed method based on PLF over the existing NLS and directly implemented ML methods. Improving estimation algorithms is critical since it could increase precision while maintaining a user-friendly implementation. It may also provide additional information regarding individual respondents and items; thus, it is worth investing resources in the advancements of estimation methods.
Supplemental Material
sj-docx-1-jeb-10.3102_10769986241312354 – Supplemental material for New Iterative Algorithms for Estimation of Item Functioning
Supplemental material, sj-docx-1-jeb-10.3102_10769986241312354 for New Iterative Algorithms for Estimation of Item Functioning by Adéla Hladká, Patrícia Martinková and Marek Brabec in Journal of Educational and Behavioral Statistics
Footnotes
Acknowledgements
We sincerely thank the anonymous reviewers for their valuable comments and suggestions on earlier versions of the manuscript. We especially appreciate their encouragement to explore measurement errors.
Declaration of Conflicting Interests
The author(s) declared no potential conflicts of interest with respect to the research, authorship, and/or publication of this article.
Funding
The author(s) disclosed receipt of the following financial support for the research, authorship, and/or publication of this article: The study was funded by the Czech Science Foundation project “Theoretical Foundations of Computational Psychometrics” grant number 21-03658S, by the project “Research of Excellence on Digital Technologies and Well-being CZ.02.01.01/00/22_008/0004583” which is co-financed by the European Union, and by the institutional support RVO 67985807.
Supplementary Material
Notes
Authors
ADÉLA HLADKÁ is a Researcher at the Department of Statistical Modelling, Institute of Computer Science of the Czech Academy of Sciences; the time of the work on the article included the period when she was an ICS Ph.D. fellow and a Ph.D. Student at the Department of Probability and Mathematical Statistics, Faculty of Mathematics and Physics, Charles University, e-mail:
PATRÍCIA MARTINKOVÁ is a Senior Researcher and a Chair at the Department of Statistical Modelling, Institute of Computer Science of the Czech Academy of Sciences, and an Associate Professor at the Institute for Research and Development in Education, Faculty of Education, Charles University, e-mail:
MAREK BRABEC is a Senior Researcher at the Department of Statistical Modelling, Institute of Computer Science of the Czech Academy of Sciences, e-mail:
References
Supplementary Material
Please find the following supplemental material available below.
For Open Access articles published under a Creative Commons License, all supplemental material carries the same license as the article it is associated with.
For non-Open Access articles published, all supplemental material carries a non-exclusive license, and permission requests for re-use of supplemental material or any part of supplemental material shall be sent directly to the copyright owner as specified in the copyright notice associated with the article.