
Abstract
The cross-classified data structure is ubiquitous in education, psychology, and health outcome sciences. In these areas, assessment instruments that are made up of multiple items are frequently used to measure latent constructs. The presence of both the cross-classified structure and multivariate categorical outcomes leads to the so-called item-level data with cross-classified structure. An example of such data structure is the routinely collected student evaluation of teaching (SET) data. Motivated by the lack of research on multilevel IRT modeling with crossed random effects and the need of an approach that can properly handle SET data, this study proposed a cross-classified IRT model, which takes into account both the cross-classified data structure and properties of multiple items in an assessment instrument. A new variant of the Metropolis–Hastings Robbins–Monro (MH-RM) algorithm was introduced to address the computational complexities in estimating the proposed model. A preliminary simulation study was conducted to evaluate the performance of the algorithm for fitting the proposed model to data. The results indicated that model parameters were well recovered. The proposed model was also applied to SET data collected at a large public university to answer empirical research questions. Limitations and future research directions were discussed.
Keywords
1. Introduction
Data that span across multiple levels are prevalent in social and behavioral sciences. These multilevel data can be either hierarchical or have nonhierarchical structures. The hierarchical data are characterized by the exact nesting of lower level units in one and only one higher level unit (e.g., students nested within schools). When the lower level units belong to two or more than two non-nested higher level units simultaneously, the data exhibit a cross-classified structure (Beretvas, 2011; Browne et al., 2001; Fielding & Goldstein, 2006; Goldstein, 1994), and the lower level units are said to be cross-classified by the crossed factors (e.g., students being crossed-classified by schools and residential areas). Such cross-classified data are frequently encountered in education (e.g., Leckie, 2009; Levels et al., 2008; Rasbash et al., 2010), psychology (e.g., Pedan et al., 2007), and health outcome sciences (Barker et al., 2020). Also in these areas, assessment instruments that are made up of multiple items, such as survey questionnaires and clinical scales, are routinely employed to measure latent constructs.
In the presence of the cross-classified structure, responses to items in an assessment are the so-called item-level data with cross-classified structure. Such data are pervasive in education and allied disciplines (e.g., Dunn et al., 2015; Ecob et al., 2004; Lei et al., 2018; Spooren, 2010). A familiar example is the student evaluation of teaching (SET) survey data, which strongly motivated the study reported here. Across colleges and universities in North America, student evaluation surveys are employed regularly to measure teaching effectiveness and to inform institutional decision-making. Within an academic cycle, students take multiple courses and respond to the same set of survey items more than once to evaluate different instructors. At the same time, instructors teach more than one course and are evaluated by multiple students with the same survey items. The students are not perfectly nested within instructors, and instructors do not always see the same students. The responses to survey items are determined by unobserved influences from both the students and instructors, along with psychometric properties of the items (e.g., item location and discriminability).
The structure of SET data (as an example of item-level data with cross-classified structure) is further illustrated in Table 1. The columns of Table 1 represent students, and its rows are instructors. Cells of the table represent observations and are cross-classified by students and instructors. Each of the observations consists of responses to all items in the survey. Therefore, the item responses are at level 1, while the two crossed factors, students and instructors, are at level 2. This data structure showed in Table 1 is different from and more complicated than the conventional item response data matrix, where item responses can be viewed as being crossed-classified by persons and items. This is because in Table 1 the cross-classification of students and instructors happens at a higher level than the items. The item-level data with cross-classified structure are multivariate and, at the same time, categorical by nature.
Illustration of Item-Level Data With Cross-Classified Structure
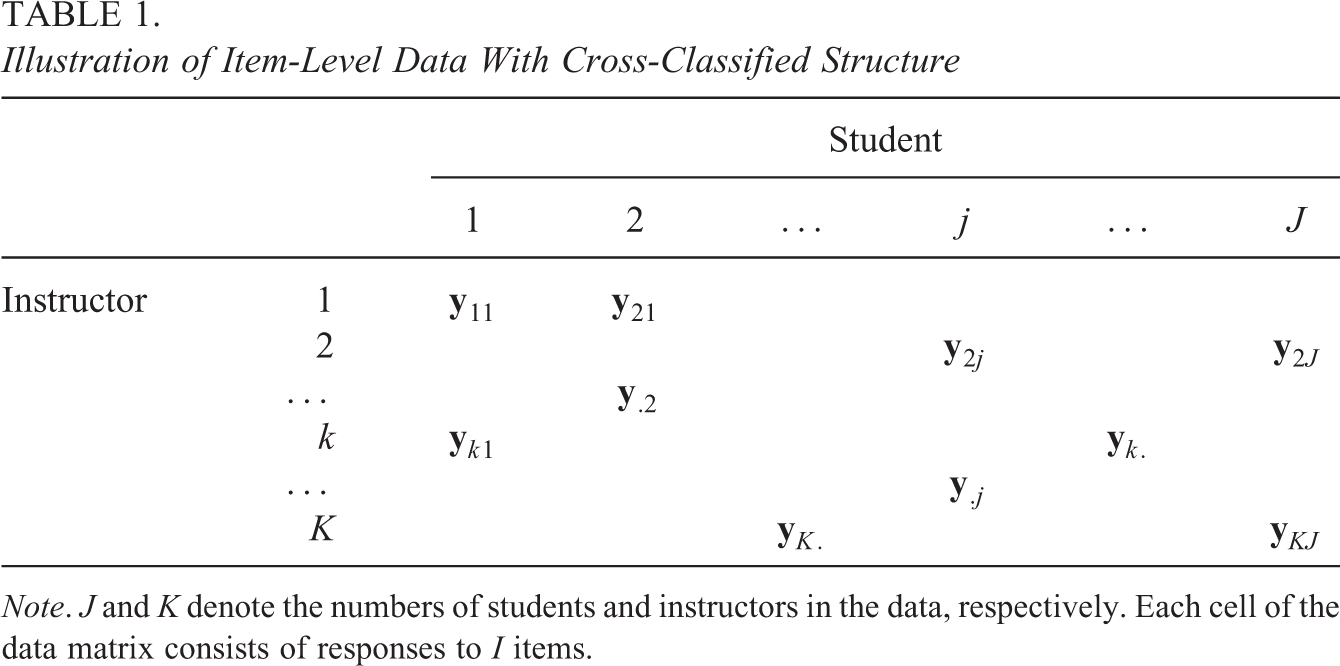
Note. J and K denote the numbers of students and instructors in the data, respectively. Each cell of the data matrix consists of responses to I items.
In practice, when item-level data with cross-classified structure are analyzed, two classes of questions can be of interest. The first class asks about the effects of crossed factors and impacts of key covariates. An example of such research questions is “how gender and underrepresented minority (URM) status of students and instructors predict the teaching effectiveness?” The second class of research questions concerns the quality of assessment instruments (e.g., reliability) and psychometric properties of items. These two classes of research questions are usually addressed using two separate modeling approaches: the cross-classified random effects models (CCREMs; Goldstein, 1994; Raudenbush, 1993) for the first class and standard item response theory (IRT) models for the second. Neither of the two approaches, however frequently used they have been, can fully model the item-level data with cross-classified structure.
When the CCREM approach is utilized, responses to all items in the assessment instrument are combined into one score, either by adding up the responses or taking the average. Then, the summed/average scores are modeled as a function of random effects of crossed factors and fixed effects of predictors of interest. This CCREM approach allows partitioning the total variance of the summed/average scores into components contributed by different crossed factors and enables estimating fixed regression coefficients. However, while the summed/average scores are employed as the outcome, all items are treated in the same way and the differences in item properties are ignored. Classical summed/average score-based psychometrics does not capture the full range of nuance supported by IRT modeling.
Standard IRT models allow studying the psychometric properties of items. However, the cross-classified structure, when present, is typically overlooked (e.g., adopting a single-level IRT model while assuming independent observations), or misspecified (e.g., using a nested two-level IRT model and effectively ignoring one of the crossed factors). The impact of inappropriate modeling of cross-classified data with multivariate and categorical outcomes has not been fully explored in the literature. Within the CCREM literature, however, a number of studies (e.g., Luo & Kwok, 2009; Meyers & Beretvas, 2006; Ye & Daniel, 2017) already showed that the standard errors (SEs) of fixed effects would be underestimated and the estimates of variance components would be biased when the cross-classified data structure is misspecified. The implication for models that rely on multivariate categorical data such as IRT is clear: Estimates could be meaningfully impacted, and more research is needed.
Despite the clear need of an approach to properly handle item-level data with cross-classified structure (e.g., SET data), to our knowledge, little research exists in the literature. In contrast, IRT models developed to model the item-level data with a hierarchical structure (e.g., item responses nested within students and students nested within schools), namely, multilevel IRT models have received much more attention (e.g., Fox, 2003, 2004, 2005; Fox & Glas, 2001; Kamata, 2001; Maier, 2001; Rabe-Hesketh et al., 2004). With multilevel IRT models, item responses are specified as a function of random effects associated with units at different levels and fixed effects of items. The random effects in multilevel IRT models (e.g., students and school random effects) are nested and not crossed.
The lack of research on IRT modeling with cross-classified structure can be partly attributed to the statistical and computational complexities in estimating multilevel latent variable models with crossed random effects. The difficulty arises from the presence of both the crossed random effects and the multivariate categorical outcomes. The marginal likelihood function from which structural parameters are estimated usually involves high-dimensional integrals that admit no closed-form solution. Therefore, evaluating the likelihood function requires numerical approximations. For quadrature-based approaches, the computational burden grows exponentially as the number of random effects increases. When the Markov chain Monte Carlo (Robert & Casella, 2013) method is utilized to estimate multilevel latent variable models with crossed random effects, special attention has to be paid to the specification of priors, among other computational considerations and tweaks. As Lambert (2006) pointed out, while estimating a multilevel model, the role of the prior distributions for variance parameters is crucial, especially when the number of level-2 units is small. In addition, there is unlikely going to be a vague prior, which leads to a posterior mean or mode that is close to the maximum likelihood estimate (MLE), that works for all scenarios.
In this study, we develop an IRT model, namely, the cross-classified IRT model, for appropriately modeling item-level data with cross-classified structure. This model accounts for the cross-classified data structure while evaluating psychometric properties of items. The proposed cross-classified IRT model assumes that the effects of crossed factors (e.g., students and instructors) are random, and effects of items are fixed. Therefore, it can be viewed as a multivariate nonlinear mixed effects model. In this sense, the well-known random item effect IRT models (De Boeck, 2008; Van den Noortgate et al., 2003) can be considered a special case of the proposed model with the outcome being univariate.
This study also aims to address the computational challenge in estimating multilevel latent variable models with crossed random effects, of which the proposed cross-classified IRT model is a special case, by introducing a variant of the Metropolis–Hastings Robbins–Monro (MH-RM) algorithm (Cai, 2010a, 2010b; Chung & Cai, 2021; Huang, 2021; Monroe & Cai, 2014; Yang & Cai, 2014) that implements a new imputation strategy.
The remainder of this article is structured as follows. In Section 2, we present the formulation of the proposed cross-classified IRT model. In Section 3, we first outline the general scheme of the MH-RM algorithm and then introduce the imputation strategy designed for estimating multilevel latent variable models with crossed random effects. In Section 4, we present a preliminary simulation study that evaluates the performance of the new variant of the MH-RM algorithm under various conditions. In Section 5, we demonstrate the proposed model with SET data collected at a large public university. In Section 6, we conclude this study and discuss limitations and future research directions.
2. A Multilevel IRT Model for Cross-Classified Data
This section introduces a cross-classified IRT model for item-level data with crossed-classified structure. Without loss of generality, let us assume that the N observations in the data are cross-classified by two factors. The two crossed factors are conveniently named column-side and row-side factors. Let there be J unique column-side units and K unique row-side units. Note that the data do not have to be fully crossed. In other words, N does not necessarily equal to
2.1. Latent Structural Model
Let


In Equation 1,
2.2. Measurement Model
For an item with two categories, the measurement model of the cross-classified IRT model extends the standard two parameter logistic (2PL) model. Let

In Equation 3,
For an item with more than two strictly ordered categories, Samejima’s (1969) graded response model (GRM) is employed due to its popularity for modeling survey responses. Specifically, a set of cumulative probabilities are specified as follows:


In Equation 4,

for
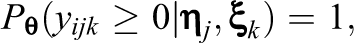
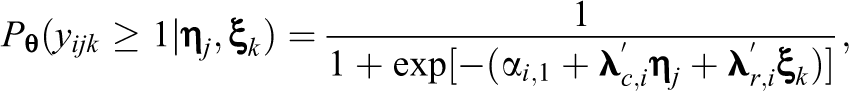
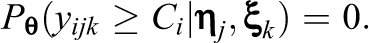
2.3. Observed and Complete Data Likelihood
It follows from Equation 5 that the conditional distribution of
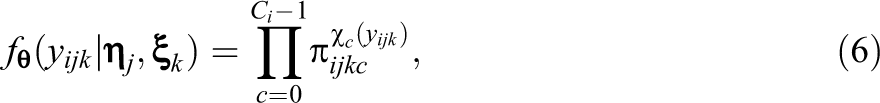
where the indicator function is

for
Let
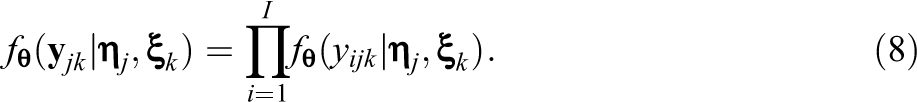
Let

In Equation 9,
The latent variables,
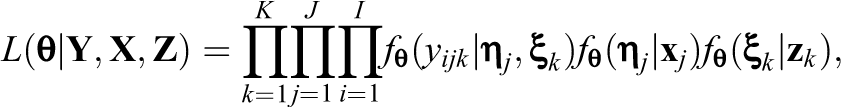
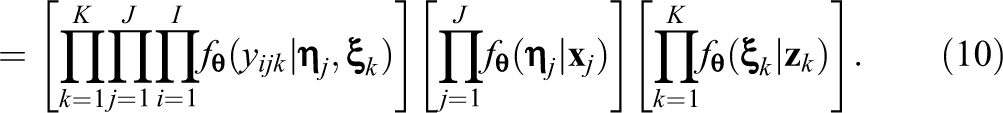
Equation 10 has a fully factored structure and consists of three parts, which correspond to the measurement model and two multivariate regression models. The dominating insight here is that if the latent variables were observed, the complete data likelihood function would be relatively simple to evaluate and maximize.
3. Estimation of the Cross-Classified IRT Model
To estimate the proposed cross-classified IRT model, we introduce a variant of the MH-RM algorithm that adopts a new imputation strategy. In this section, we first outline the general scheme of the MH-RM algorithm and then describe the imputation strategy utilized in detail. In addition, we show approaches to obtain SEs of the MLEs of model parameters.
3.1. MH-RM Algorithm
The MH-RM algorithm combines the Metropolis–Hastings (MH; Hastings, 1970; Metropolis et al., 1953) sampler with the data augmented Robbins–Monro (RM; Robbins & Monro, 1951) stochastic approximation algorithm. It connects Fisher’s (1925) identity and Robbins and Monro’s (1951) root-finding algorithm for noise-corrupted regression functions and produces MLEs of model parameters. The MH-RM algorithm has been applied in many latent variable modeling contexts (e.g., Cai, 2010a, 2010b; Chung & Cai, 2021; Falk & Cai, 2016; Huang et al., 2022; Ju & Falk, 2019; Monroe & Cai, 2014; Yang & Cai, 2014).
Let
3.1.1. Stochastic imputation
Impute
3.1.2. Stochastic approximation
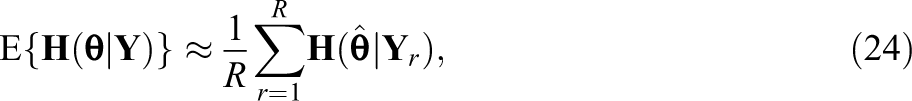
Approximate the gradient of the complete data log-likelihood as the average of gradients of
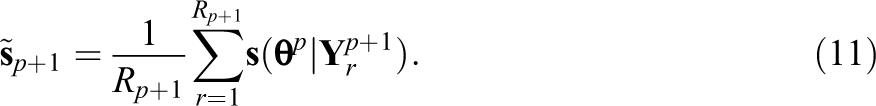
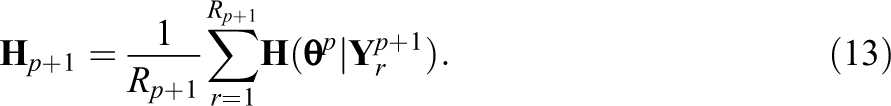
By Fisher’s (1925) identity, which states that the gradient of the observed data log-likelihood equals to the conditional expectation of the gradient of the complete data log-likelihood, Equation 11 is an approximation of the observed data gradient. In this step, the complete data information matrix
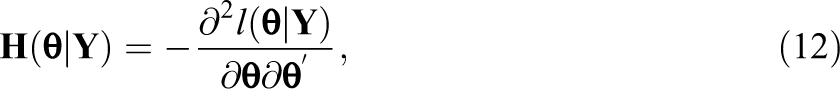
is also approximated as the sample average
3.1.3. RM update
Let

where

Then,

With the RM method, the “noise” introduced in the stochastic imputation step through imputing missing data is counteracted. In practice, a few burn-in iterations are ran before main iterations of the MH-RM algorithm. The main iterations are divided into three stages. Stage I utilizes a fixed gain constant
3.2. Implementation of the MH Sampler
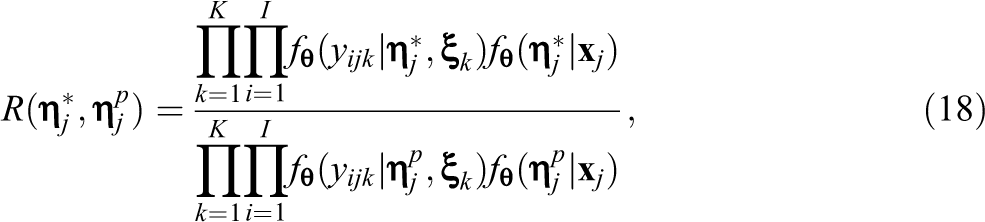
To address the computational challenge in estimating crossed random effects, a new imputation strategy was applied, which couples the Metropolis-within-Gibbs algorithm (Patz & Junker, 1999a, 1999b) with the alternating imputation-posterior (AIP) algorithm (Cho & Rabe-Hesketh, 2011; Chung & Cai, 2021; Clayton & Rasbash, 1999). Specifically, the imputation process alternates between latent variables associated with different crossed factors. In the two-factor example, this process alternates between the column-side and row-side latent variables.
Let


where
and remains
Imputations of the row-side latent variables are generated in the same fashion. Note that while the row-side latent variables are imputed, the column-side latent variables are fixed to values generated at the current iteration
3.3. SE Estimation
SEs of parameter estimates are obtained by taking the square root of diagonal elements of the inverse of the observed data information matrix. Let


Two types of SEs are defined based on how Equation 19 is used: (a) recursively approximated SEs and (b) post-convergence approximated SEs (Cai, 2010a; Yang & Cai, 2014).
3.3.1. Recursively approximated SEs
The observed data information matrix

where

In a similar fashion, the third term is recursively approximated as

Following Equation 19, the observed data information matrix is approximated as

3.3.2. Post-convergence approximated SEs
This approach directly applies Equation 19 after the MH-RM algorithm converges. Once convergence is achieved, additional MH-RM iterations are needed to generate R samples of latent variables/missing data to approximate the observed data information matrix. Specifically, the first and second term are approximated as

The third term is zero since

4. Simulation Study
A simulation study was conducted to evaluate the performance of the MH-RM algorithm for estimating the cross-classified IRT model under various conditions (summarized in Table 2). Three factors were manipulated in the simulation study: (a) the number of column-side units J (e.g., students), (b) the number of row-side units K (e.g., instructors), and (c) the ratio of variances of the column-side and row-side latent variables. Three levels of J considered were 500, 1,000, and 2,000. To mimic real-world scenarios, where the numbers of column-side and row-side units tend to be unequal, for each J, three different Ks were considered, which were, respectively, 10%, 20%, and 40% of J. For
Therefore, a total of
Simulation Conditions
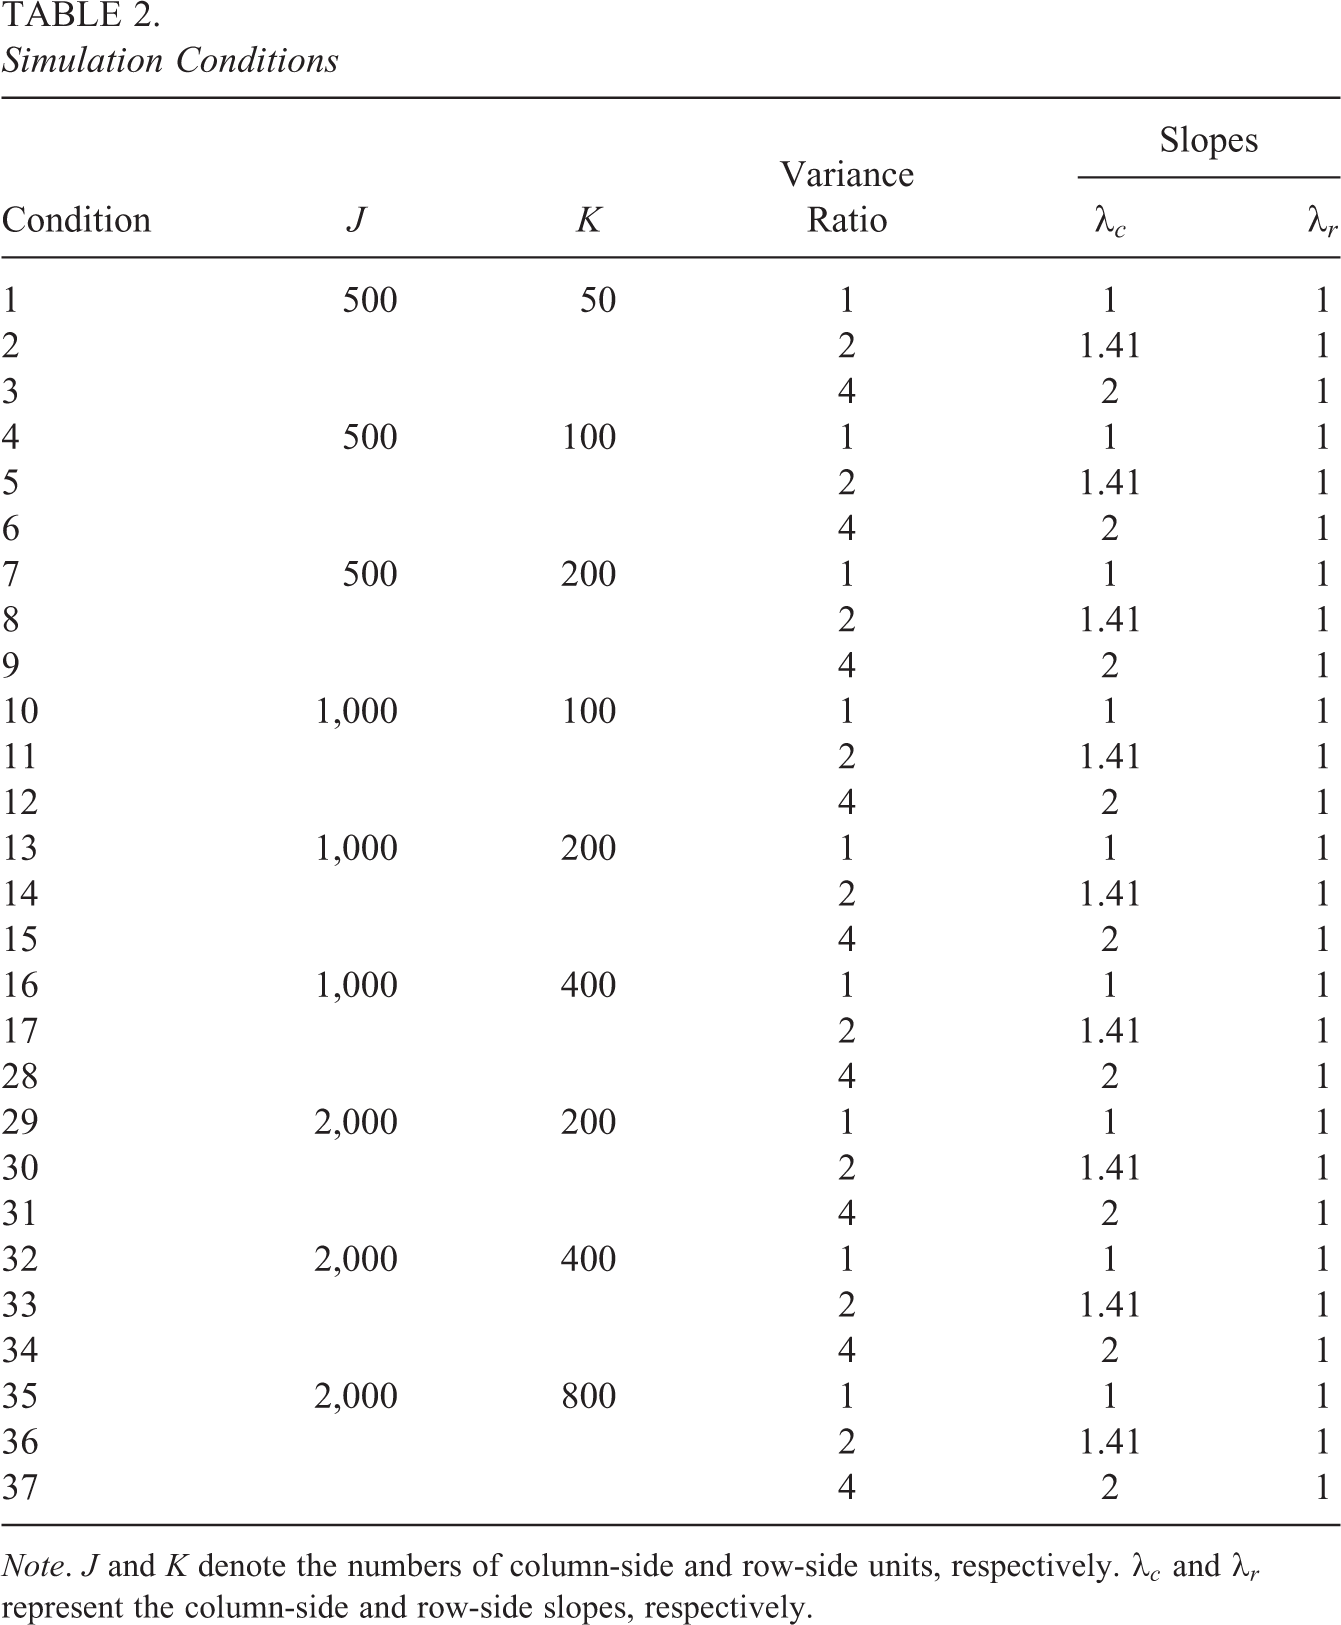
Note. J and K denote the numbers of column-side and row-side units, respectively.
4.1. Data Generation
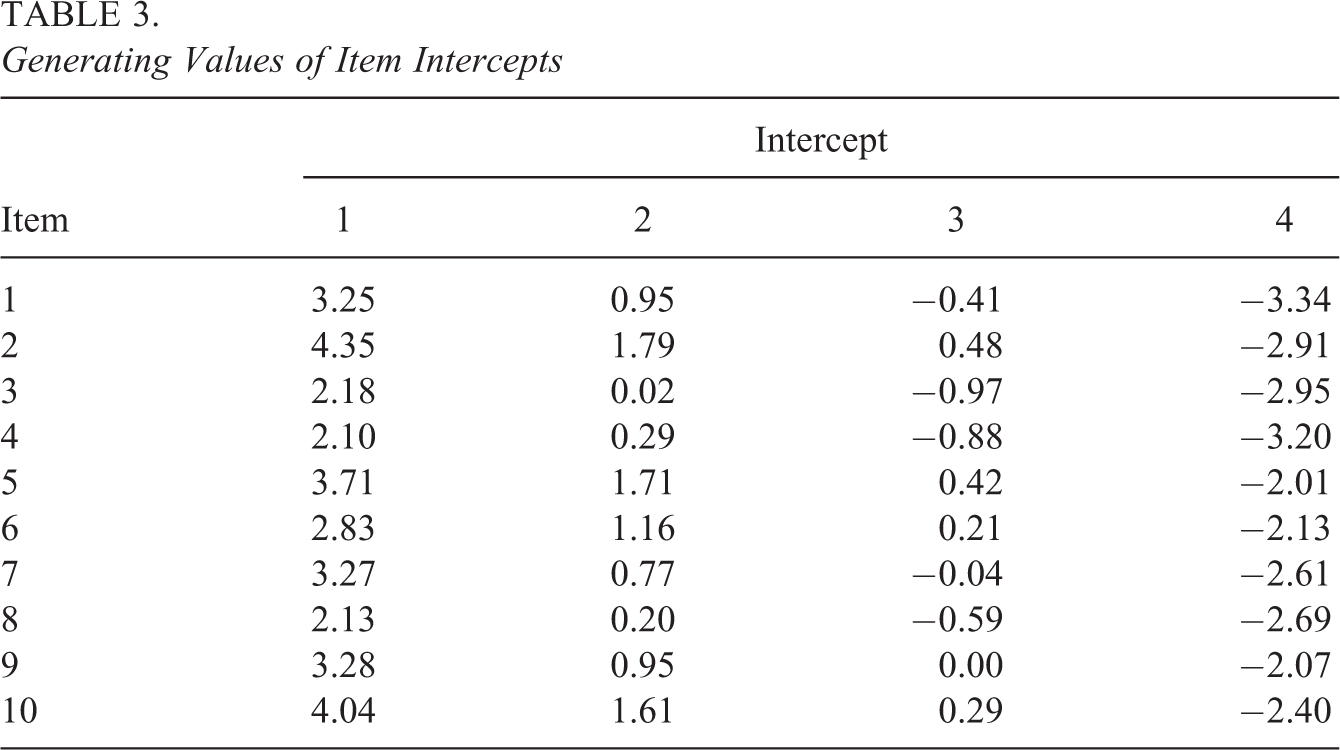
For each simulation condition, responses to 10 five-category items were generated based on the proposed cross-classified IRT model using R (R Core Team, 2018). For simplicity, both the column-side and row-side latent variables were assumed to be unidimensional (i.e.,
To simulate item responses, J column-side and K row-side random effects were first drawn from a standard normal distribution (rounded to the second decimal place). The column-side covariates xj and row-side covariates zk were simulated from a standard normal distribution (rounded to the second decimal place). The generating values of the regression coefficients associated with xj and zk were 0.7 and 0.3, respectively. The simulated random effects and covariates were then plugged into Equations 1 and 2 to obtain J column-side latent variables and K row-side latent variables.
If a fully crossed design was adopted, the
Generating Values of Item Intercepts
4.2. Estimation Details
All simulated data were analyzed with flexMIRT® (Cai, 2017). Informed by this research, flexMIRT® implements the new variant of the MH-RM algorithm for cross-classified IRT modeling. Across all conditions, the numbers of iterations in the two fixed gain constant stages (Stages I and II) of the algorithm were 5,000 and 500. The gain constant applied in these two stages was 0.5, that is,
4.3. Simulation Results
Table 4 shows the generating values of the column-side slope
The bias of
Estimates of Slopes
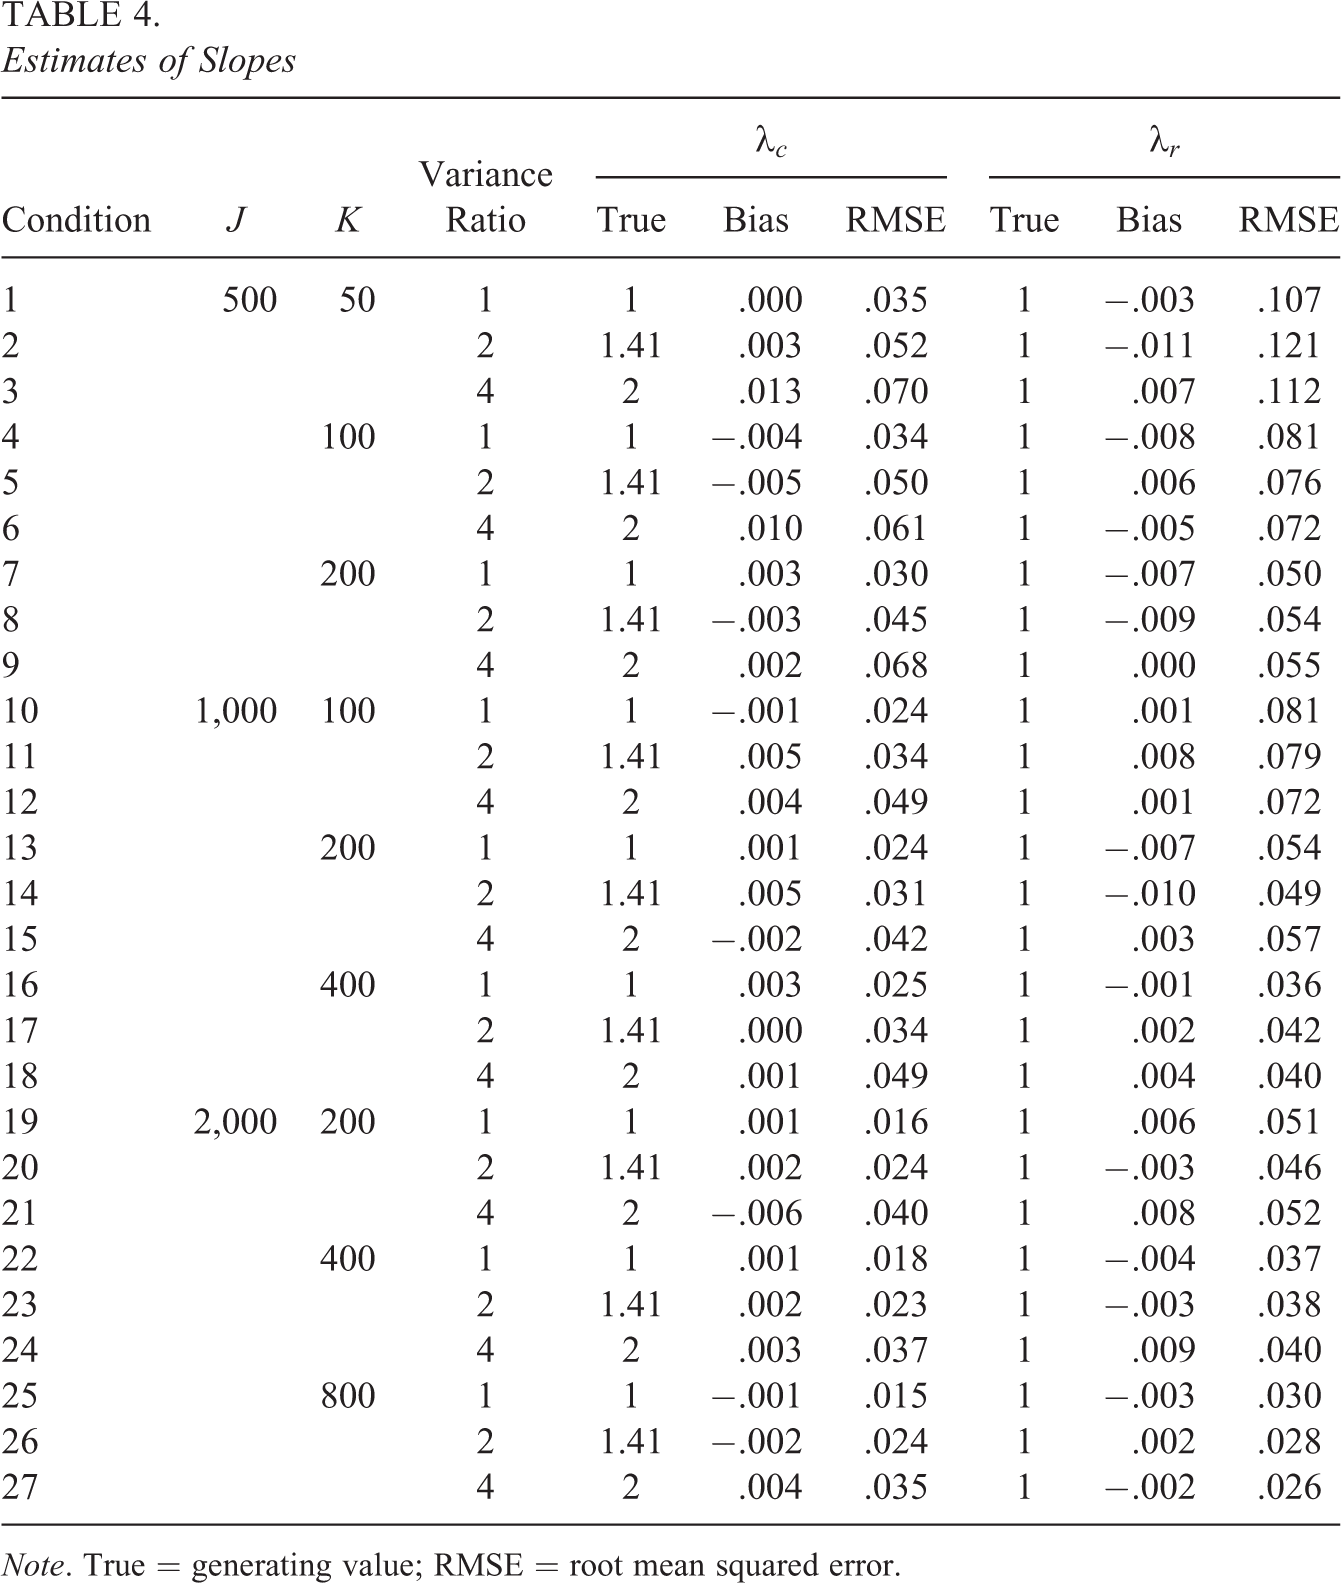
Note. True = generating value; RMSE = root mean squared error.
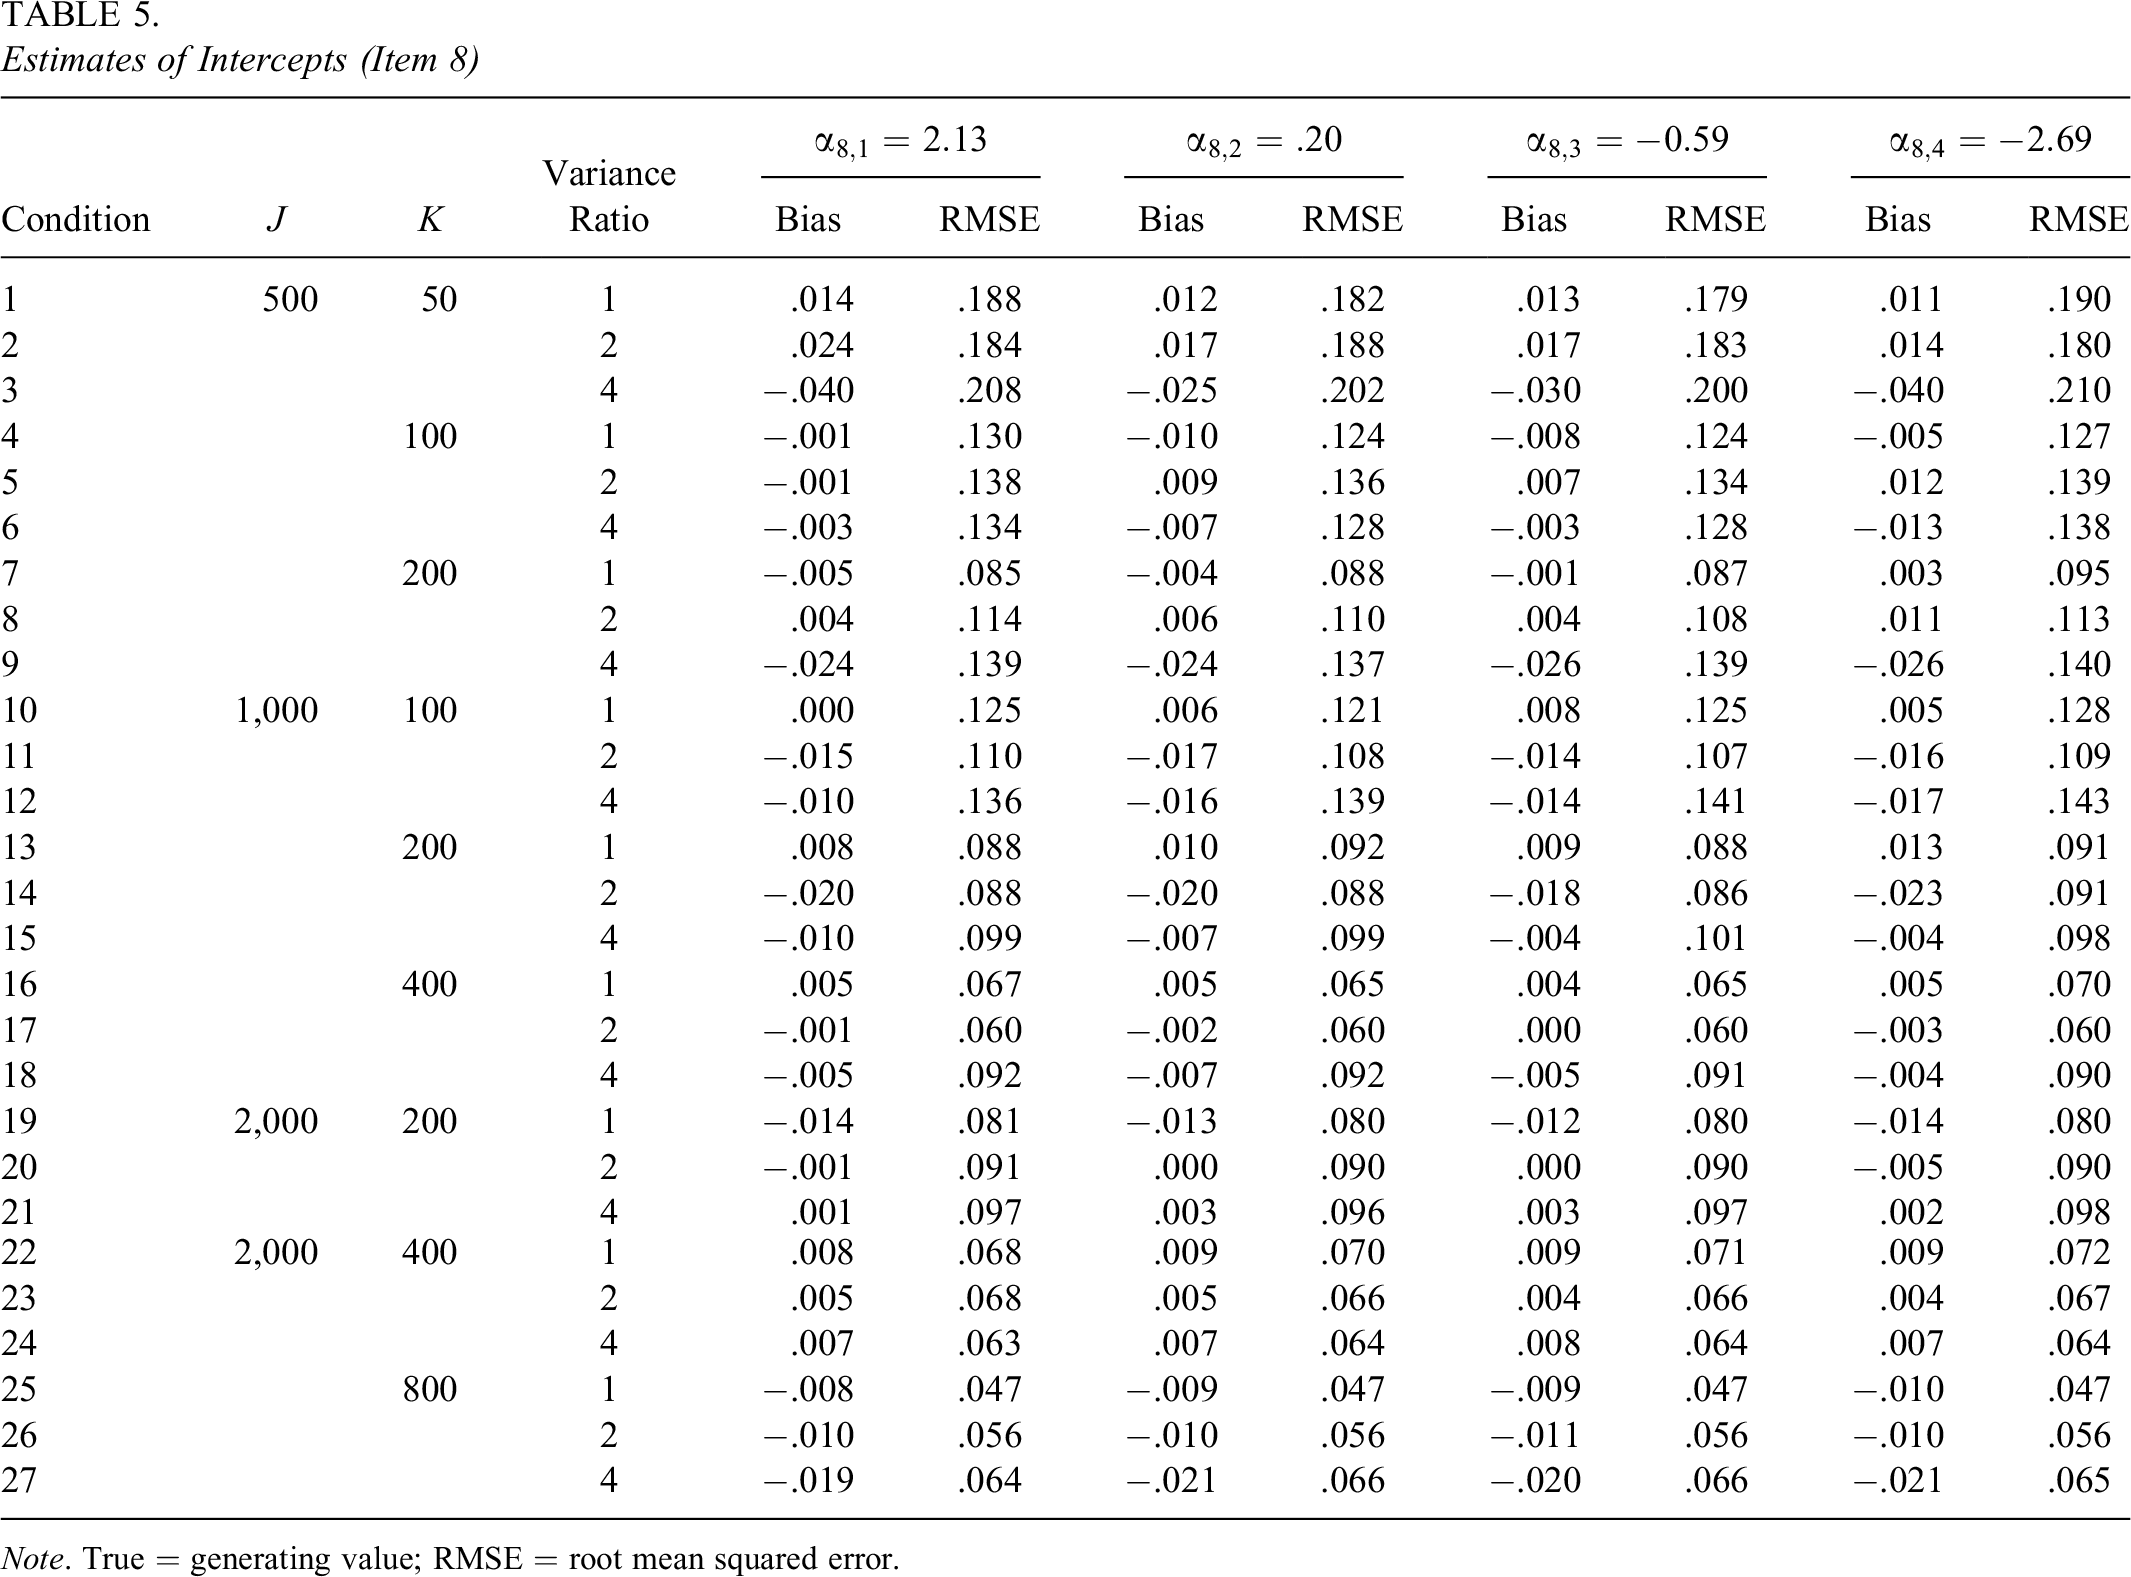
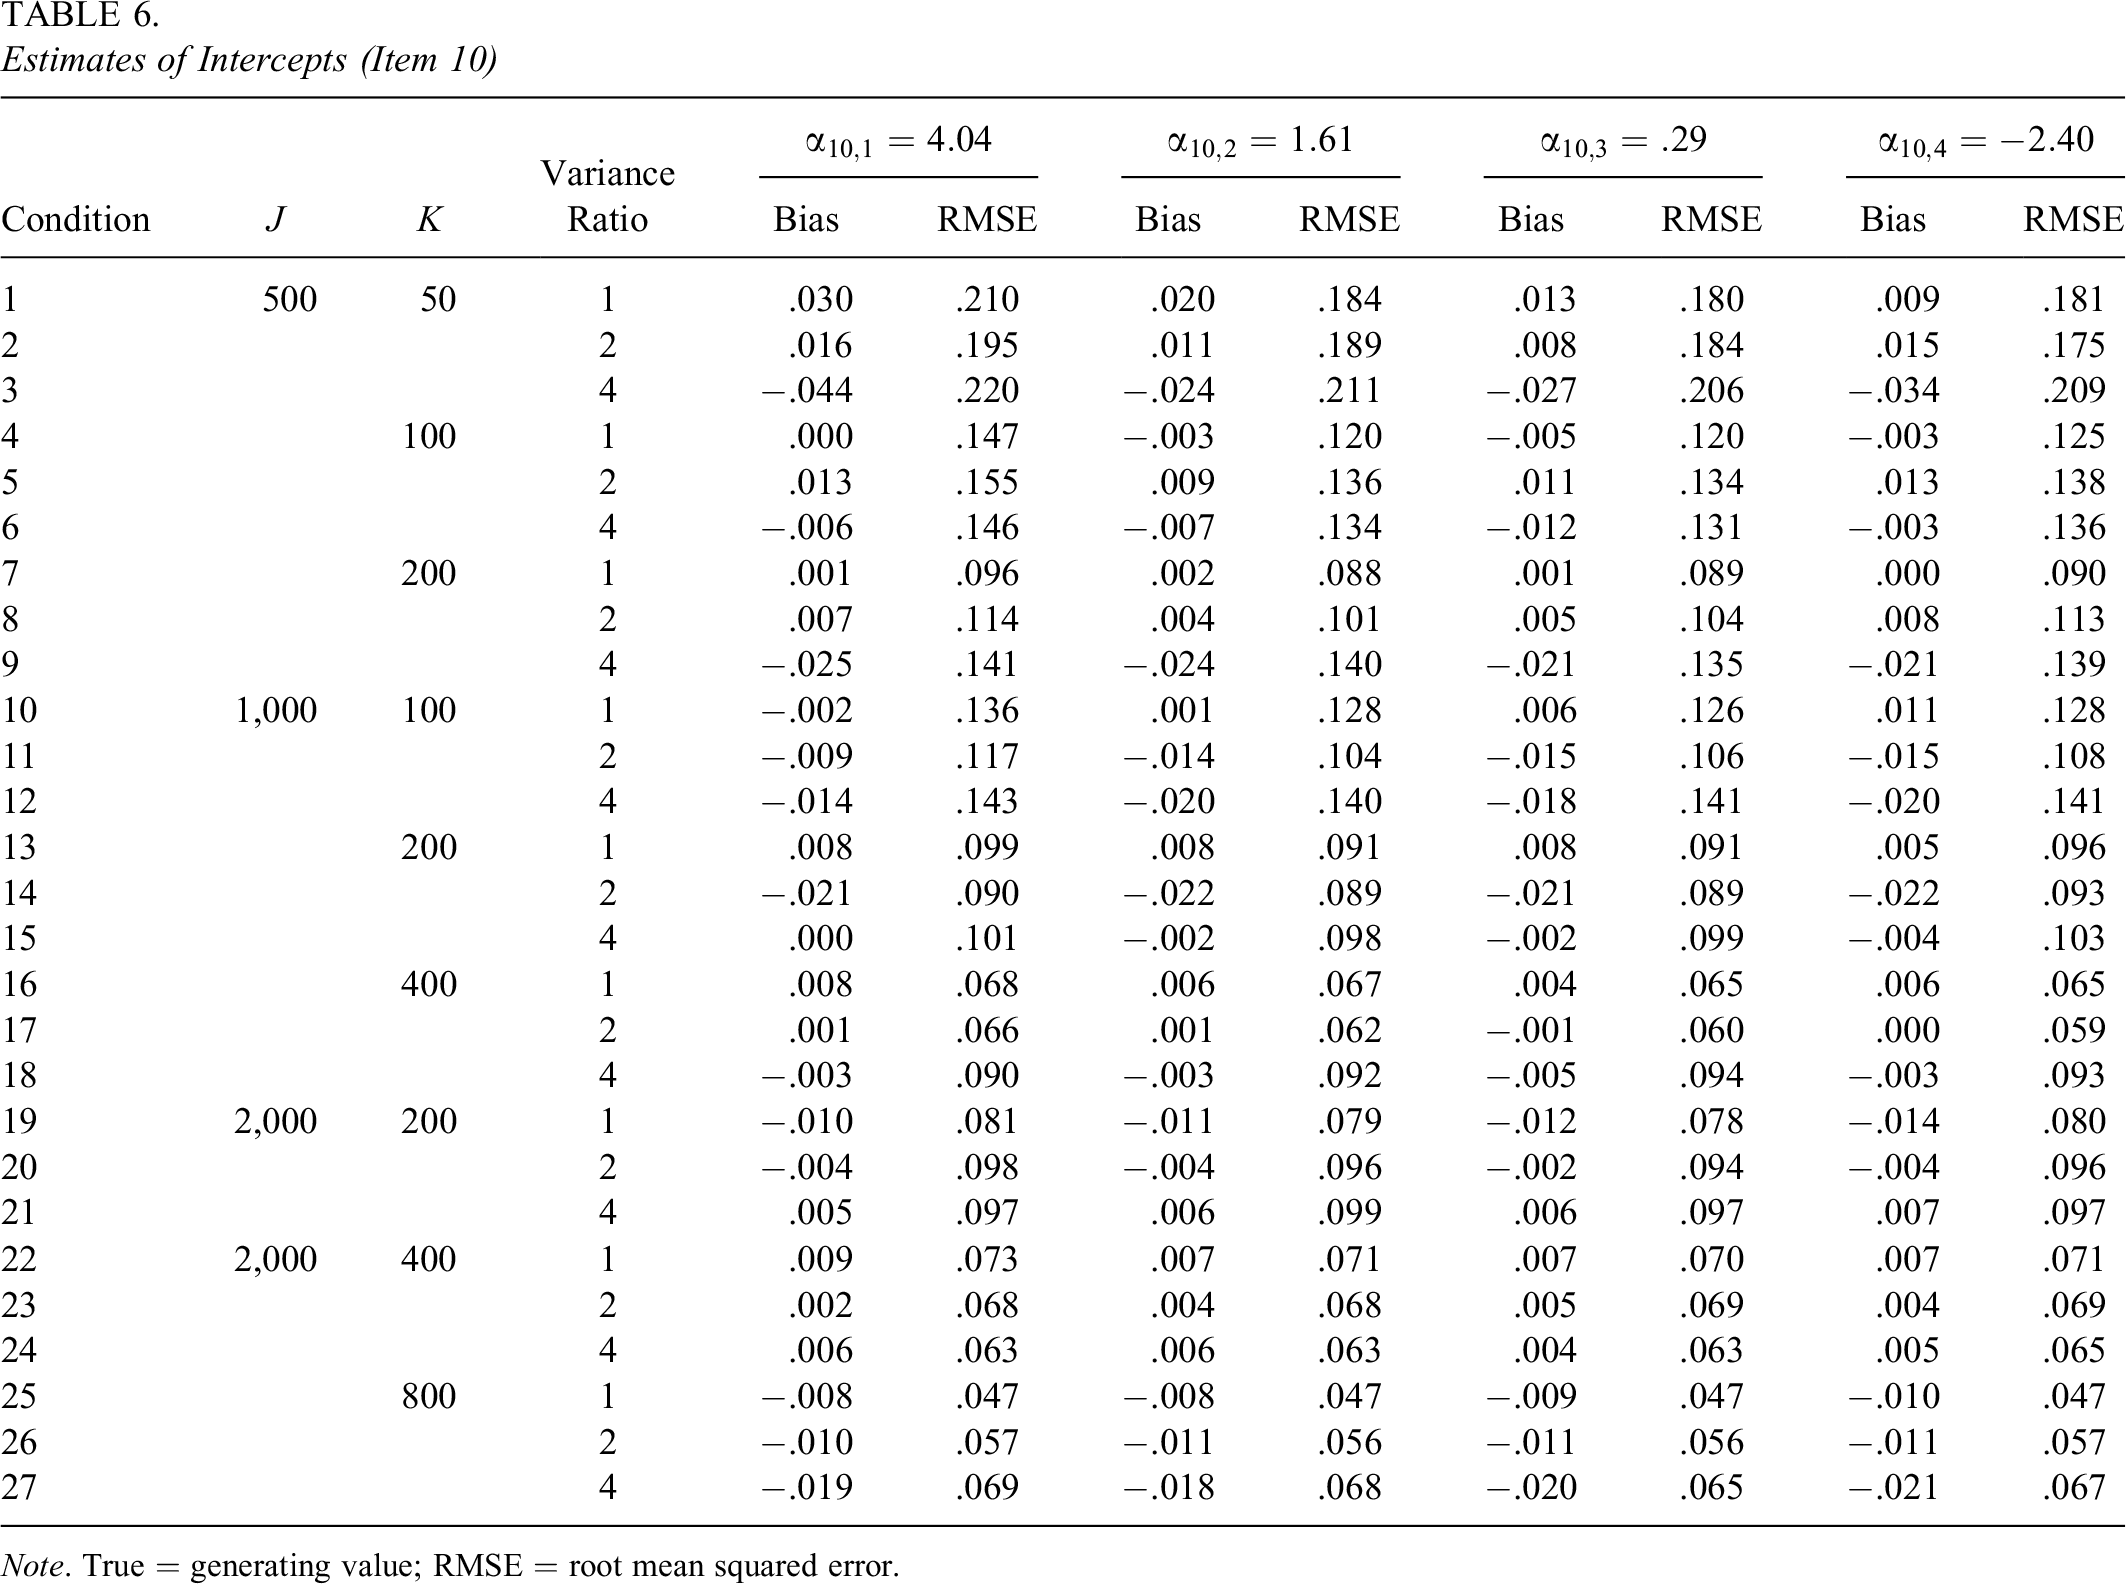
The biases and RMSEs of intercepts of the 10 items exhibited similar patterns; therefore, in the interest of brevity, the results of two items (Items 8 and 10) are presented in Tables 5 and 6. The biases and RMSEs of intercepts of the two items were similar in magnitude. For example, when
The intercepts were well recovered. For instance, the bias of intercept 1 of Item 8 (
Estimates of Intercepts (Item 8)
Note. True = generating value; RMSE = root mean squared error.
Estimates of Intercepts (Item 10)
Note. True = generating value; RMSE = root mean squared error.
Table 7 summarizes the true values, biases, and RMSEs of the regression coefficients that correspond to the column-side and row-side covariates. The bias of the column-side regression coefficient
The bias of the column-side regression coefficient
Estimates of Regression Coefficients
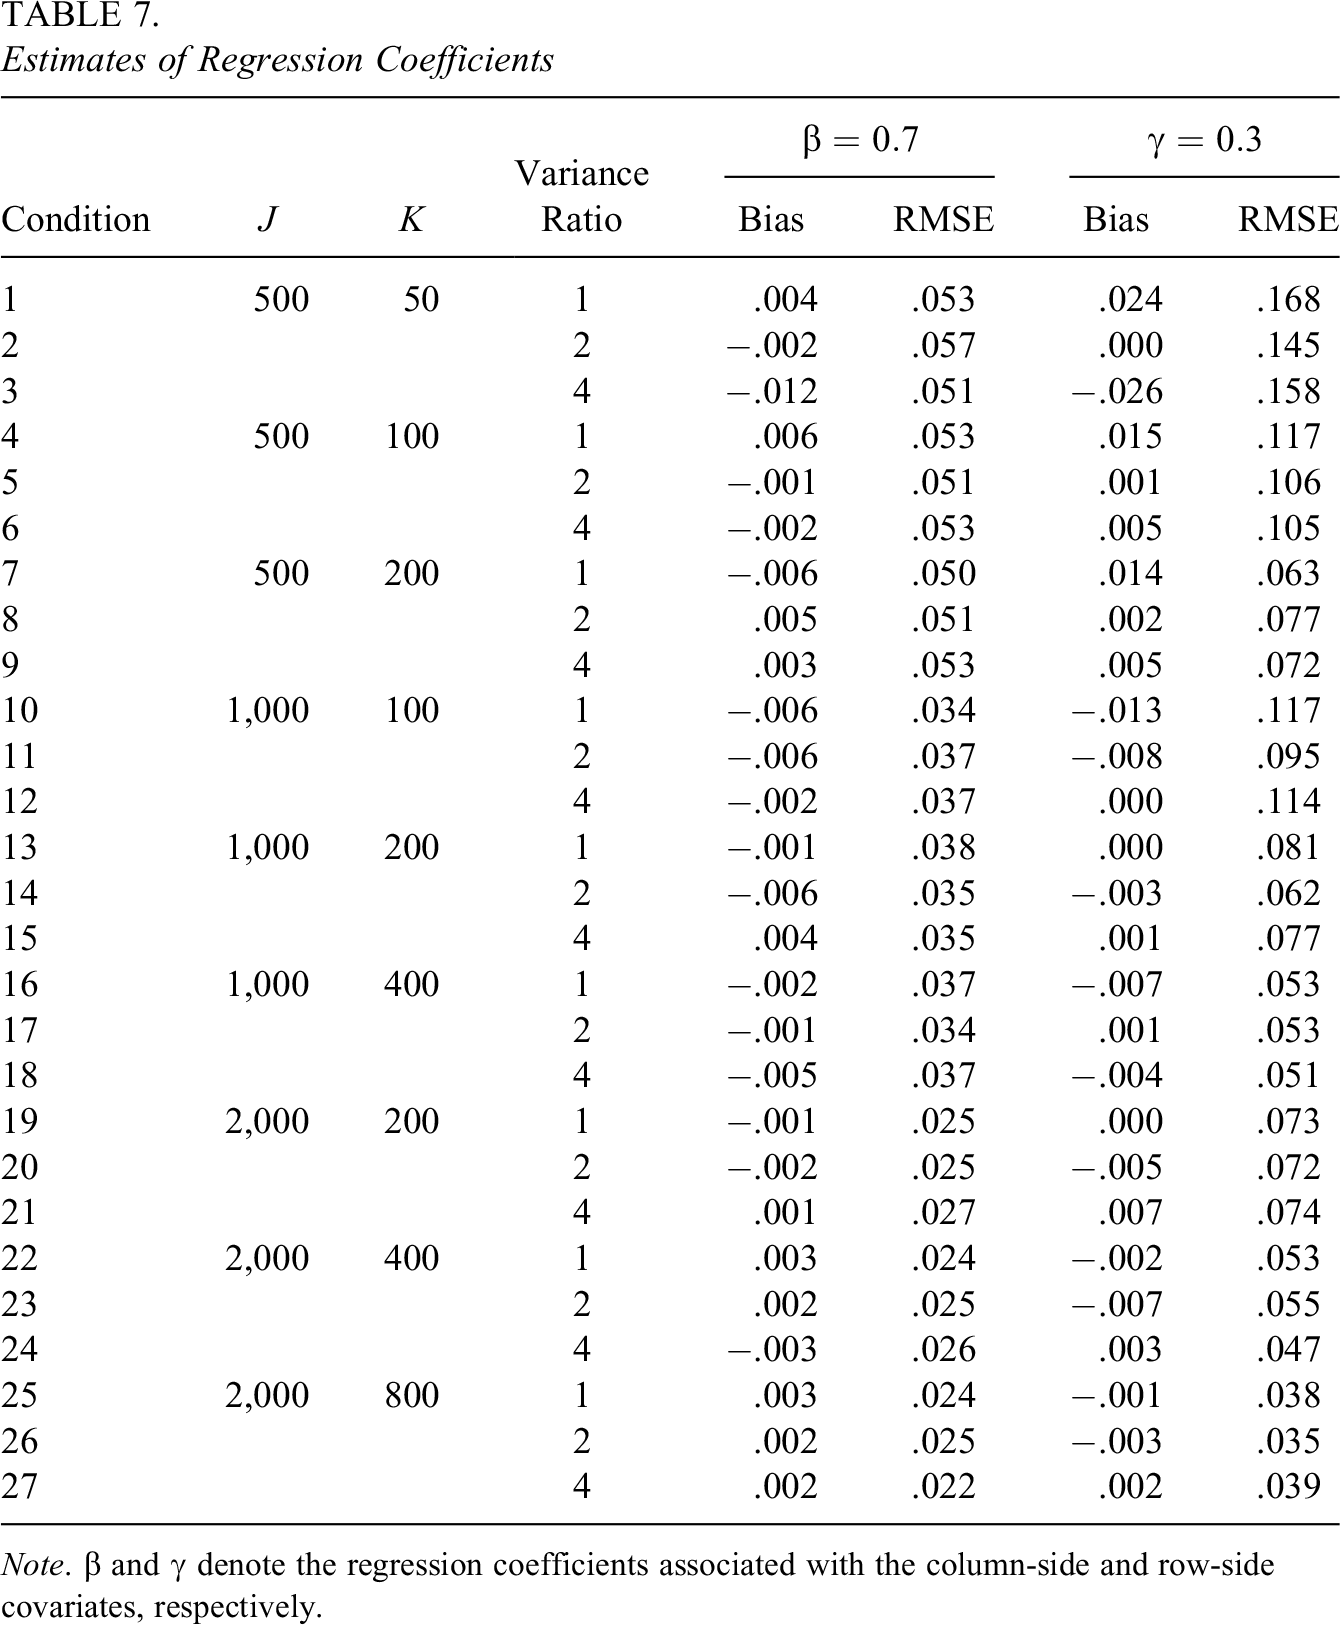
Note.
5. Empirical Demonstration
The proposed cross-classified IRT model and the associated estimation algorithm were applied to SET data collected at a large public university in the academic year 2018–2019.
5.1. Sample and Measure
The analysis presented here focused on a seven-item subscale from the survey that aims to measure instructors’ teaching as related to diversity (e.g., “The diversity of my classmates enriched my learning in this course”). Each of the seven items has a five-point rating scale from 1 to 5 regarding to what extent students agree with the statement (i.e., 1 = strongly disagree, 2 = disagree, 3 = neutral, 4 = agree, 5 = strongly agree). In addition to the item responses, demographic information of students, instructors, and courses were available. The demographic variables included student gender, student URM status, student first generation status, instructor gender, instructor URM status, and instructor rank.
Data cleaning and stratified sampling based on demographics (e.g., instructor gender and student URM status) were performed on the original data in order to prevent the parameter estimates from being dominated by large subgroups. The final sample used for the analysis included 19,429 evaluations to 814 instructors completed by 6,462 students. The evaluations were cross-classified by instructors and students.
5.2. Research Questions and Analysis
The research question survey developers at the higher education institution would like to address was that how student-related covariates, such as student gender and URM status, and instructor-related covariates, such as instructor gender and URM status, impact students’ perceptions of the instructors’ teaching as related to diversity.
To answer this research question, the proposed cross-classified IRT model was applied. Specifically, the latent structural model was specified as


where
For identification purpose, the variances of the latent variables
5.3. Results
The estimates of item parameters are summarized in Table 8. The estimates of the slopes that correspond to
Item Parameter Estimates and Standard Errors (SEs)
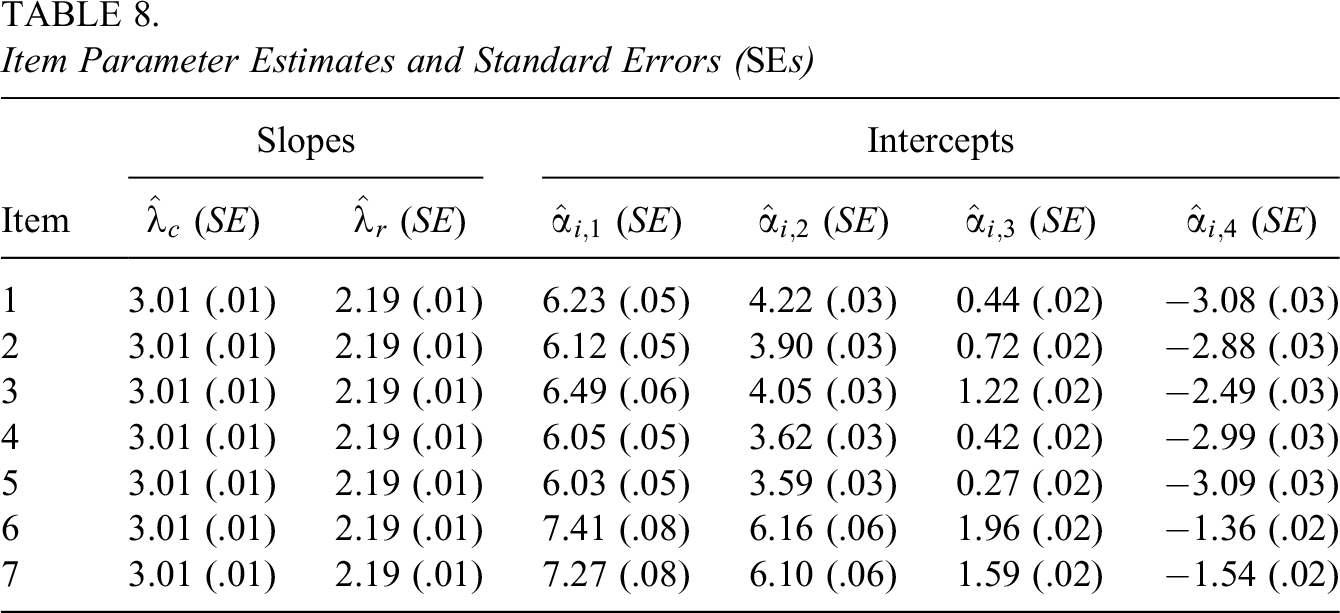
The recursively approximation method was applied to obtain the SEs. The SEs associated with estimates of the slopes were relatively small (which were all 0.01). This is because the slopes were constrained to be equal across items and responses to all items contribute to these two estimates. The SEs associated with the first intercept of the seven items
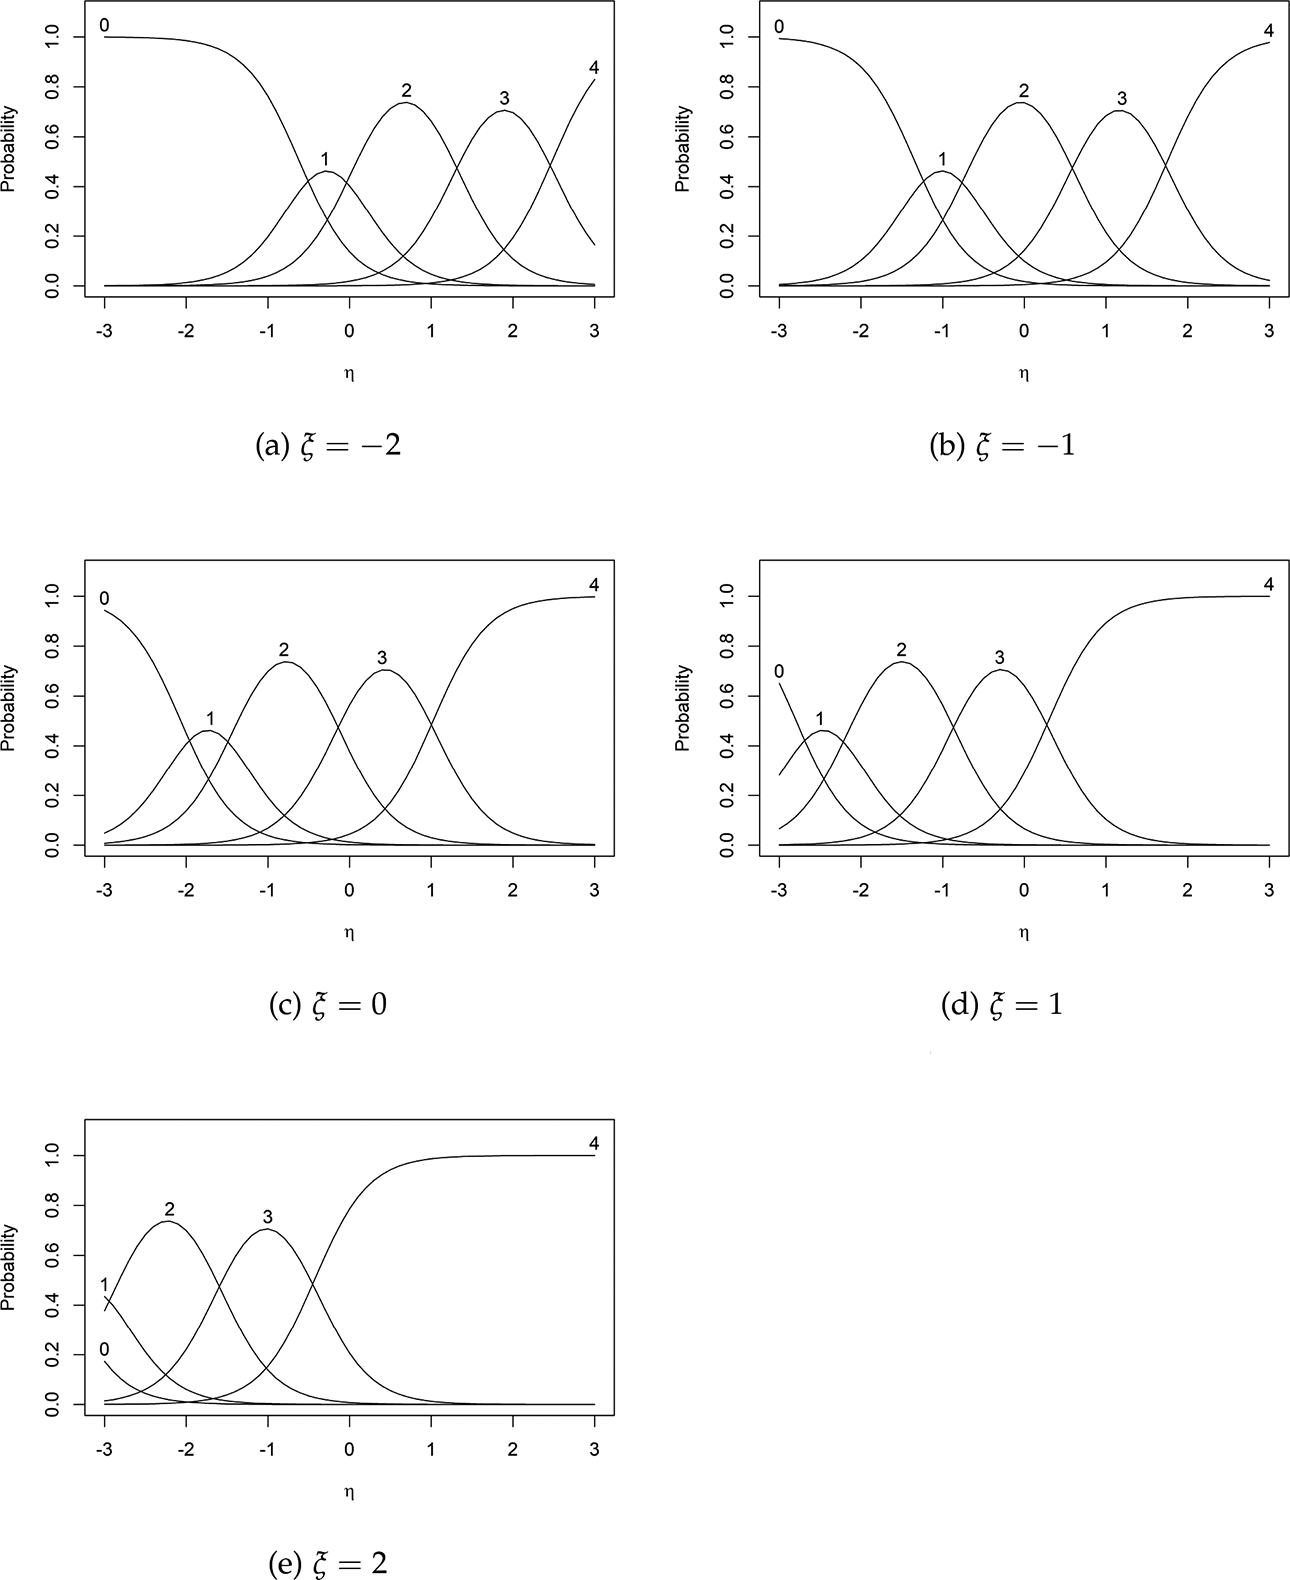
Item characteristic curves of Item 1 at different levels of
The estimates of regression coefficients and the associated SEs were
6. Discussion
6.1. Research Summary
In this study, we developed a cross-classified IRT model that properly handles item-level data with cross-classified structure, which are prevalent in social and behavioral sciences. The proposed model consists of two components: (a) a latent structural model and (b) a measurement model. The latent structural model specifies the relationships between observed covariates and latent variables associated with the crossed factors in the data. The measurement model describes the influence of latent variables on observed item responses through standard IRT models, such as 2PL model and GRM. For illustration purpose, the model presented in this article considered two crossed factors. The full generalization of the proposed model can be easily extended to incorporate more than two crossed factors.
We introduced a new variant of the MH-RM algorithm (Cai, 2008, 2010a, 2010b) to find the MLEs of parameters in the proposed cross-classified IRT model. Specifically, an imputation scheme that couples the Metropolis-within-Gibbs algorithm (Patz & Junker, 1999a, 1999b) with the AIP algorithm (Cho & Rabe-Hesketh, 2011; Chung & Cai, 2021; Clayton & Rasbash, 1999) was applied in the stochastic imputation step of the MH-RM algorithm. With this imputation strategy, latent variables associated with different crossed factors are sampled in alternation using the Metropolis-within-Gibbs sampler. The proposed estimation algorithm does not require the data to be fully crossed and can accommodate empty cells in the data matrix (i.e., missingness).
A simulation study was conducted to evaluate the performance of the new variant of the MH-RM algorithm under various conditions. Simulation results indicated that model parameters can be well recovered with the estimation scheme in all conditions considered in the present study. To demonstrate the proposed approach, a constrained version of the proposed model along with the estimation method was applied to SET data collected at a large public university. The model parameter estimates allowed answering questions that are of substantive interest. It is recommended that researchers fit different models (e.g., different measurement models or different covariates) and compare the results before drawing conclusions.
6.2. Future Directions
The lack of an approach for appropriately handling SET data is one of the major motivations of this study. Therefore, the proposed cross-classified IRT model is available to higher education researchers for better data analytic practice and improved outcomes. Compared with existing approaches, such as the CCREM approach, the model proposed in this study is more coherent since the cross-classified structure and psychometric properties of items are considered simultaneously and more information are provided. The cross-classified IRT model is also more flexible in the sense that additional latent variables can be easily incorporated. In addition, since the item-level data with cross-classified structure are ubiquitous in education and allied disciplines, where multidimensional measurement instruments are commonly applied. The proposed model can be broadly applied in these areas to address a variety of research questions. These research questions include but are not limited to questions regarding item properties, the reliability and validity of assessment instruments, and impacts of key covariates.
To the best of our knowledge, there is scant research that evaluates the consequences of misspecifying the cross-classified structure when the outcome is multivariate and categorical. To improve the higher education practice, more investigations are needed to compare the proposed cross-classified IRT model with existing approaches for analyzing SET data, including the CCREM, standard IRT models, and multilevel IRT models. For example, the proposed approach should be compared with the CCREM approach, which overlooks differences in item properties. Estimates of item parameters obtained through the proposed model also need to be compared with the estimates obtained with standard IRT models, which ignore the cross-classified structure. In addition to model parameter estimates, it is worth studying if the misspecifications would result in biased estimates of individual scores. For example, in the context of SET studies, the scores of instructors are of interest as these scores may be used for administrative and evaluative purposes. The instructor scores obtained with the proposed model can be compared with scores obtained with other approaches to improve institutional effectiveness.
The results of simulations in the present study indicate that the MH-RM algorithm is a promising algorithm for estimating multilevel latent variables with crossed random effects. To further evaluate the usefulness of the MH-RM algorithm and to provide guidelines on data collection design, simulations that consider different measurement models (e.g., 2PL model) and a wider range of conditions, especially the more general cases with multidimensional latent variables and multiple covariates, are desired. Conditions with unbalanced unit sizes should also be studied extensively, as in the SET and K–12 settings, the numbers of units of crossed factors could be very different (e.g., Lei et al., 2018; Murphy & Beretvas, 2015).
Another issue that has not been fully addressed in the present study is the missingness of data. As discussed, data that are fully crossed (e.g., all students evaluate all instructors) are rare in practice. Thus, it is of great importance to evaluate the impact of the mechanism, proportion, and pattern of missing data on parameter estimates and inferences. Results of these simulations, such as the minimum proportion of nonmissing data required to obtain accurate regression coefficients and precise individual scores, could inform future data collection design.
The present study focused on model building and parameter estimation. Future research should extend the proposed cross-classified IRT model so that additional, routine procedures could be conducted. These analyses include dimensionality assessment, differential item functioning analysis, and model fit assessment. This study considered GRM for polytomous items and 2PL model (as a constrained case of GRM) for dichotomous items. Measurement models other than GRM and 2PL model, such as nominal response model (Bock, 1972) and 3PL model, should also be explored.
Footnotes
Declaration of Conflicting Interests
The author(s) declared no potential conflicts of interest with respect to the research, authorship, and/or publication of this article.
Funding
The author(s) received no financial support for the research, authorship, and/or publication of this article.