
Abstract
Pairwise comparison is becoming increasingly popular as a holistic measurement method in education. Unfortunately, many comparisons are required for reliable measurement. To reduce the number of required comparisons, we developed an adaptive selection algorithm (ASA) that selects the most informative comparisons while taking the uncertainty of the object parameters into account. The results of the simulation study showed that, given the number of comparisons, the ASA resulted in smaller standard errors of object parameter estimates than a random selection algorithm that served as a benchmark. Rank order accuracy and reliability were similar for the two algorithms. Because the scale separation reliability (SSR) may overestimate the benchmark reliability when the ASA is used, caution is required when interpreting the SSR.
Pairwise comparison is a method that allows measurement of an attribute by means of comparison of objects with respect to the attribute in pairs. Models for pairwise comparison data are used to obtain a scale for the objects with respect to the attribute. The method was first introduced by Thurstone (1927). Objects may be anything such as sports teams or product brands (see Cattelan, 2012, for an overview of applications outside education), but in educational measurement, objects are mostly students’ responses to an assignment or an examination. The assignment or the examination is used to measure an attribute of the students, and the students’ responses give an indication of their attribute level. For example, to create a rank order of students with respect to creative thinking skills, primary school teachers compare students’ responses to a creative thinking assignment with each other and rate which of two students showed the highest level of creative thinking. Because people perform pairwise comparisons routinely on a daily basis, for example, when deciding to eat a salad or a burger for lunch, pairwise comparison is highly intuitive and provides a natural task for people to perform. Laming (2004) even argued that every decision we make is based on comparative judgment. The advantage of using an everyday process in an assessment task is that people, including raters, are familiar with it, resulting in relatively fast and time-efficient judgment.
In educational measurement, pairwise comparison is becoming an increasingly popular assessment method (Bramley & Vitello, 2018; Lesterhuis, Verhavert, Coertjens, Donche, & De Mayer, 2017). The method has been used in a variety of contexts, ranging from art assignments (Newhouse, 2014) to academic writing (Van Daal, Lesterhuis, Coertjens, Donche, & De Maeyer, 2016) and mathematical problem-solving (Jones & Alcock, 2013). The examples we mentioned are by no means exhaustive (e.g., Bartholomew, Strimel, & Yoshikawa, 2018; Seery, Canthy, & Phelan, 2012; Steedle & Ferrara, 2016) but give an impression of the wide range of contexts where pairwise comparison has been used. These contexts have in common that the attribute of interest cannot easily be divided into smaller attribute aspects that validly cover the total attribute. For example, creativity of an art assignment is more than a summary of aspects of the art assignment, such as use of colors and shapes, and assessing such aspects separately would not add up to an assessment of creativity. For this reason, in these contexts, the attribute of interest is difficult to measure validly using conventional analytic measurement methods such as rubrics or criteria lists (Van Daal et al., 2016). Pairwise comparison is a promising approach for measuring these attributes because evaluation can take place in a holistic manner (i.e., evaluating attributes as a whole; Sadler, 2009). Some authors argue that pairwise comparison should replace conventional analytic assessment methods for all assessments (Pollitt, 2004, 2012) because the method can reduce costs in terms of time, money, or both and may even improve scales’ measurement properties (Bramley & Vitello, 2018; Pollitt, 2012).
Unfortunately, the large number of pairwise comparisons required for reliable measurement counteracts the time-efficiency advantage of making each comparison in a short amount of time. We need a sufficient number of comparisons to estimate the probabilities that the objects are preferred to the other objects accurately. In addition, to avoid capitalization on sample results, the selected comparisons should be a representative sample of all possible comparisons. Although each comparison often takes little time, it is unfeasible to ask of raters or teachers to compare assignments of all students to all other students because a small class of 20 students already provides 190 unique comparisons. The discrepancy of the interests of reliable measurement and low rater burden creates an efficiency–reliability trade-off (Bramley & Vitello, 2018; Lesterhuis et al., 2017), and deciding on the number of comparisons to present to the raters is an important issue with respect to this trade-off. For an elaborate discussion about labor costs and timings, see Steedle and Ferrara (2016).
Making the comparison process adaptive is the most prominent approach to influence the efficiency–reliability trade-off positively (Bramley & Vitello, 2018; Pollitt, 2012). Adaptive pairwise comparison entails that the objects that are presented to the rater are selected to provide optimal information about the rank order of the objects. Which objects are selected is determined based on the information obtained in previous comparisons. The approach has similarities with computerized adaptive testing (e.g., see Van der Linden & Glas, 2010; Wainer et al., 2000), in which each next item is selected based on the estimated ability of a test taker as measured using the items administered thus far. Using adaptive pair selection, the same reliability should be achieved using fewer comparisons than using the common random pair selection. The challenge is efficiently selecting object pairs to be compared while the estimates of the object parameters still have relatively large standard errors. Unfortunately, current algorithms, for example, the Swiss method and the adaptive method discussed in Pollitt (2012) and a combination of the two (Pollitt, 2015; Rangel-Smith & Lynch, 2018), do not sufficiently take the uncertainty of the object parameters into account. Consequently, the algorithms may inflate the scale separation reliability (SSR) coefficient (Bramley, 2015; Bramley & Vitello, 2018), which is the ratio of the estimated true variance of the object parameters and the observed variance of the object parameter estimates, thereby overestimating reliability. As a result, the reliability may be overestimated, but Rangel-Smith and Lynch (2018) claim that the SSR inflation is mitigated when their adaptation of the adaptive algorithm is used with a sufficiently large number of comparisons.
In this study, we developed an adaptive selection algorithm (ASA) that takes the uncertainty of the object parameters into account when selecting the next object pair. We conducted a simulation study to investigate the performance of the algorithm and compared it with the performance of a random selection algorithm. The performance of the selection algorithms was evaluated by means of the uncertainty of the object parameters, the rank order accuracy, and the reliability. In general, we expected that the ASA would perform better than the random selection algorithm on all three evaluation criteria: lower uncertainty of the object parameters, higher rank order accuracy, and higher reliability. We varied the number of objects to be compared and the proportion of the total number of unique comparisons.
This article is organized as follows. First, we discuss the ASA algorithm in more detail. Second, we describe the steps of the parameter estimation procedure. Third, we describe the simulation study, and fourth, we discuss the results. Fifth, we discuss some exploratory analyses, and we end with a discussion.
ASA
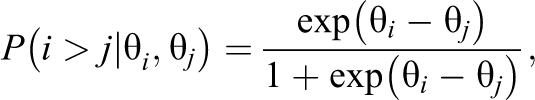
The goal of the ASA is to select in each step the most informative pair of objects for the rater to compare given the results of previous comparisons. More specifically, the object of which the parameter estimate has the largest standard error is selected, so the next comparison provides information about the parameter about which we are most uncertain. This object is compared with an object of which the parameter has a high probability to be close to the parameter of the selected object on the latent variable scale. This selection procedure not only provides most information, but it also creates a connected network of comparisons as quickly as possible. We are most uncertain about objects that were not compared before, they are closest to other objects that were not compared before (in the middle of the scale), and subsequently the groups of comparisons are linked via comparison of two previously preferred objects or two previously nonpreferred objects. The algorithm is constrained to let all unique comparisons occur only once to prevent undesirable dependencies that may arise between comparisons of the same pair of objects. This restriction corresponds formally with a single rater that performed all comparisons. We elaborate on this choice in the discussion.
The algorithm is an iterative process using the following steps. First, the object parameter estimates based on the Bradley–Terry–Luce (BTL) model (Bradley & Terry, 1952; Luce, 1959) were computed using the data collected up to this point. Let N be the number of objects, and let i and j (
where
Parameter Estimation
The object parameters were estimated using maximum likelihood (ML). To be able to obtain parameter estimates of objects that are preferred in all comparisons or objects that are preferred in none of the comparisons, that is, objects with perfect scores or zero scores, respectively, 0.01 prior observation was added to each possible outcome of each possible comparison between two different objects. This small addition of data has an almost negligible impact on the parameter estimates, and the impact decreases even further when the number of performed comparisons increases.
Let ni
be the total number of comparisons including object i, xi
be the number of comparisons in which object i is preferred,
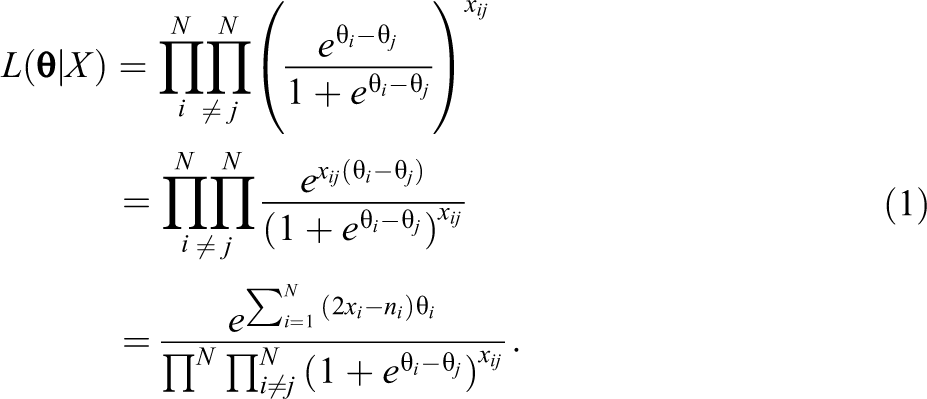
It may be noted that the whole fraction is raised to the power
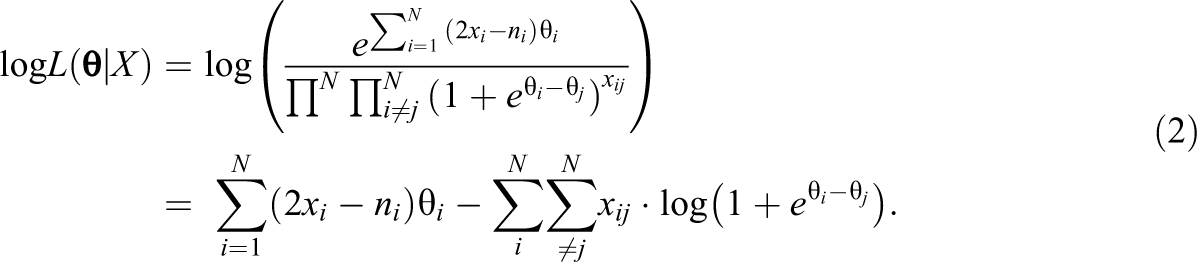
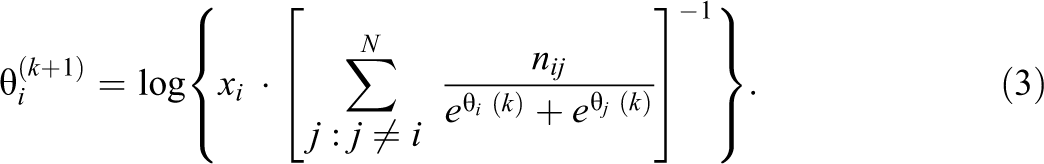
The log likelihood was optimized following a minorization–maximization algorithm that belongs to the subset of expectation–maximization algorithms (Hunter, 2004). Let
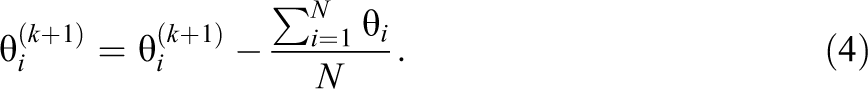
To identify the model, if the resulting vector
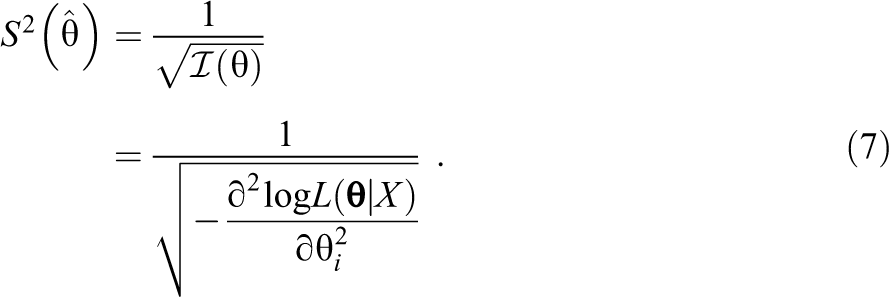
The standard errors corresponding to the ML estimates of the object parameters were computed as the inverse of the observed Fisher information
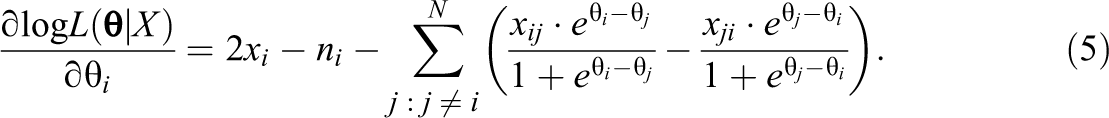
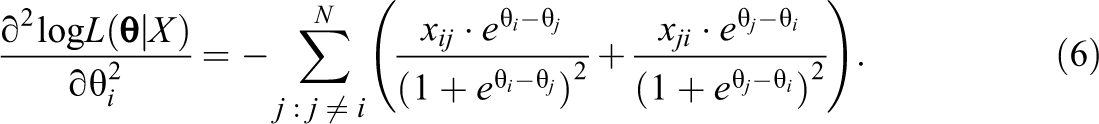
Second, we derived the second partial derivative of the log likelihood to
The standard errors of the object parameter estimates can then be computed as
The ML estimates and the standard errors of the object parameter estimates were used in the ASA.
Method
Simulation Study
We used R (Version 3.3.1) for this study (R Core Team, 2018). The R code for data simulation, both confirmatory and exploratory analyses, visualization of results, and deciding on the number of repetitions can be found in the Supplementary Material in the online version of the article. The BTL model was used for both data simulation and data analysis.
First, we varied the selection algorithm, using both the ASA and a baseline algorithm to which the results of the newly developed algorithm were compared. In the baseline algorithm, which is the semi-random selection algorithm (SSA), a pair of objects is randomly selected with the constraint that the objects in the pair were not previously compared to each other. After the two selected objects were compared, the outcome was added to the data, and the selection algorithm was repeated until the predefined stopping criterion was reached. As the final step, the object parameter estimates and the corresponding standard errors were computed.
Second, we varied the number of objects N. We used N equal to 20, 25, 30, and 100 objects. These numbers represent three possible numbers of students in a class and one possible number of students in the same year of a school. We focused on these (small) sample sizes, which correspond with applications of pairwise comparison set up at a class level or a school level. Obviously, larger scale applications are also possible.
Third, we varied the number of comparisons performed by means of the proportion of the total number of unique comparisons. The total number of unique comparisons equals
For each of the 2 × 4 × 10 (Algorithm × Number of Objects × Proportion of Comparisons) = 80 design cells, we drew N object parameters from the standard normal distribution. We used the conventional standard normal distribution because the ASA can be applied in a wide variety of contexts, and a previous article that reported unbiased distributional properties, resulting from nonadaptive pairwise comparison, reported different standard deviations for different samples (Van Daal et al., 2017), indicating that various standard deviations may be plausible. Because the object parameter estimates have a mean of 0 as a constraint for model identification, we rescaled the object parameters to have a sample mean of 0 as well. Subsequently, the probabilities that the objects are rated higher on the latent variable scale than other objects were computed by inserting their true (simulated) parameters in the BTL model. For example, for the standard normal distribution, an object with a simulated attribute value 1 SD above the mean of all objects will be preferred to an object with a simulated attribute value at the mean with a probability of
In each cell, for each comparison, two objects were selected based on the selection algorithm. The comparison of the two objects was simulated by comparing a uniform random value between 0 and 1 to the probability that object i is preferred to object j. Object i was chosen if the random value was smaller than the probability value, and object j was chosen otherwise. In the conditions involving the ASA, the object parameter estimates and the corresponding standard errors were computed. These steps were repeated until the maximum number of comparisons in the cell was reached. After reaching the maximum number of comparisons, object parameter estimates and standard errors were computed. Lastly, we computed the parameter uncertainty, the accuracy of ordering, and the reliability of the scale. This procedure, starting by drawing N object parameters for all cells, was repeated 400 times per cell. To determine the number of repetitions, we did a small simulation study for the cells with the highest variability of two evaluation criteria, benchmark reliability and Spearman’s rank coefficient. These cells were the combinations of conditions
Evaluation Criteria
Uncertainty of parameters
We evaluated the uncertainty of the parameters using the standard error of the object parameter estimates. We expected that the standard errors were smaller for larger proportions of comparisons, and because the number of unique comparisons grows multiplicatively with the number of objects, expressed by the formula
Accuracy of ordering
The object order based on the object parameter estimates was compared to the object order in the generating model using Spearman’s rank coefficient ρ, which is equal to Pearson’s product–moment correlation between the estimated rank order of the objects and the object rank order in the generating model.
Reliability
We used two measures of reliability. First, we used the squared correlation between the object parameters used in the generating model and the object parameter estimates based on the data, which we refer to as the benchmark reliability. Let θ be the object parameter in the generating model and let
Second, we used the commonly used SSR estimate. Let
where
that is, the observed variance minus an error term (Bramley, 2015).
An increasing proportion of comparisons was expected to increase reliability by decreasing the standard errors of the object parameter estimates. We also expected the reliability to be higher using the ASA rather than using the SSA due to smaller standard errors of the parameter estimates. We expected this difference to be highest for a proportion of comparisons of 0.5 because the two algorithms have most selection degrees of freedom for this proportion of comparisons, at the compromise between the number of comparisons (i.e., opportunities of selection in performed comparisons), and the restriction that the comparisons must be unique (i.e., opportunities of selection in comparisons to be performed).
Results
Confirmatory Analyses
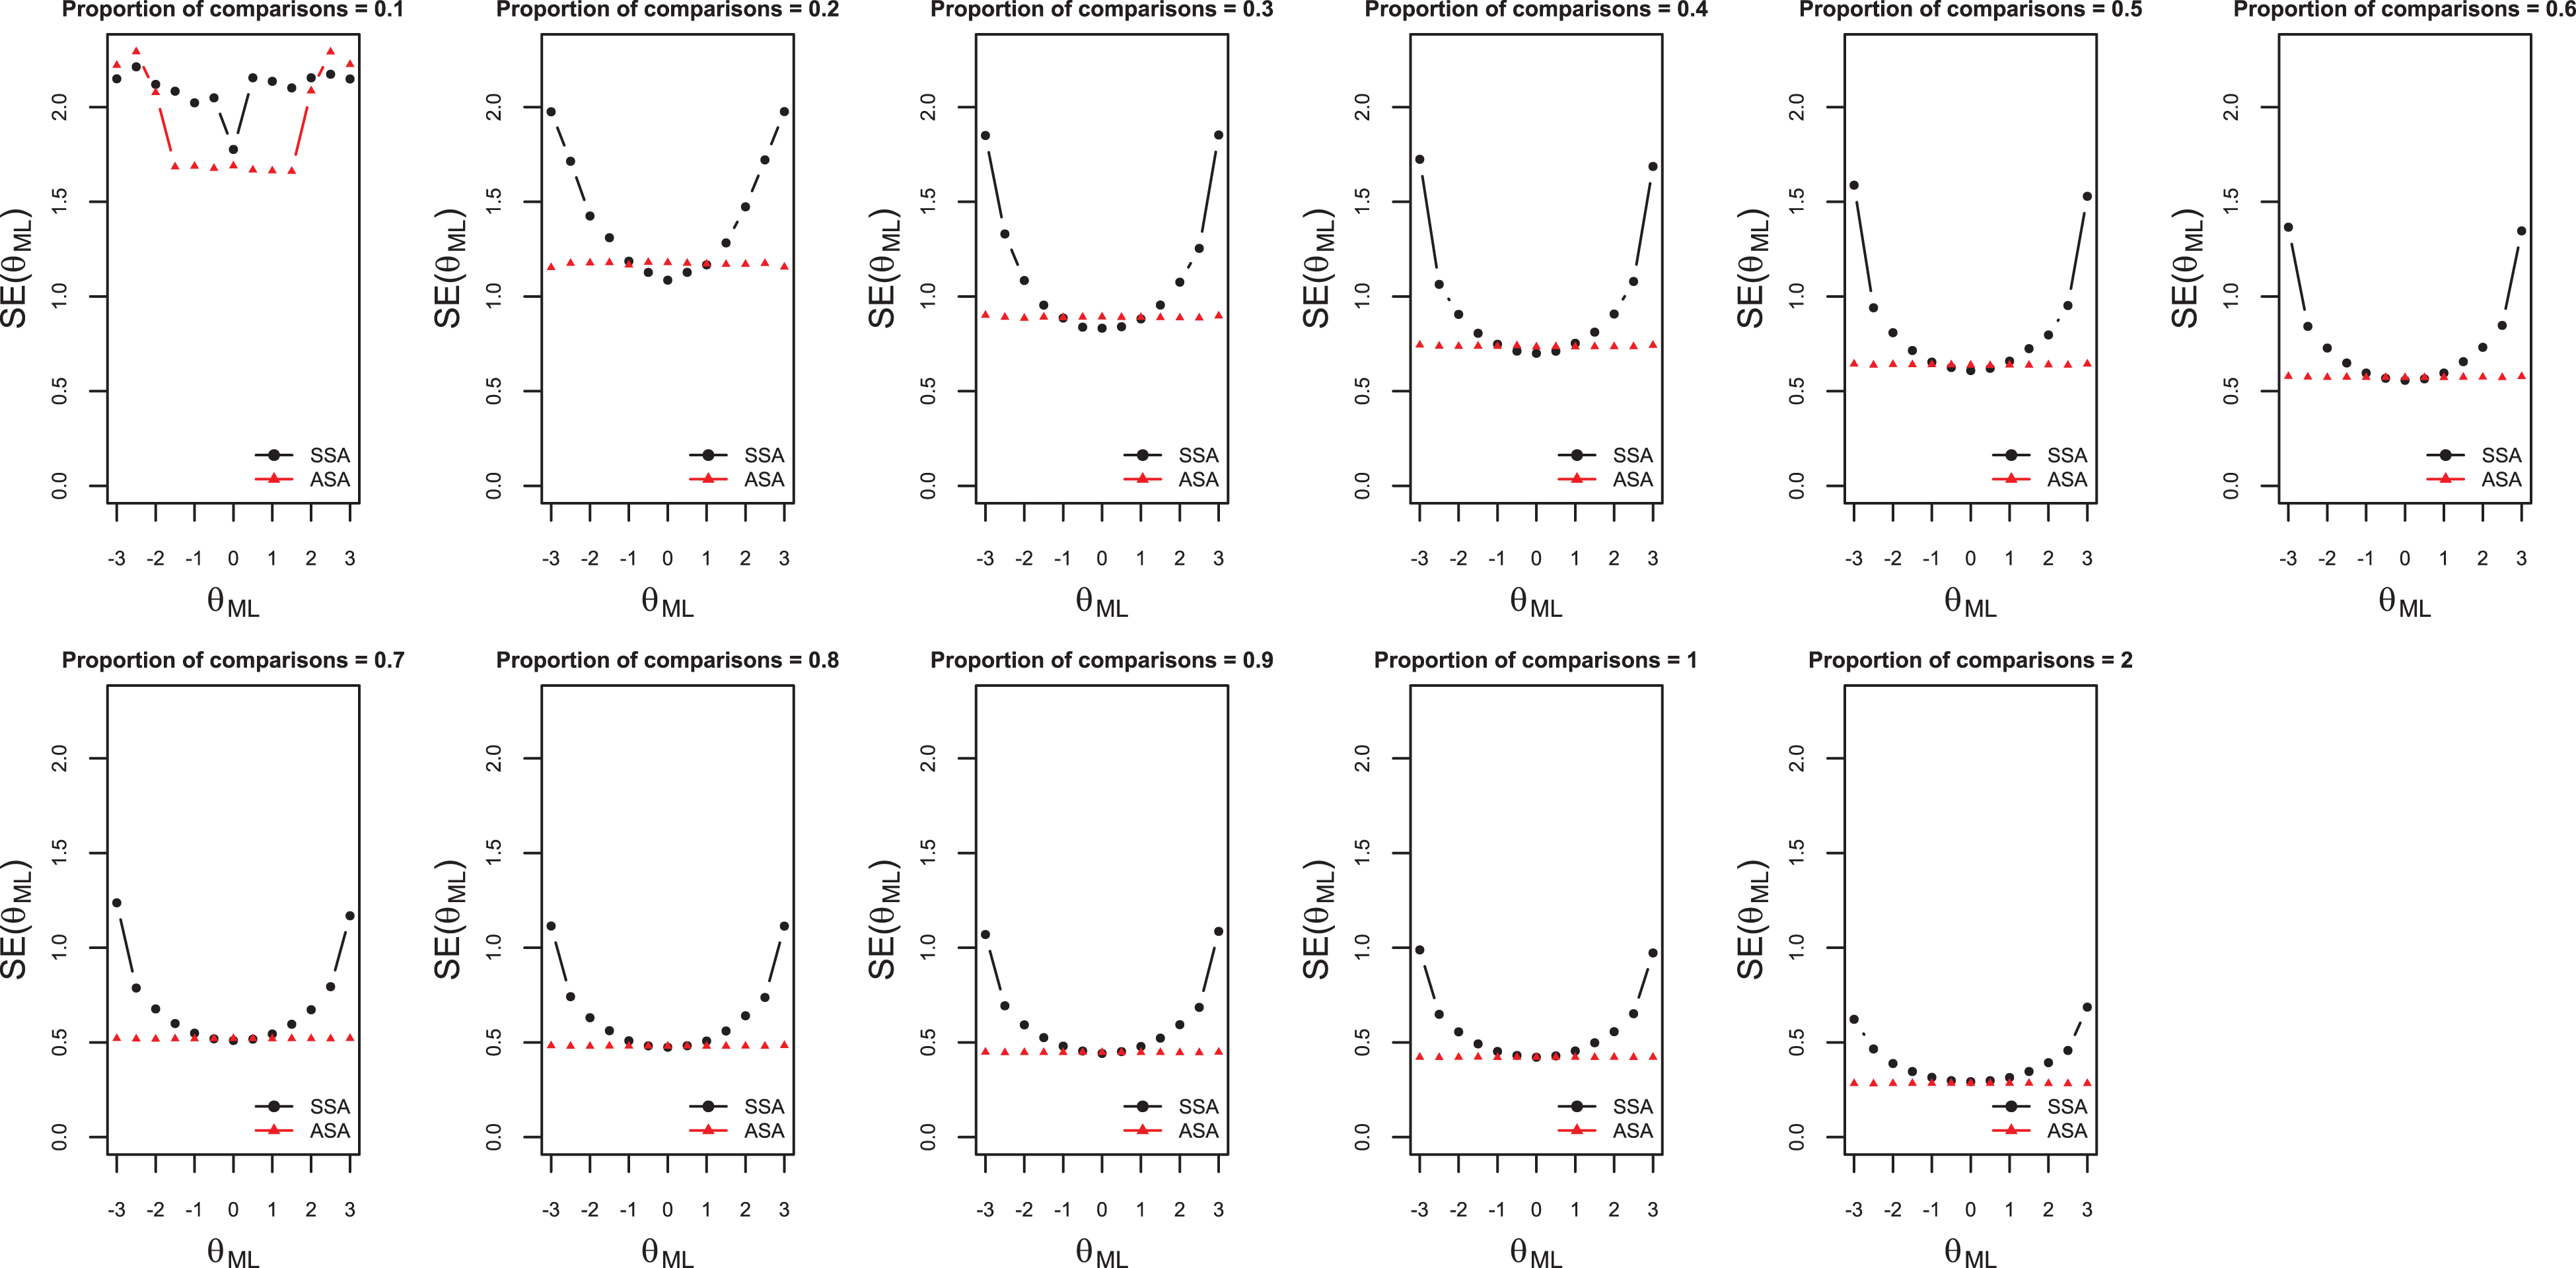
For N = 30, Figure 1 displays means of standard errors (dots) for ML estimates within ranges of 0.5 units of the latent variable scale. The figure shows that, except for proportions of comparisons equal to 0.1 and 1, the standard errors of the object parameter estimates at both ends of the latent variable scale were smaller when the ASA was used than when the SSA was used. Across the panels, it can be seen that the differences of the standard errors between the SSA and ASA decreased for increasing proportions of comparisons. This trend can be explained by the restriction that all unique comparisons could be made only once, which resulted in the algorithms having fewer degrees of freedom to select comparisons as C increased. Compared to the full design (C = 1), the SSA showed larger differences between standard errors found in the middle and the ends of the scale for lower proportions of comparisons, whereas the ASA showed smaller differences in standard errors. In general, for
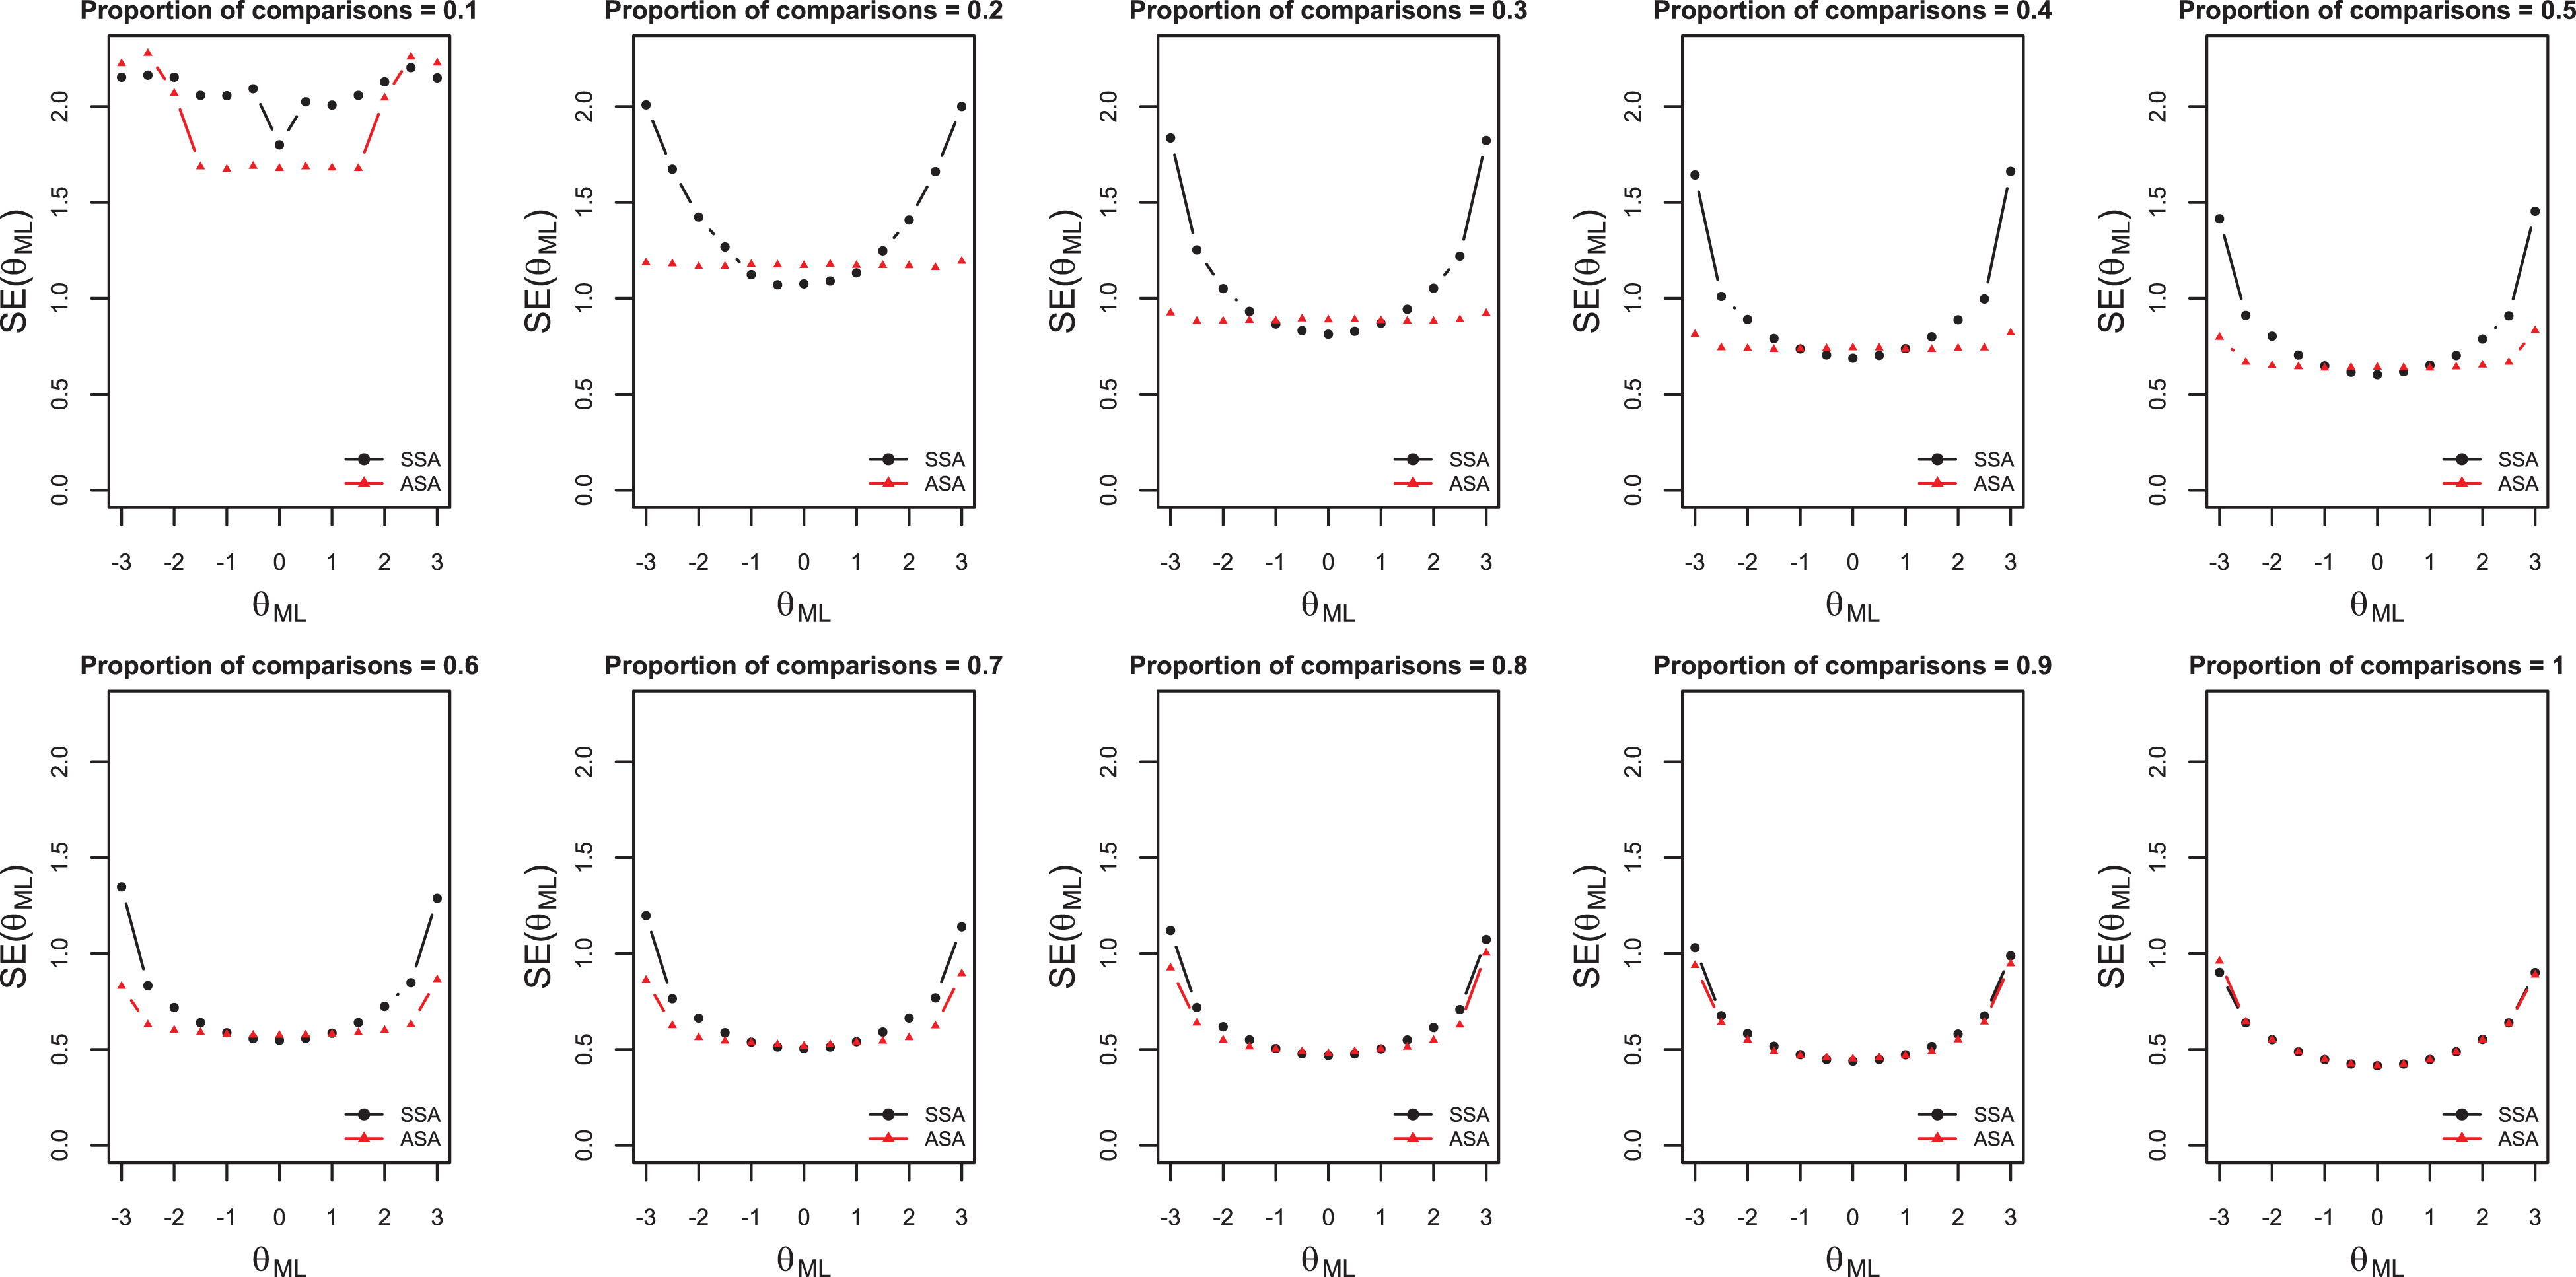
Standard errors of object parameter estimates for both selection algorithms, for N = 30, and for different proportions of comparisons. Means of standard errors (dots) for maximum likelihood estimates within ranges of .5 units of the latent variable scale.
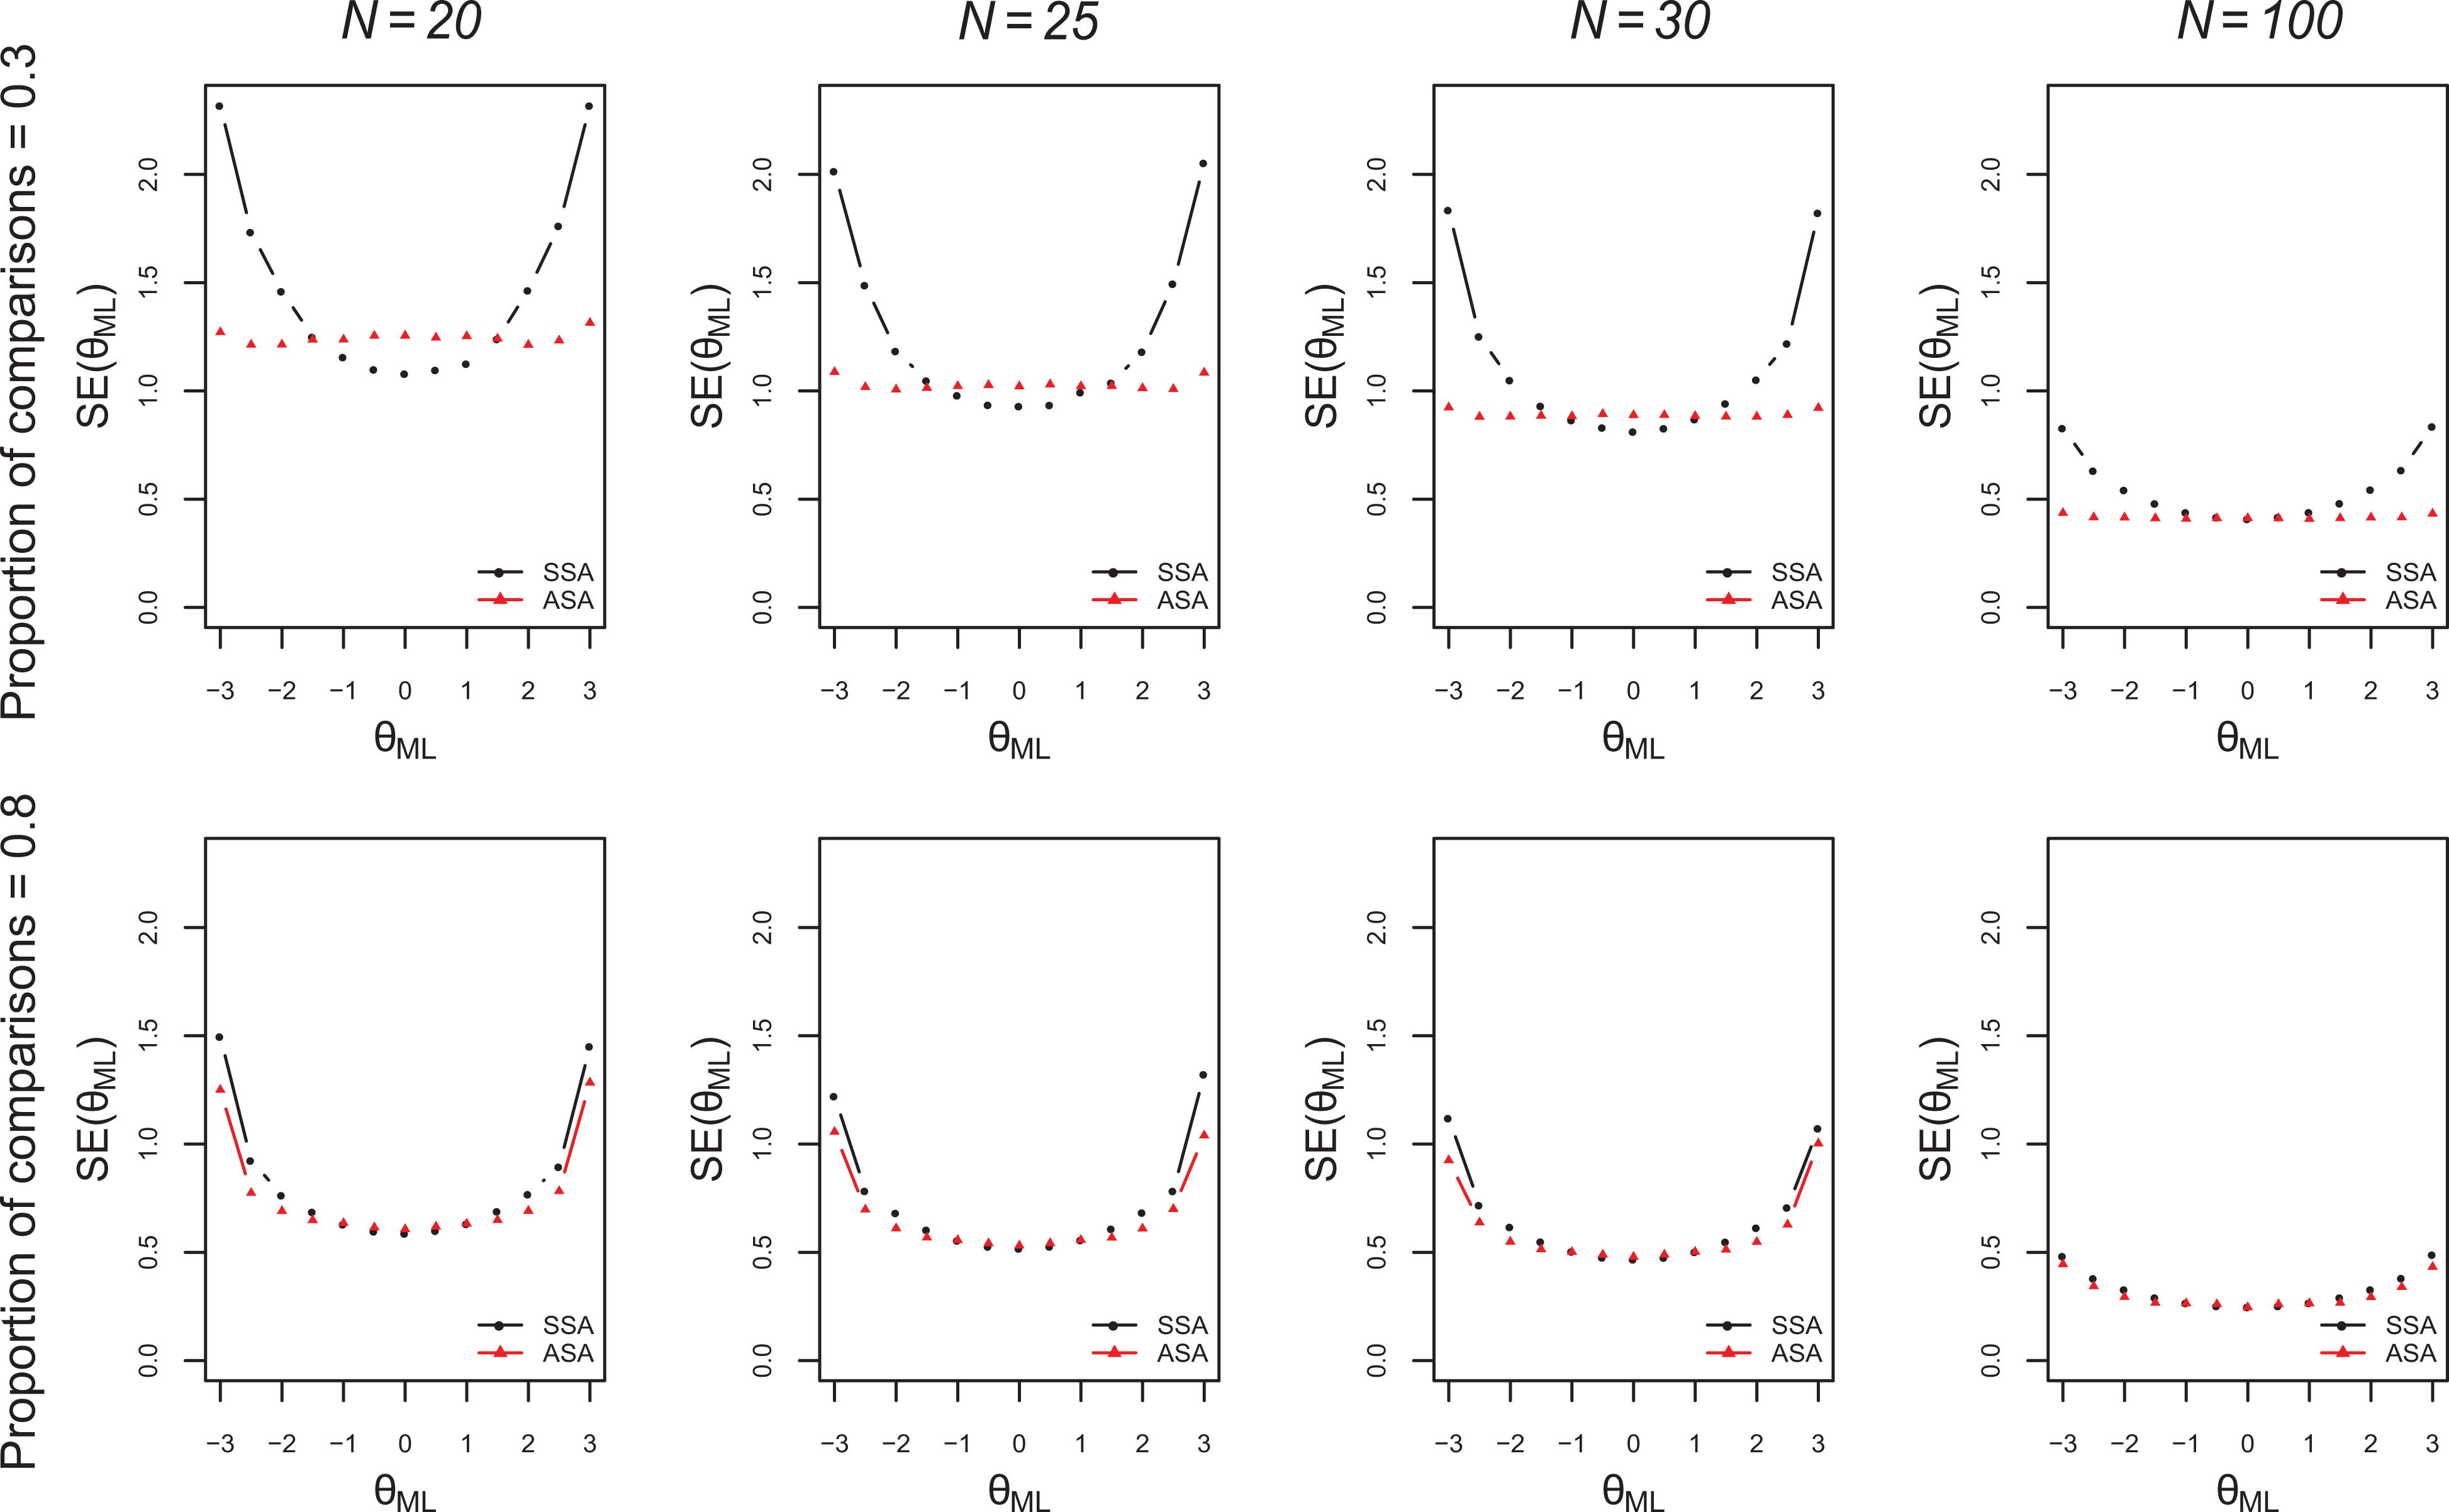
Standard errors of object parameter estimates for both selection algorithms, for different N, and for proportions of comparisons of .3 and .8. Means of standard errors (dots) for maximum likelihood estimates within ranges of .5 units on the latent variable scale.
In Figure 1, the standard errors for
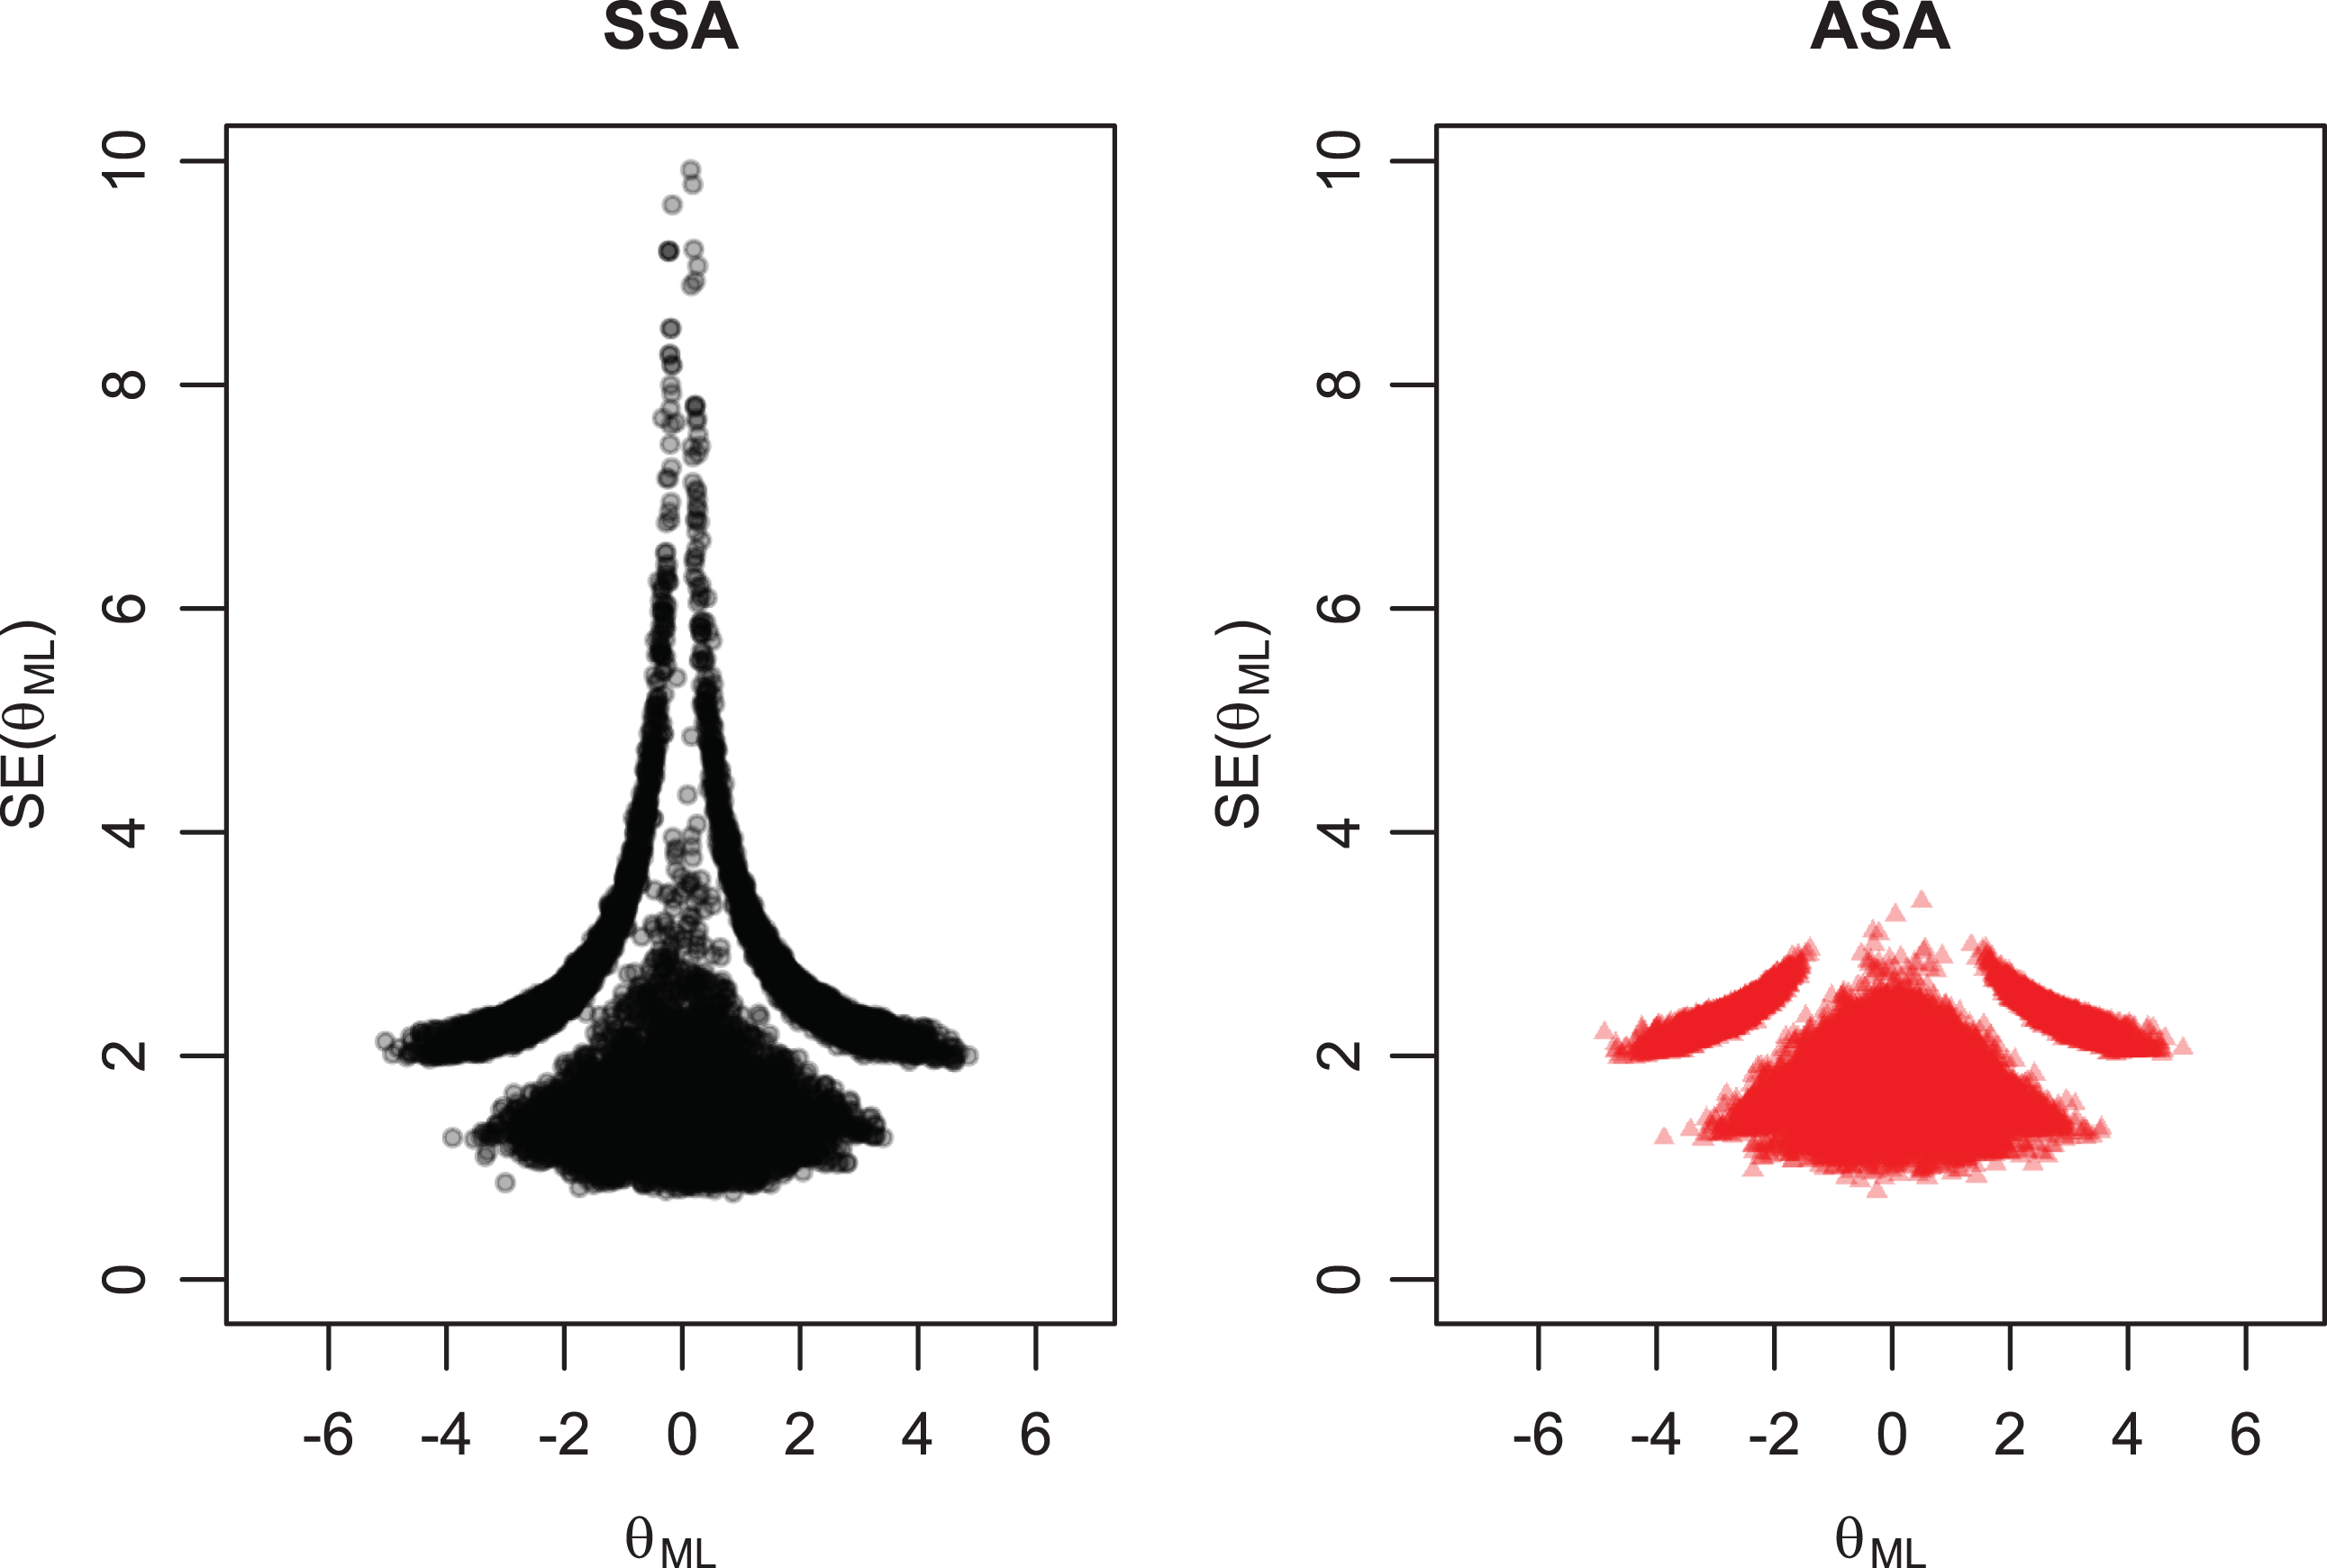
Standard errors of object parameter estimates for both selection algorithms, for N = 30, and for C = 0.1.
Both panels of Figure 4 show that Spearman’s rank correlation was higher as the proportion of comparisons was larger. Similarly, the reduction in rank correlation compared to the full design (
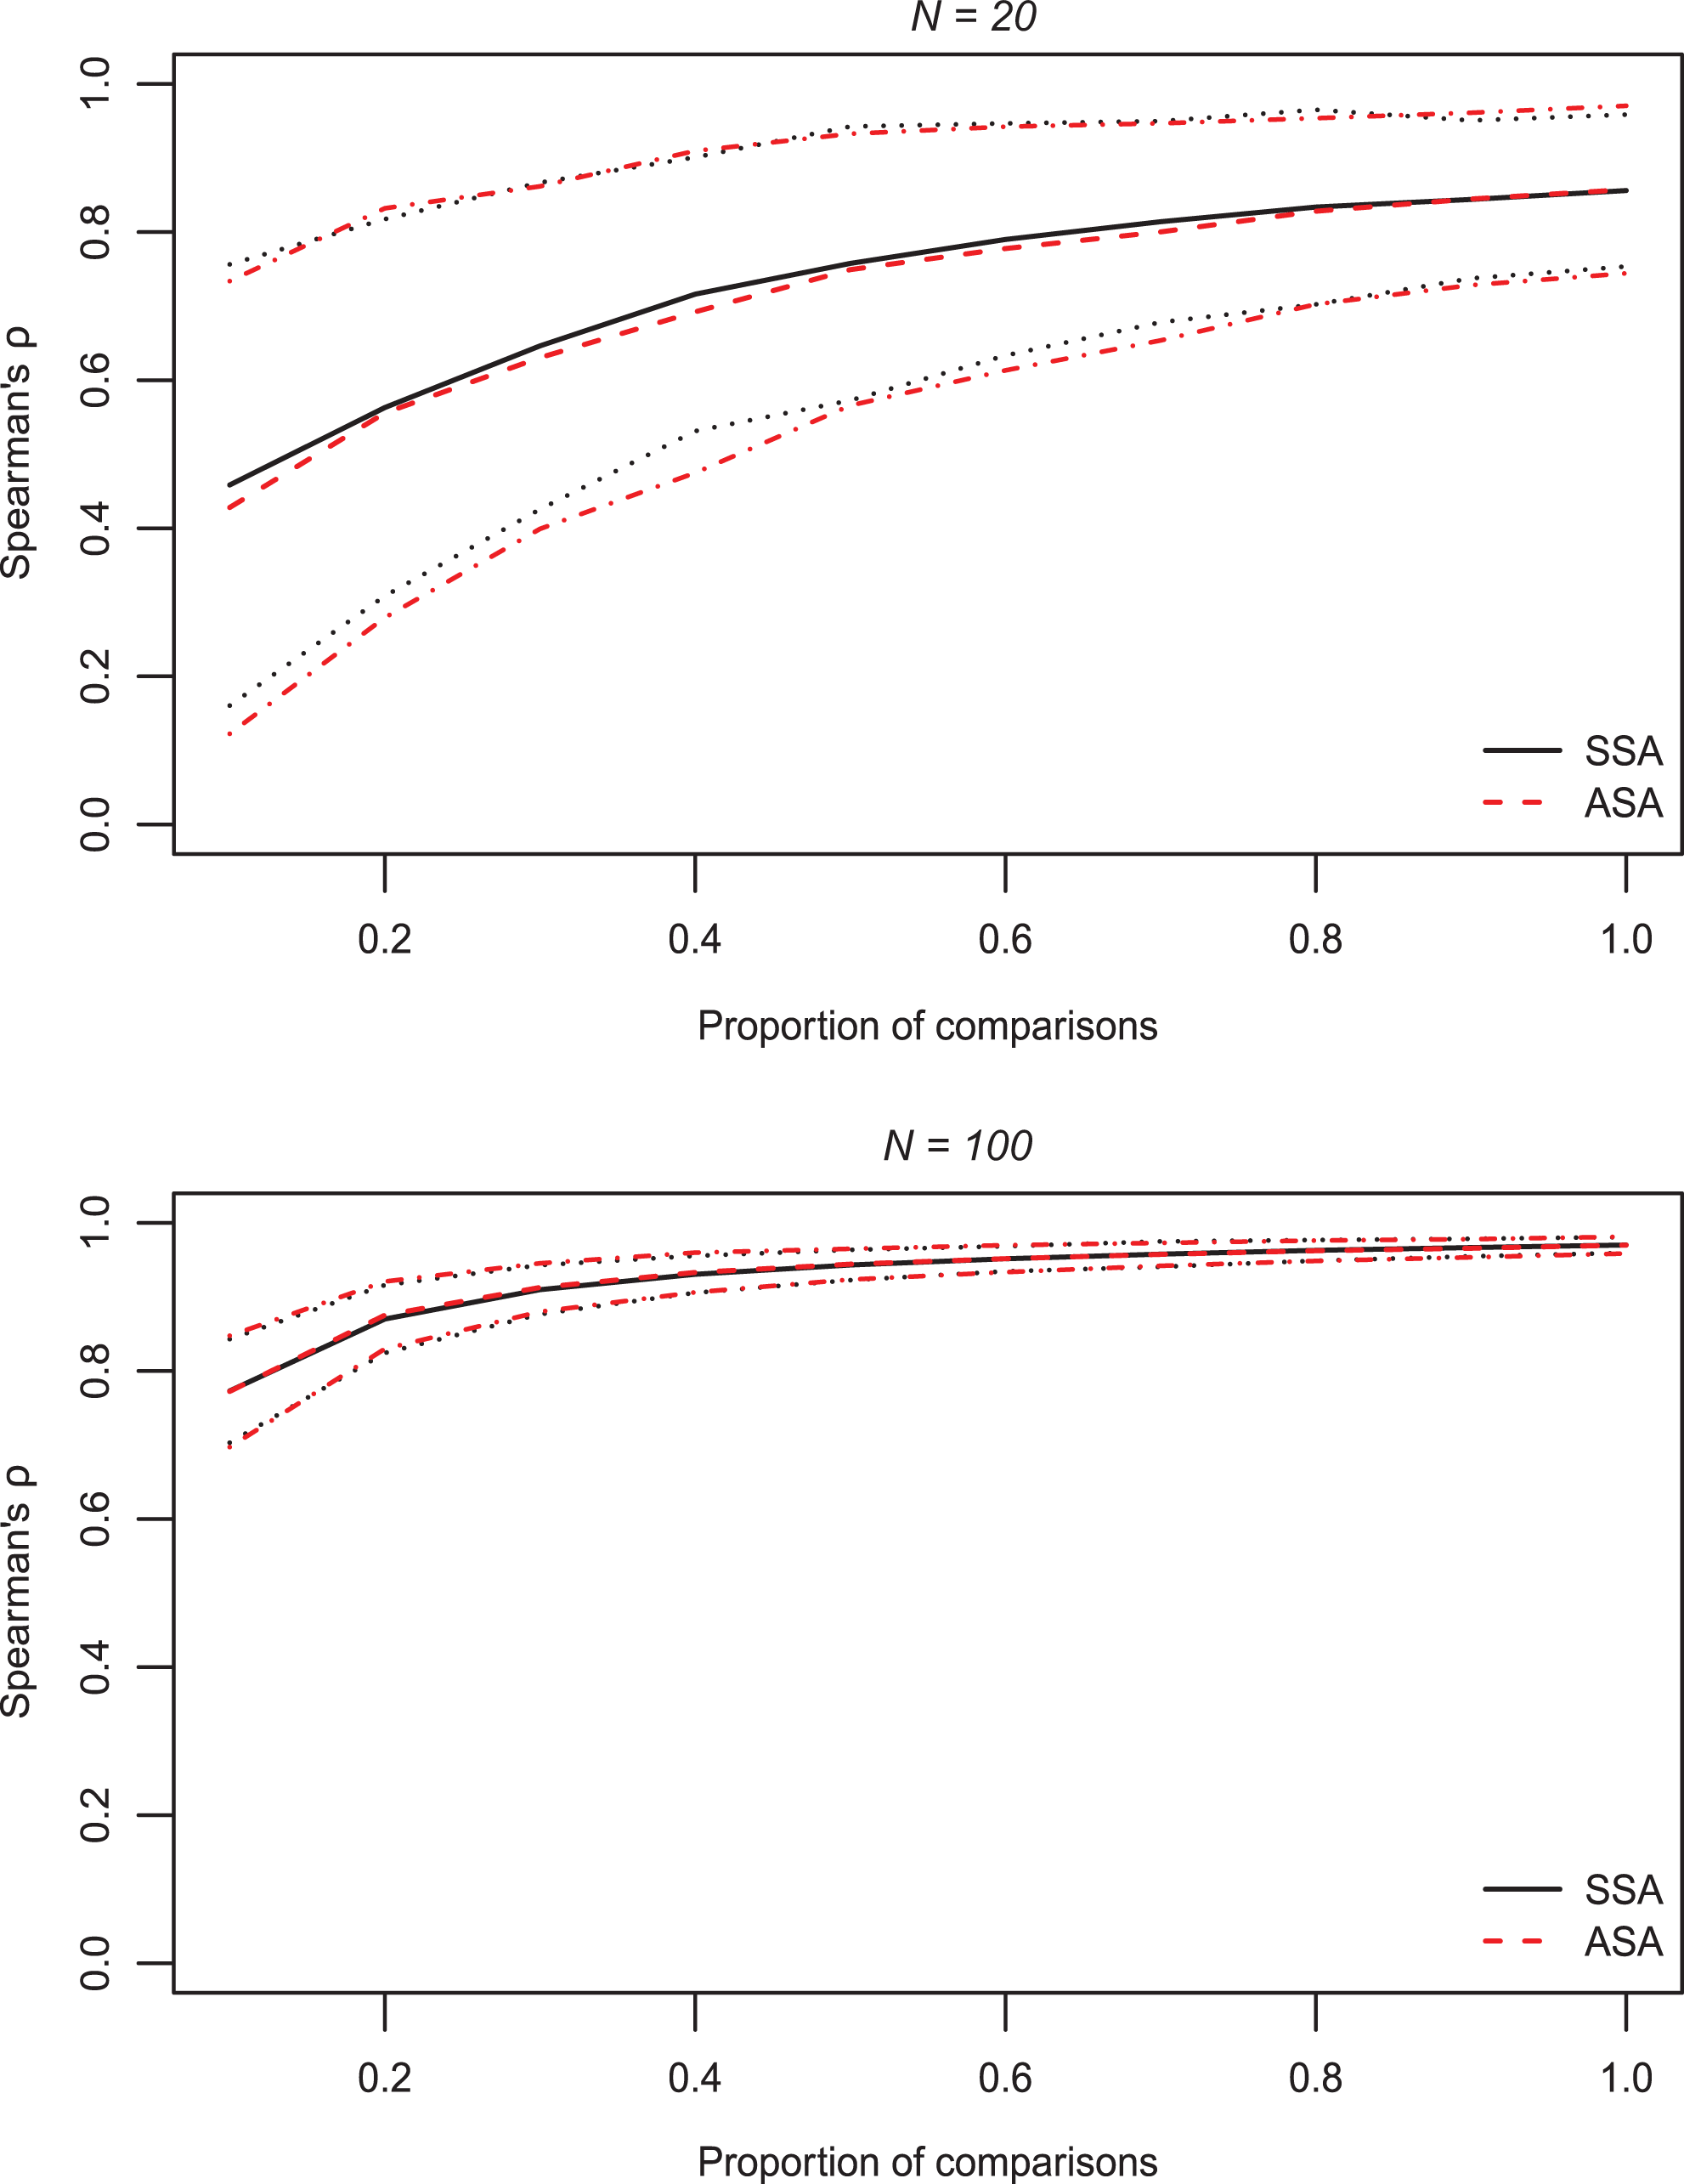
Spearman rank correlation between true and estimated object rank order and 90% confidence interval for different proportions of comparisons.
For benchmark reliability, the same trends as for the rank order accuracy were found. Figure 5 shows that the benchmark reliability increased when proportions of comparisons increased, and the figure shows between panels that benchmark reliability also increased when sample size increased. Compared to the full design (
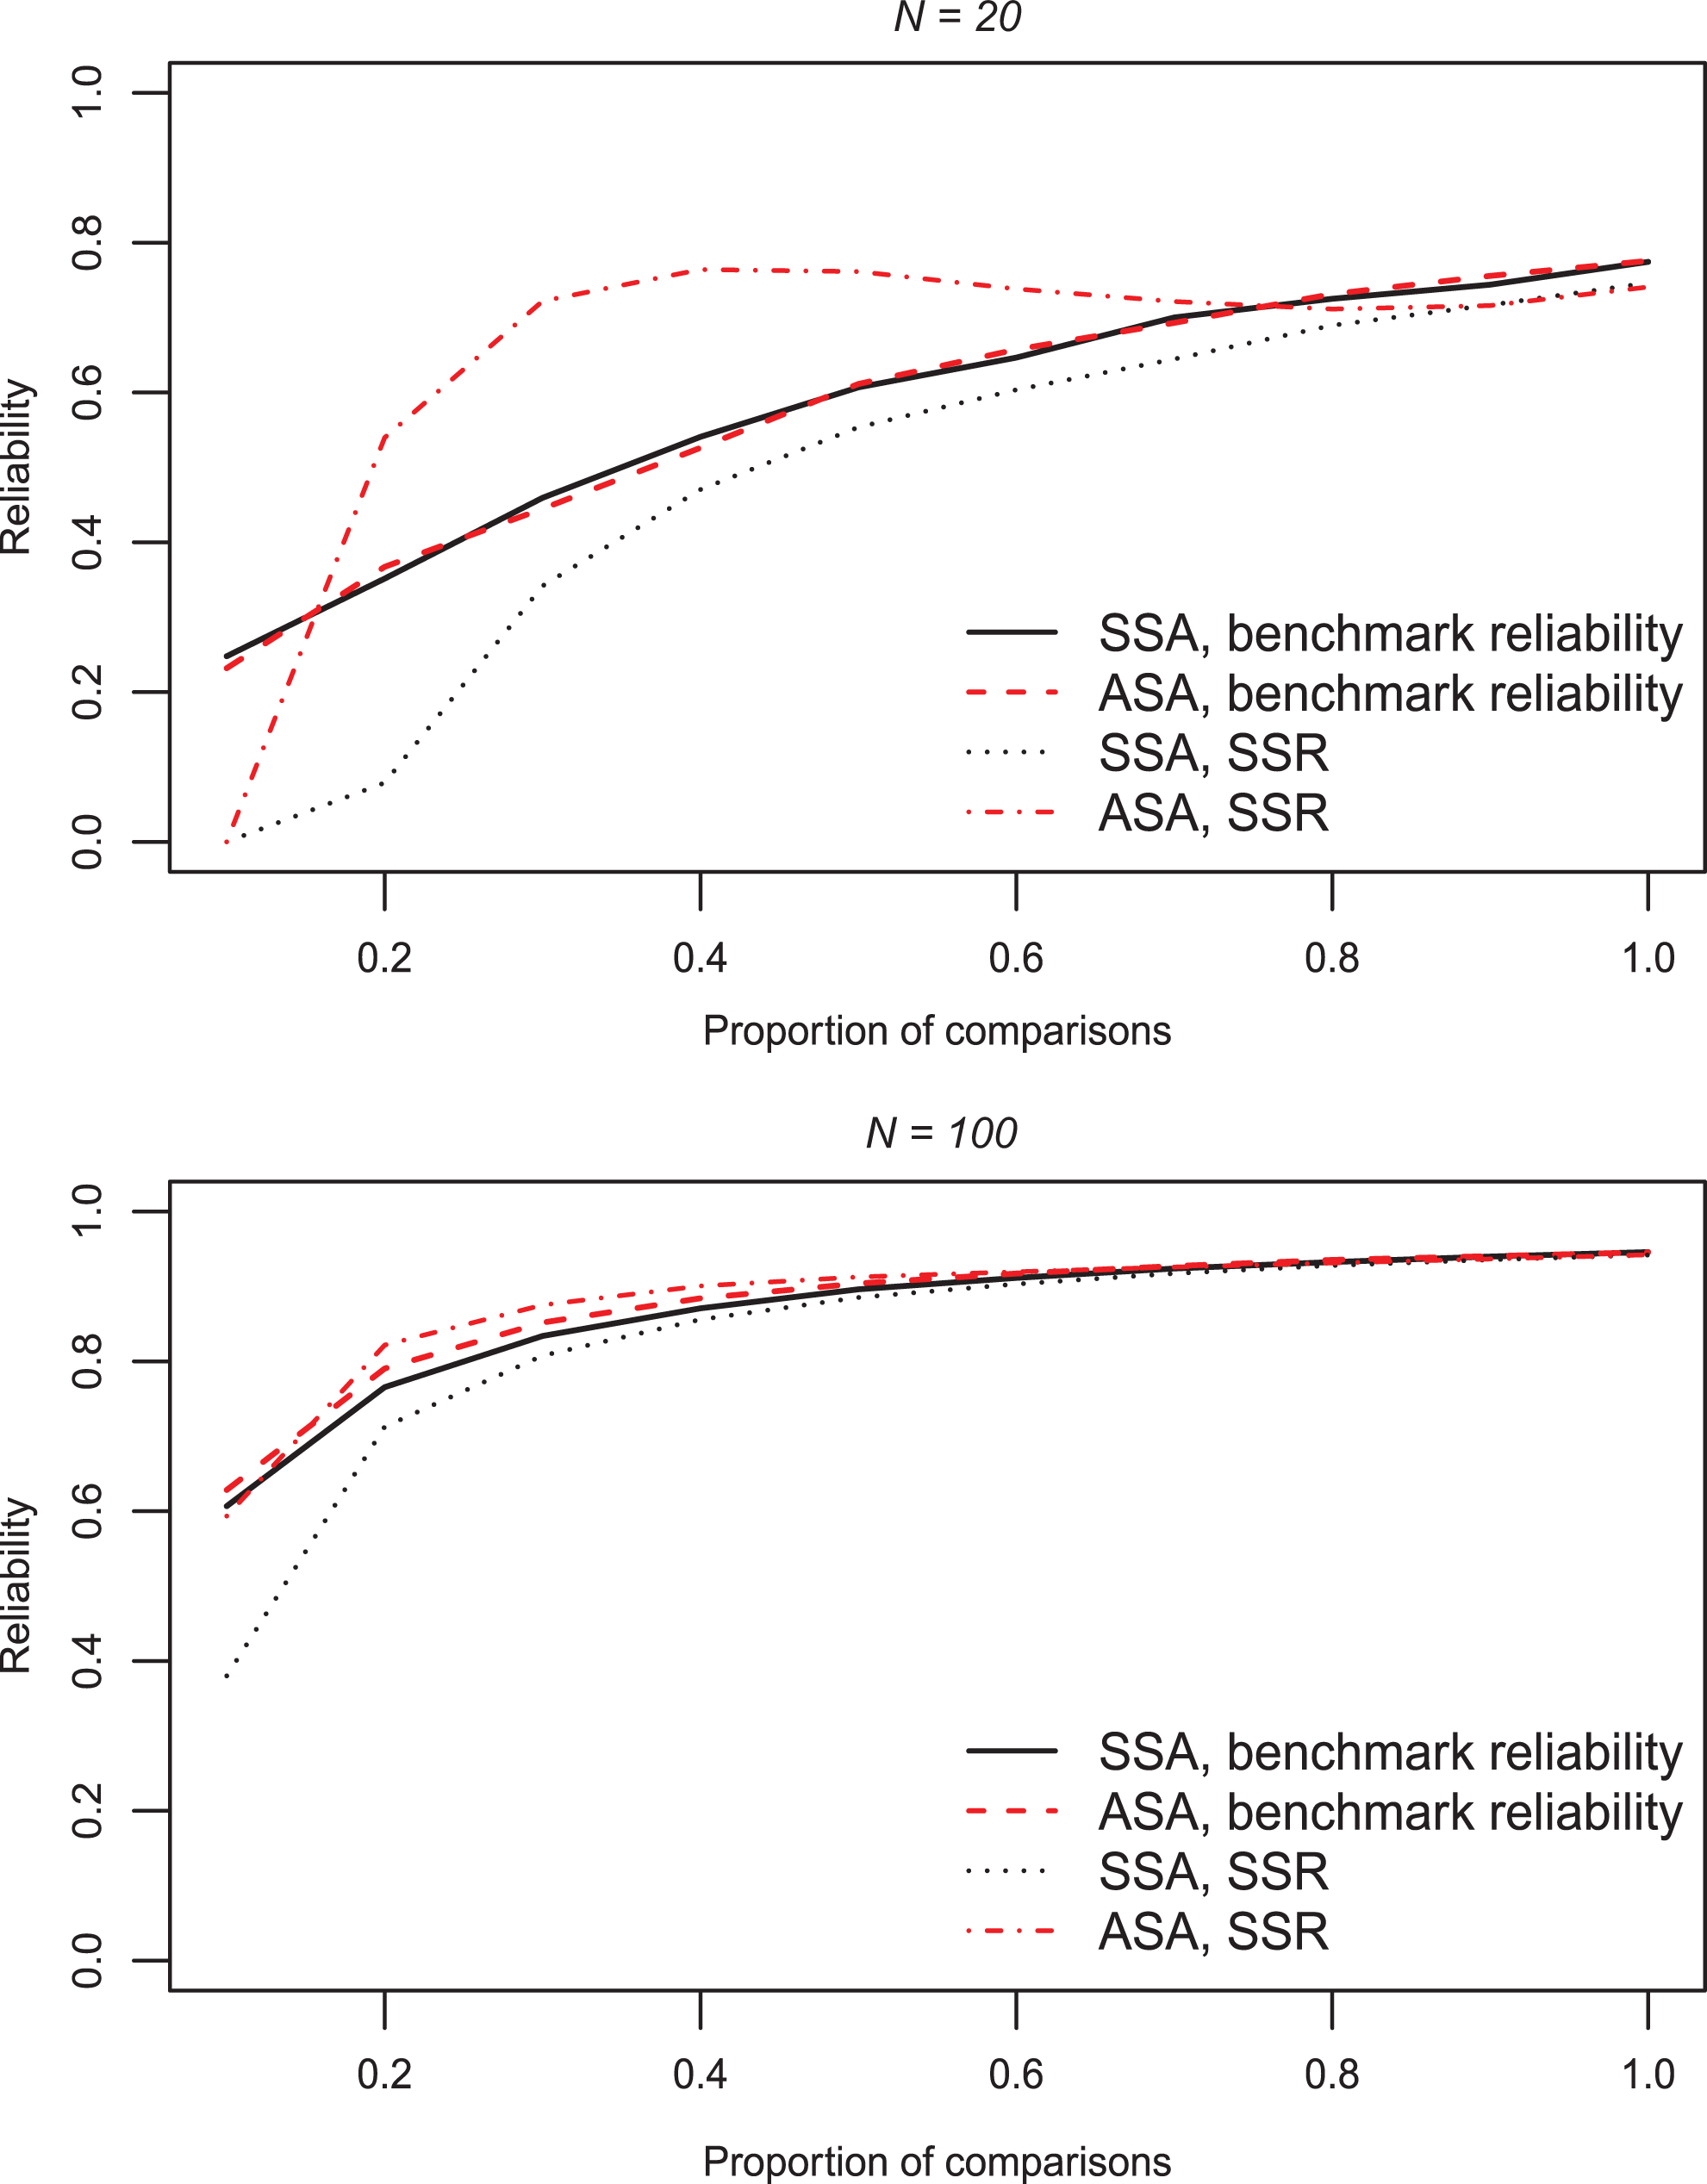
Benchmark reliability and estimated reliability for different proportions of comparisons.
The black and red lines in Figure 6 show that an average of 20 to 22 comparisons per object are required to obtain a reliability of .80. The gray and pink lines show that more than 30 comparisons per object are required to obtain a lower bound of the 90% confidence interval of at least .80. Figure 6 indicates that the proportion of total unique comparisons shows a trend, but it seems that the mean number of comparisons per object shows a clearer relation with reliability. This result is especially interesting because this result can be directly applied to large-scale assessment. This is not the case when looking at the proportion of the total number of possible comparisons, since this statistic depends on the number of objects.
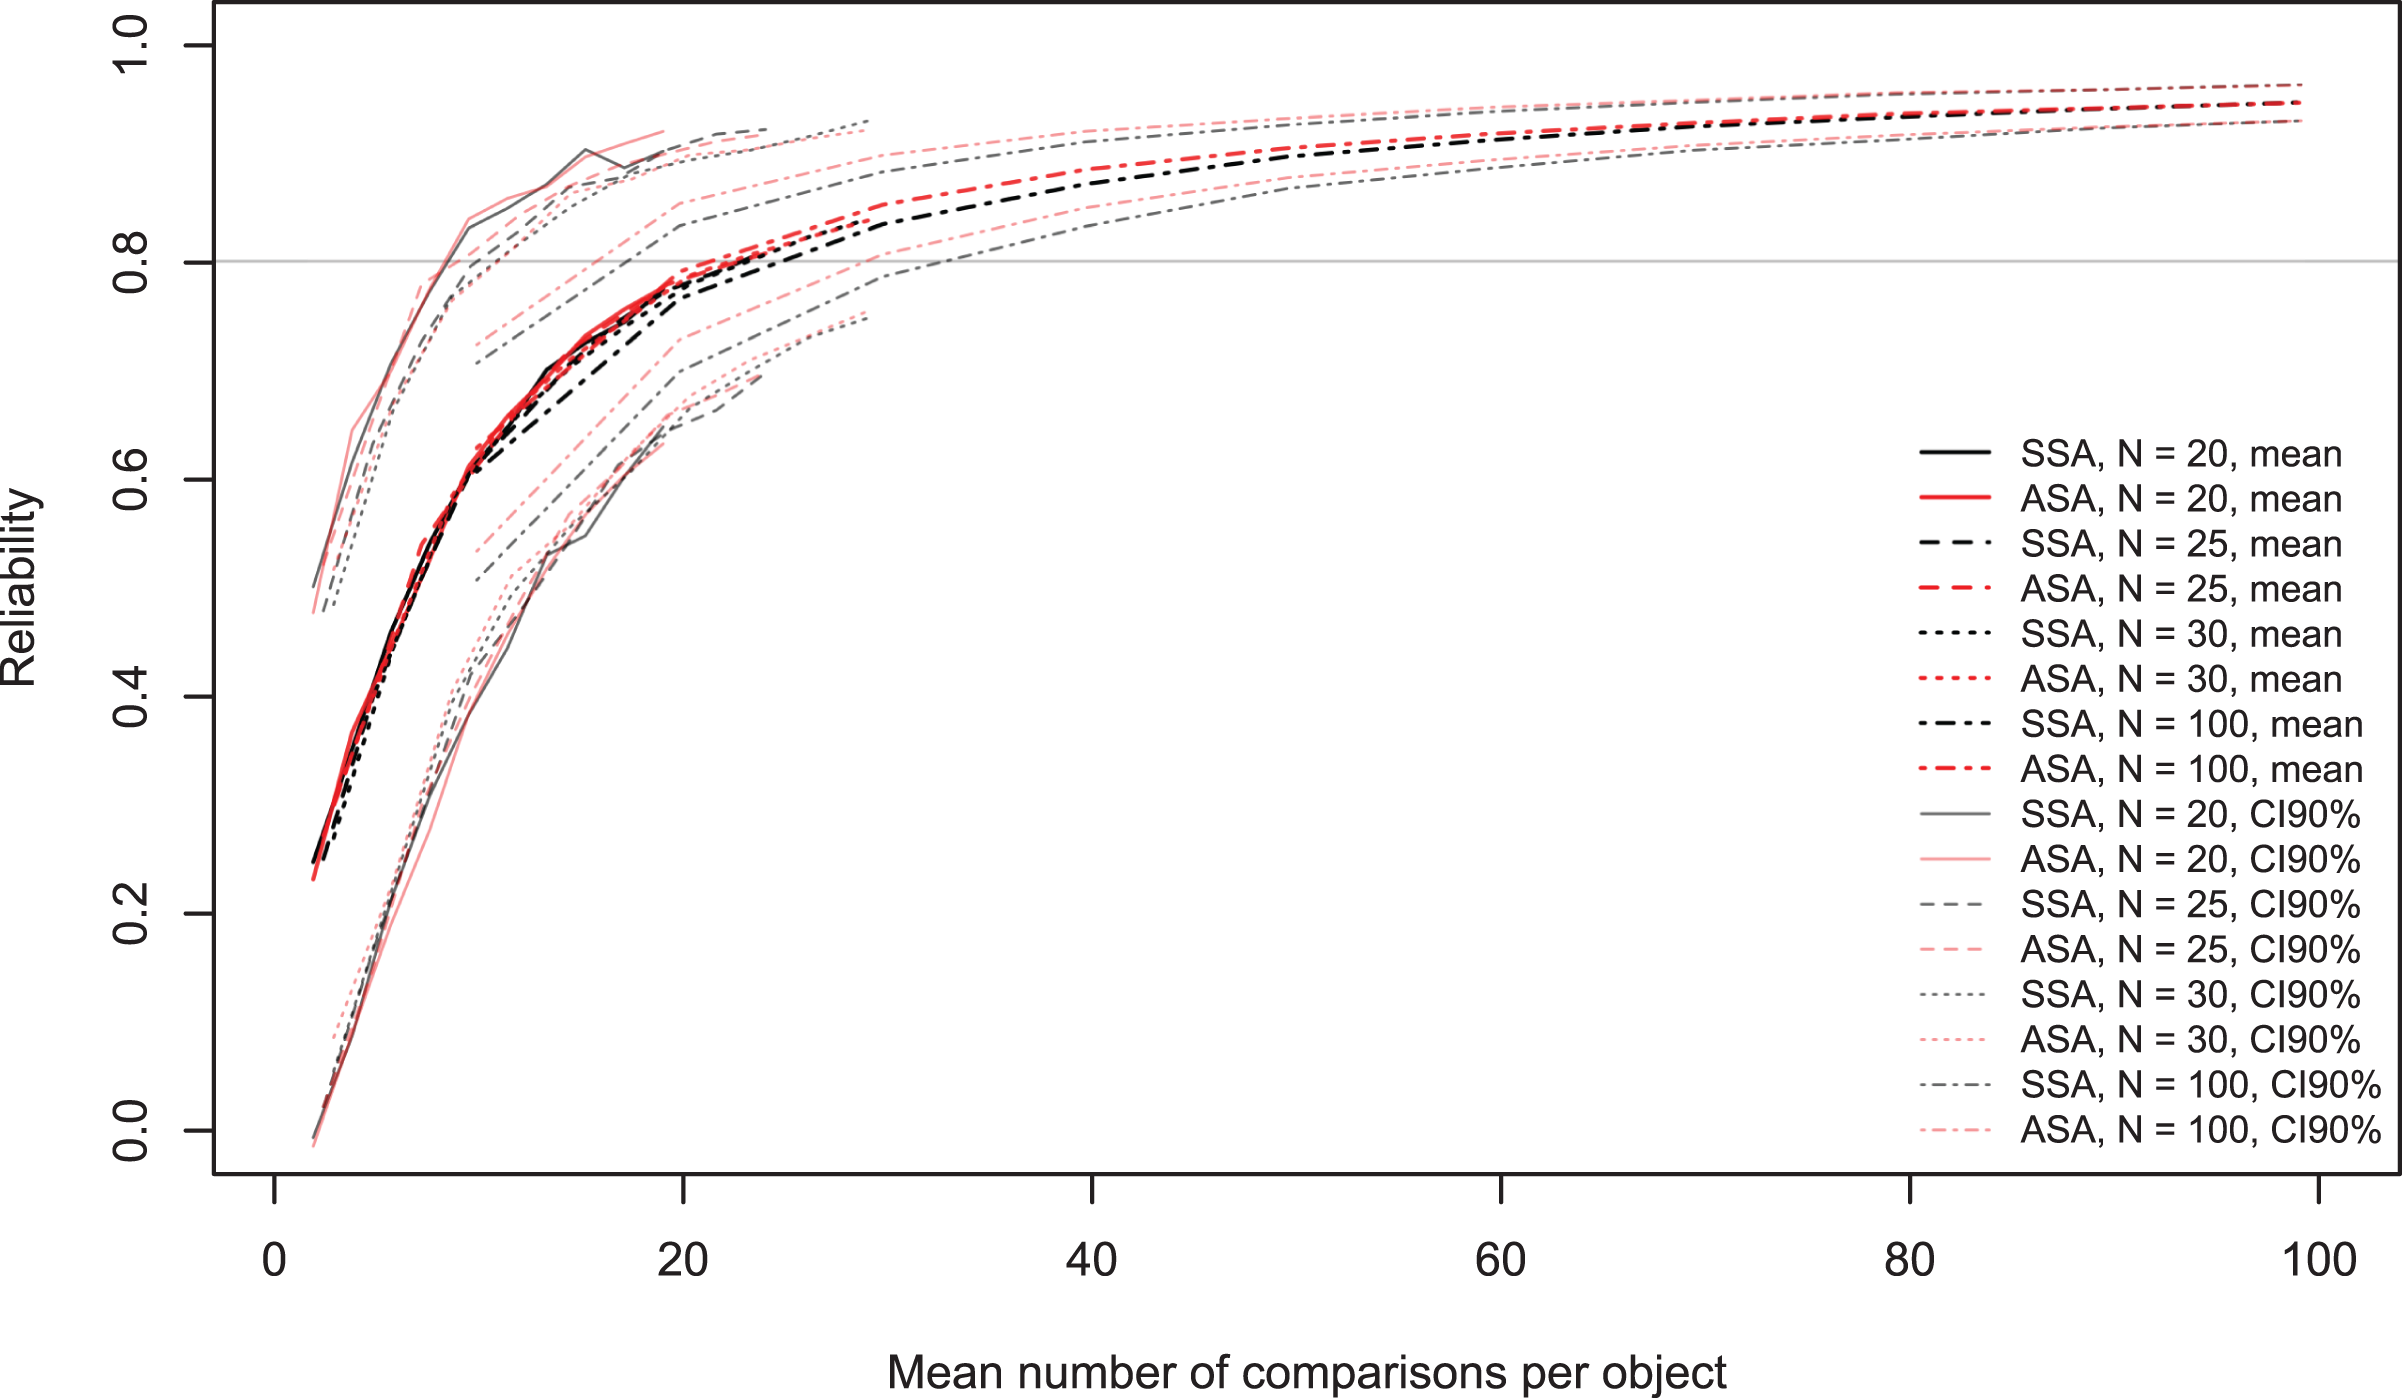
Benchmark reliability and 90% confidence interval for different numbers of comparisons per object for different sample sizes.
Exploratory Analyses
We conducted exploratory analyses to gain further understanding of several results of the confirmatory analyses. In our confirmatory analyses, we noticed that the standard errors of the object parameter estimates and the SSR were affected by the constraint that all comparisons must be unique when the proportion of comparisons was close to 1 or equal to 1. We investigated what the results would be if we would release the restriction that all comparisons must be unique, which corresponds with a situation involving multiple raters that agree perfectly. More specifically, the results are as if multiple raters performed independent comparisons using the same decision rule. We investigated the results of both the SSA and the ASA without this restriction in the following conditions:
The standard errors of the object parameter estimates were smaller for the adaptive algorithm than the random algorithm for all proportions of comparisons (Figure 7). This effect was smaller for larger proportions of comparisons in the original simulation study. The SSR overestimated the benchmark reliability for all proportions of comparisons (Figure 8). In the original simulation study, the SSR did not overestimate the reliability for large proportions of comparisons, which can be attributed to the unique comparison restriction.
Standard errors of object parameter estimates for both selection algorithms, not restricted to unique comparisons, for N = 30 and for different proportions of comparisons. Means of standard errors (dots) for maximum likelihood estimates within ranges of .5 units on the latent variable scale.
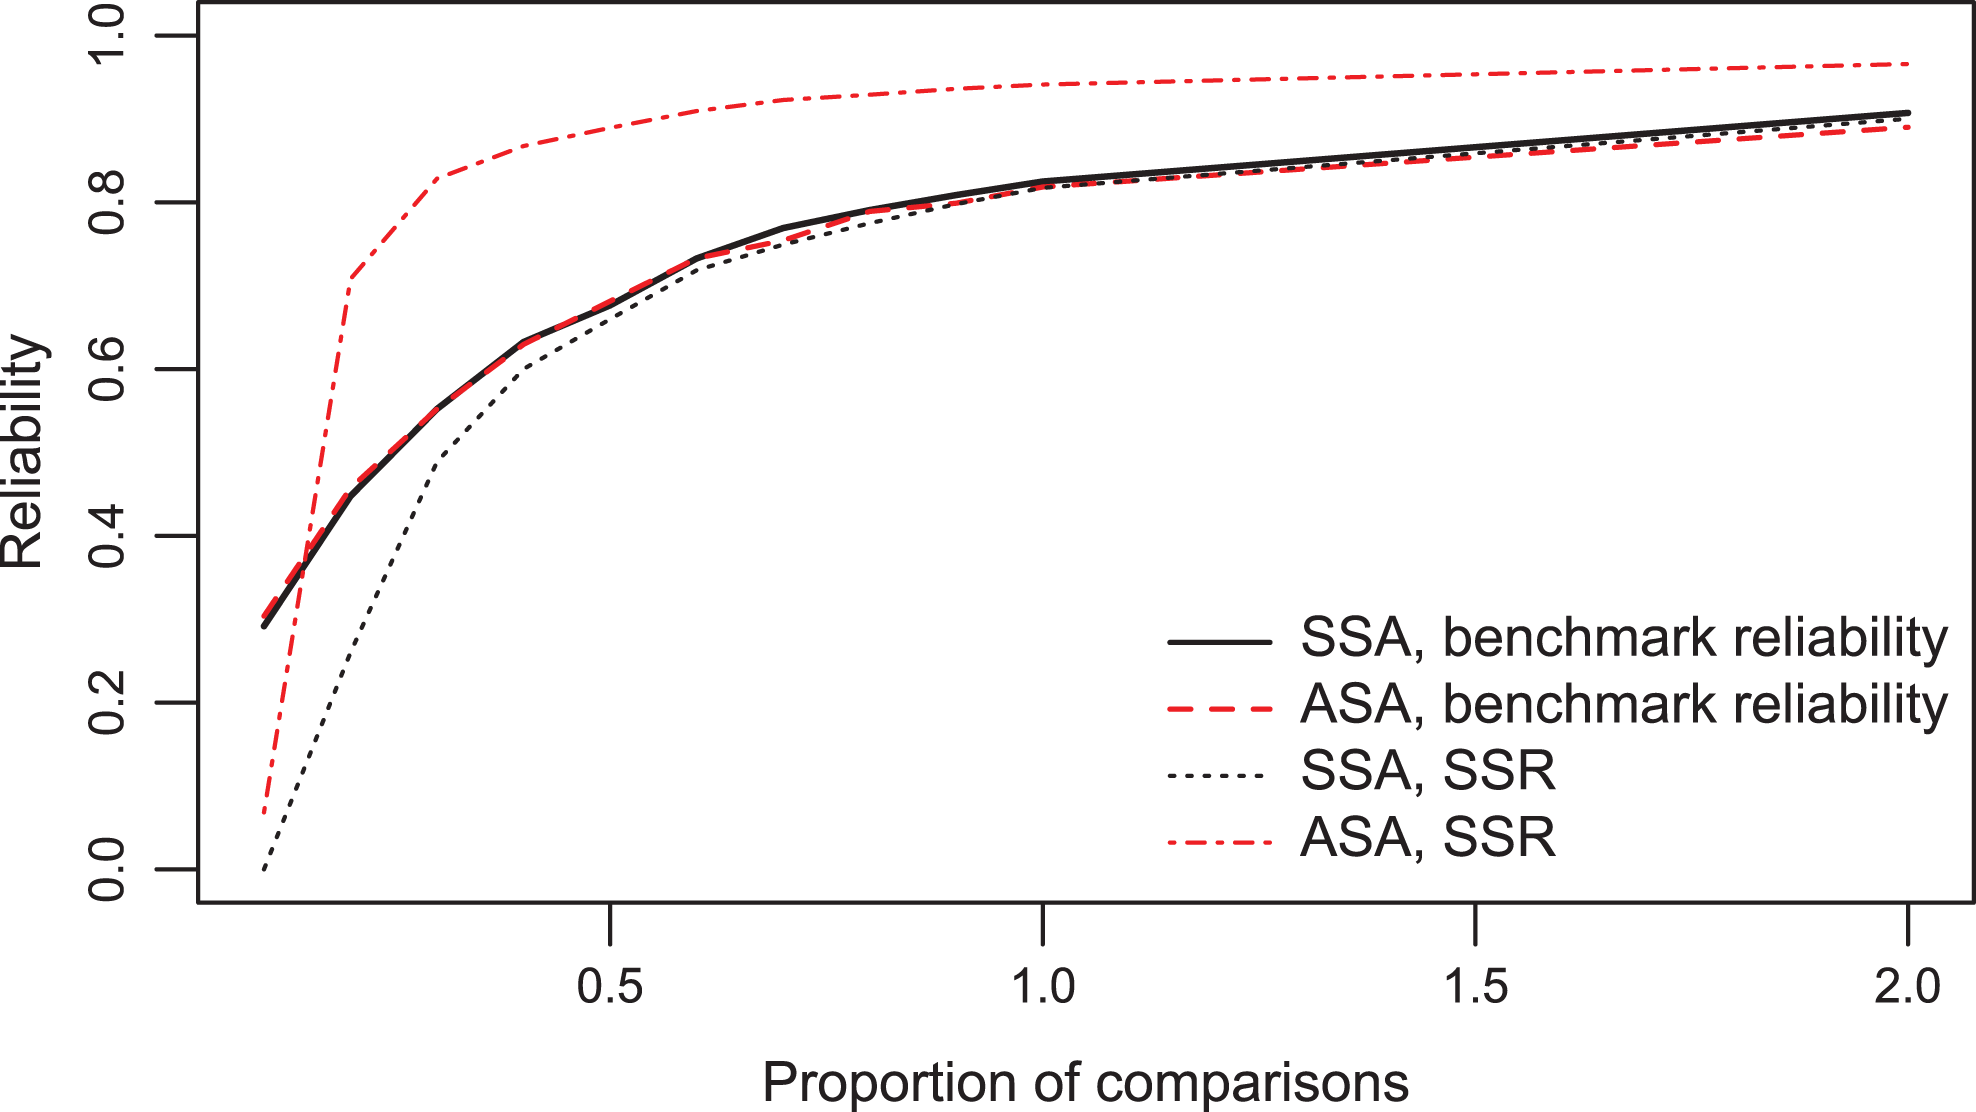
Benchmark reliability and estimated reliability for varying values of C and N = 30.
Another result from the simulation study was that the SSR overestimated reliability when the ASA was used. Further inspection of the results showed that the variance of the object parameters was overestimated. This result was found for both algorithms, but overestimation was extremely large for the adaptive algorithm when C was small. To further investigate the mechanism producing this result, we fixed the object parameters in the generating model and tested the unrestricted SSA and ASA in the following conditions:
Figure 9 shows that for the first set of conditions (
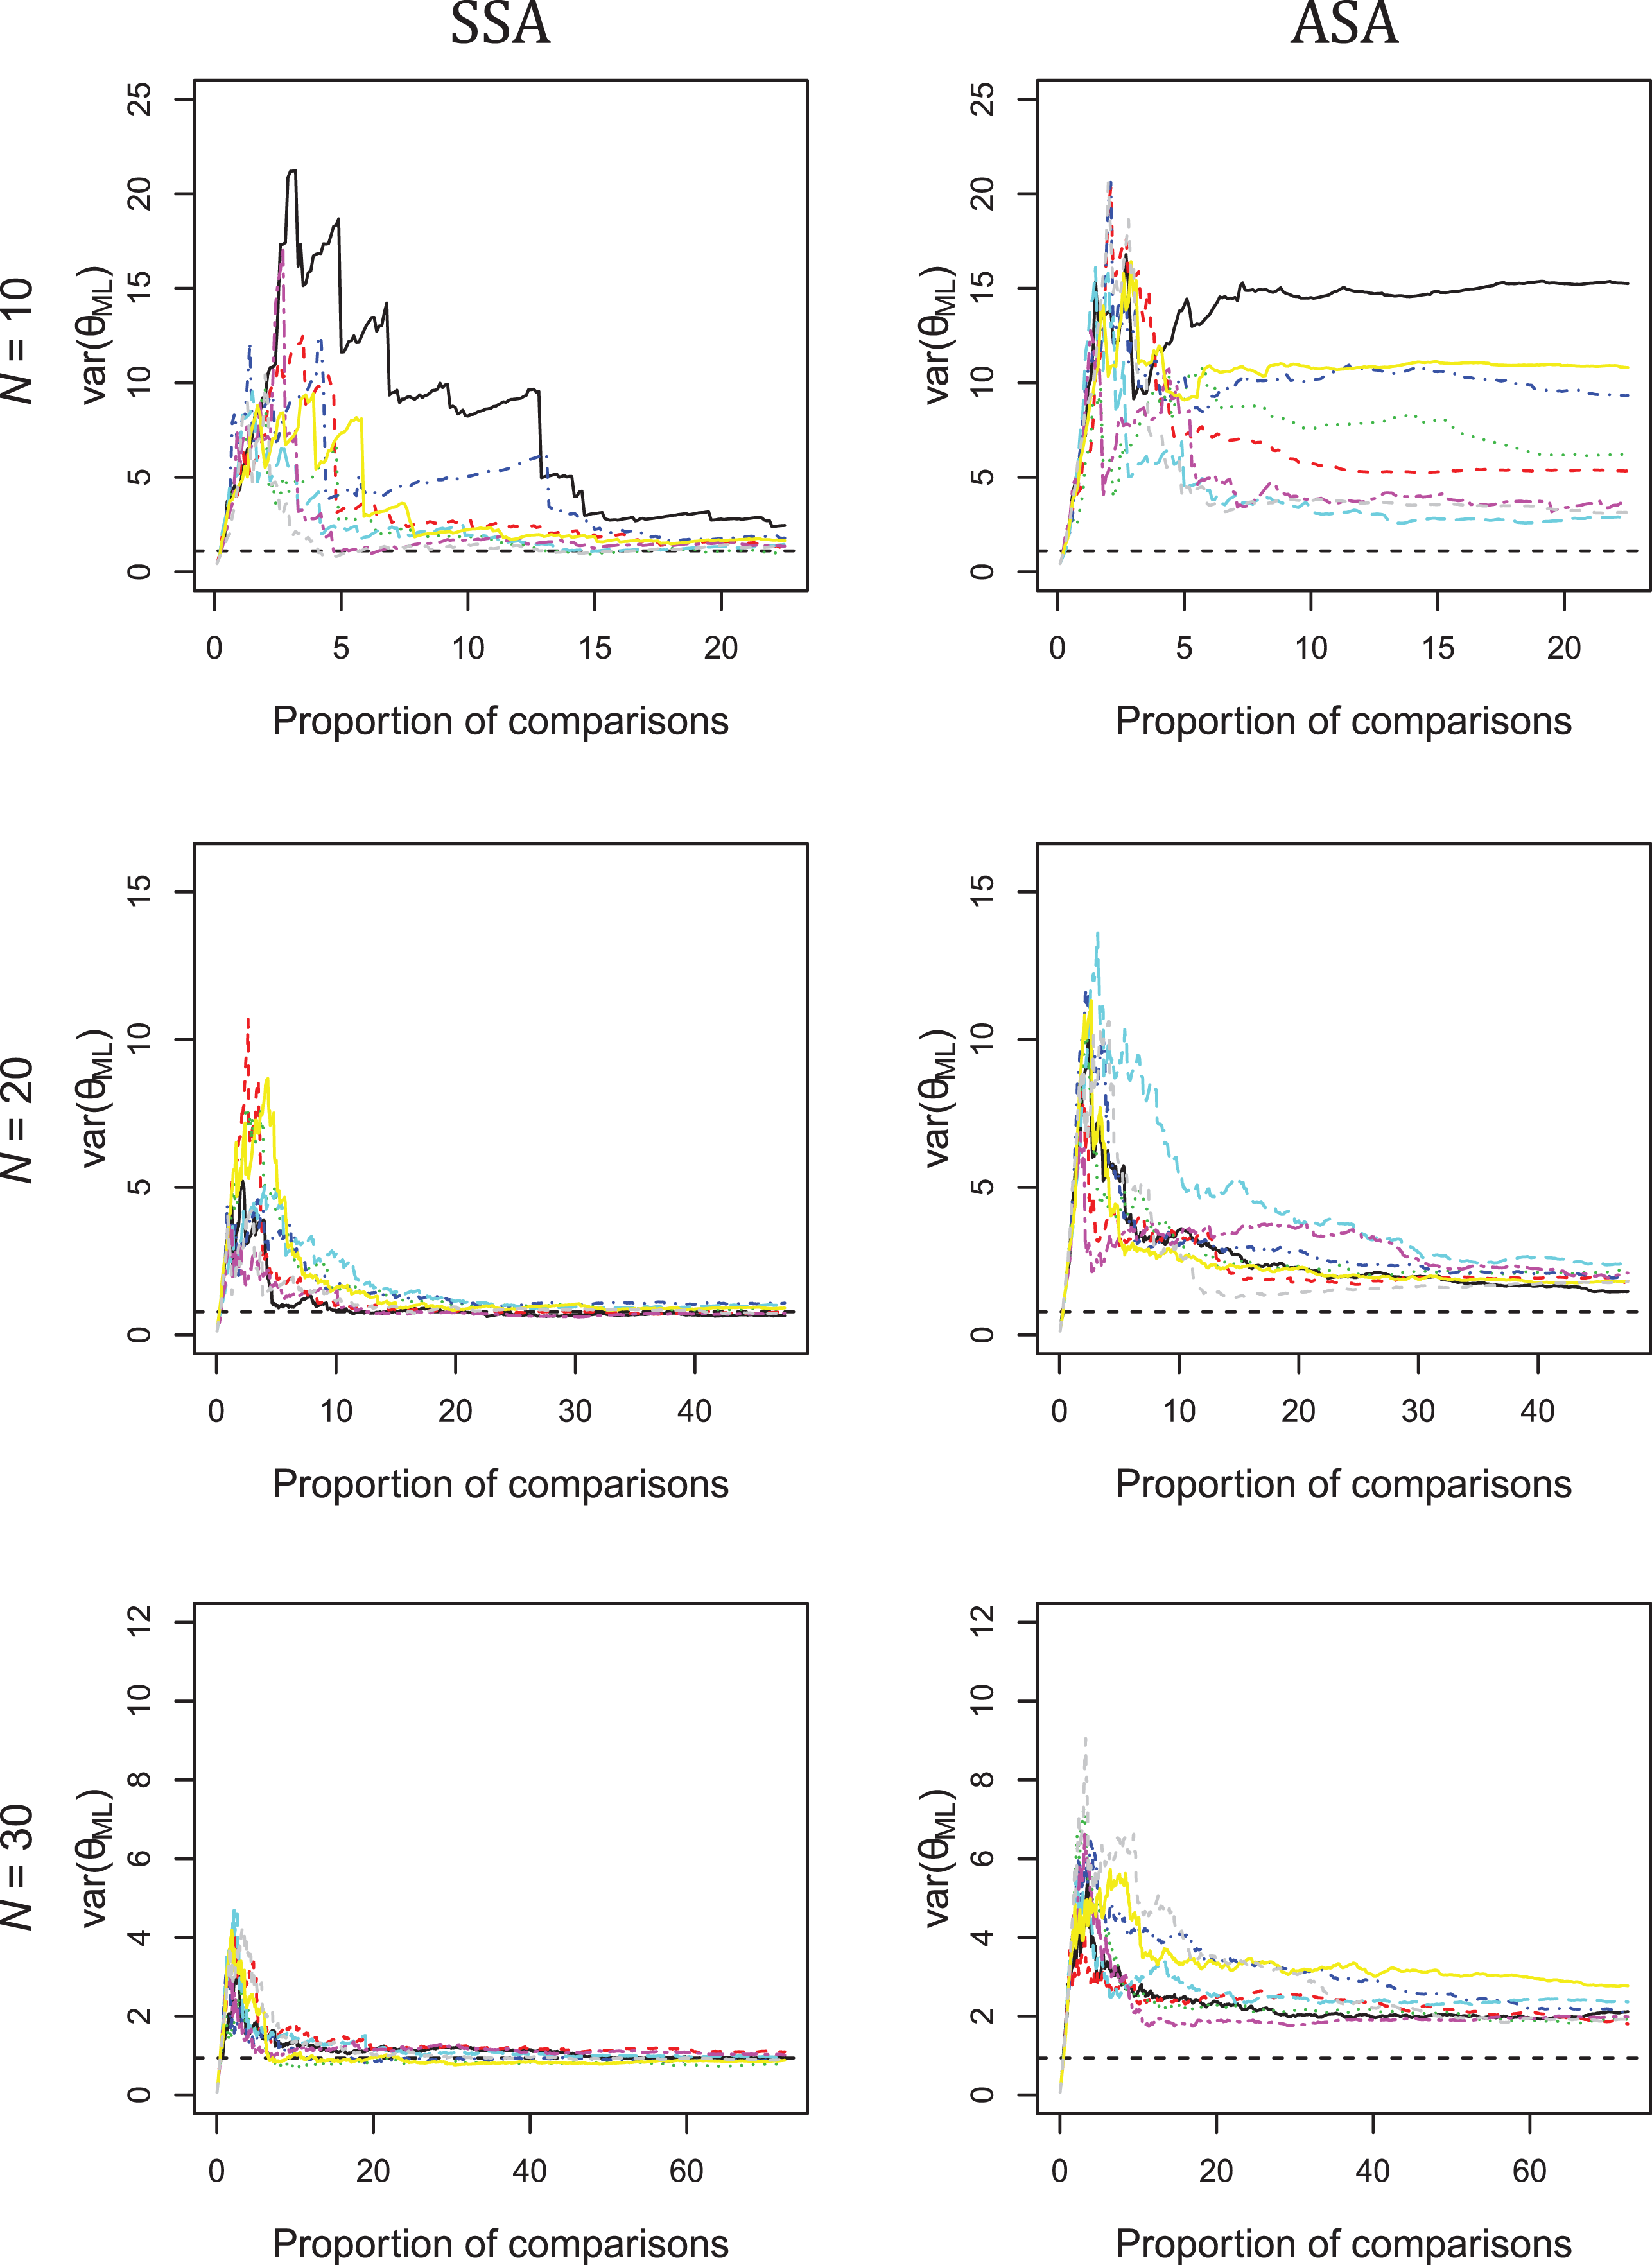
Variance of object parameters for varying numbers of comparisons per object for eight replications.
Discussion
The newly developed ASA produced smaller standard errors than the SSA. This result was found both for the version of the adaptive algorithm restricted by unique comparisons and for the unrestricted version. For ASA and SSA, the Spearman rank correlation and the benchmark reliability were similar, for both the restricted and unrestricted versions. On average, 20 comparisons per object are required for a benchmark reliability of at least .80. The SSR coefficient on average underestimated reliability when the SSA was used, but overestimated reliability when the ASA was used, and the overestimation grew larger when the ASA was unrestricted. A possible explanation is that using the ASA, the variance of the object parameters was overestimated. These results support the suggestion of Bramley and Vitello (2018) that using an adaptive algorithm can lead to a spuriously inflated standard deviation of the object parameters, but the standard errors of the parameters can be genuinely reduced. Therefore, this conclusion probably applies to other adaptive pairwise comparison algorithms that lead to an inflated SSR coefficient as well.
When the object parameters in the generating model were close to each other, the location of these objects was estimated quite precisely, but the order of the objects and the variance of their parameters were not, while the opposite results were found when the object parameters in the generating model were distant. This result was found both for the SSA and the ASA and might also hold for other pairwise comparison algorithms. This conclusion may seem obvious but should be kept in mind when interpreting location parameter estimates or rank order estimates from a single sample.
This study contributes to adaptive pairwise comparison by proposing an ASA that takes the uncertainty of the parameters into account. The ASA can be used to decrease the standard errors of the object parameter estimates, hence to increase precision of object locations on the latent variable scale. The improvement holds for the entire group of objects but is largest for objects at both ends of the attribute scale. Therefore, one could argue that the improvement may have limited impact in practical situations. The ASA provides little to no advantage compared to the SSA with respect to reliability and rank order accuracy. Further research could develop an algorithm that focuses on increasing the reliability because in most situations, teachers may be interested in the rank order of students on an attribute scale rather than the location on the scale. In these situations, the focus lies on reliability instead of precision of parameter estimates. For example, a teacher may want to form groups of students for a group assignment based on their relative position in the class on this attribute. Forming groups may then be accomplished by grouping students ranked close together or grouping higher ranked students with lower ranked students.
Whereas previous studies used real data or simulated data without replications (Bramley, 2015; Bramley & Vitello, 2018; Pollitt, 2012), we used simulated data with 400 replications in various conditions. The simulated data allowed us to compare the SSR reliability coefficient with the benchmark reliability, and we found that adaptivity can lead to an inflated SSR coefficient. The large number of replications ruled out that sampling fluctuations explain the results, which was possible in previous research designs (Bramley, 2015).
This study focused on a design with a single rater that performed all comparisons, and the study did not investigate the influence of various raters on the performance of the algorithms. For high-stakes assessment, one rater would be undesirable. First, the burden on this rater would be high. Second, the subjectivity of the rater cannot be counterbalanced by the judgments of other raters. However, having one rater may not be a problem in a classroom situation with low-stakes assessment when the teacher is evaluating whether students understand what he or she has taught or when the evaluation is used to facilitate learning. Hence, our results might be valuable for these low-stakes situations.
Varying numbers of raters and percentages of rater agreement might be valuable when studying the algorithms for use in high-stakes assessment, but their inclusion would render the study design large and time-consuming. It would also require additional research in the different ways rater variance should be modeled. Therefore, we chose to illustrate how the adaptive algorithm technically performs using a single rater as a proof of concept and to illustrate which issues may arise when using this or a similar adaptive algorithm. Even though the influence of raters itself was not investigated, the effects of the algorithm, the number of objects, and the proportion of comparisons on the evaluation criteria can be generalized to the setting of multiple raters. This study can be used in future research as a baseline to investigate the influence of the number of raters in combination with rater agreement. For example, different degrees of rater agreement may be achieved by varying the preference probabilities of the objects for different raters, where larger differences between raters might increase parameter uncertainty and decrease rank order accuracy as well as both types of reliability for all algorithms.
The scale that is obtained from the pairwise comparisons could be used to test whether two objects significantly differ from each other on the attribute of interest. The standard errors of the object parameter estimates could be used to create confidence intervals around the object parameter estimates, which can in turn be used to test whether an object is different from another object. The smaller standard errors the adaptive algorithm produced would lead to smaller confidence intervals, which in turn would lead to higher statistical power. Unfortunately, in several conditions, the adaptive algorithm also led to an overestimated variance of the object parameters, so the differences between objects might be overestimated. Although the statistical power is higher with the adaptive algorithm, this overestimation may cause the power to be overestimated as well, suggesting that the power is even higher when it is not. For this reason, and because the adaptive algorithm was not developed for this specific purpose, we do not advice significance testing for differences between the objects.
To conclude, for the same number of comparisons, the ASA developed in this study can be used to obtain estimates of objects on a latent variable that are more precise than when a random algorithm is used. However, because the SSR may overestimate reliability, one should be cautious to interpret the SSR coefficient when using adaptive pairwise comparisons. On average, about 20 comparisons per object are required for a reliability of .80, whether one uses an adaptive algorithm for pairwise comparison or not.
Supplemental Material
Supplemental Material, JEBS890589_Supplement - Adaptive Pairwise Comparison for Educational Measurement
Supplemental Material, JEBS890589_Supplement for Adaptive Pairwise Comparison for Educational Measurement by Elise A. V. Crompvoets, Anton A. Béguin and Klaas Sijtsma in Journal of Educational and Behavioral Statistics
Footnotes
Declaration of Conflicting Interests
The author(s) declared no potential conflicts of interest with respect to the research, authorship, and/or publication of this article.
Funding
The author(s) received no financial support for the research, authorship, and/or publication of this article
References
Supplementary Material
Please find the following supplemental material available below.
For Open Access articles published under a Creative Commons License, all supplemental material carries the same license as the article it is associated with.
For non-Open Access articles published, all supplemental material carries a non-exclusive license, and permission requests for re-use of supplemental material or any part of supplemental material shall be sent directly to the copyright owner as specified in the copyright notice associated with the article.