
Abstract
The forced-choice (FC) item formats used for noncognitive tests typically develop a set of response options that measure different traits and instruct respondents to make judgments among these options in terms of their preference to control the response biases that are commonly observed in normative tests. Diagnostic classification models (DCMs) can provide information regarding the mastery status of test takers on latent discrete variables and are more commonly used for cognitive tests employed in educational settings than for noncognitive tests. The purpose of this study is to develop a new class of DCM for FC items under the higher-order DCM framework to meet the practical demands of simultaneously controlling for response biases and providing diagnostic classification information. By conducting a series of simulations and calibrating the model parameters with a Bayesian estimation, the study shows that, in general, the model parameters can be recovered satisfactorily with the use of long tests and large samples. More attributes improve the precision of the second-order latent trait estimation in a long test, but decrease the classification accuracy and the estimation quality of the structural parameters. When statements are allowed to load on two distinct attributes in paired comparison items, the specific-attribute condition produces better a parameter estimation than the overlap-attribute condition. Finally, an empirical analysis related to work-motivation measures is presented to demonstrate the applications and implications of the new model.
Noncognitive tests are typically designed to measure individuals’ trait levels of psychological variables. They involve typical behavior performance, such as personality, interests, attitudes, and values, and predominantly use Likert-type items in a rating scale to provide measurement outcomes of self-report questionnaires. When the collected data are fit to a psychometric model, such as item response theory (IRT) models (Lord, 1980), concerns arise regarding the assessment of continuous latent traits and absolute traits, which reflect the benefits and ultimate purpose of normative tests. However, normative test scores are more susceptible to motivated distortion for applicants than for nonapplicants when the test has consequences (e.g., high-stake evaluations or job hiring situations) due to socially desirable responses or attempts to create a positive impression (Christiansen et al., 2005; Donovan et al., 2003; Rosse et al., 1998). In addition, there is little information about within-person differentiation if a person shows a consistent tendency to endorse certain categories on a rating scale (e.g., the neutral option on a 5-point rating scale) throughout all items (Matthews & Oddy, 1997).
In contrast to normative tests, the forced-choice (FC) items used in ipsative tests provide an alternative approach by directing a respondent to make judgments among a set of limited options and to choose the one that is most representative of himself or herself relative to others. Evidence shows that social desirability and response biases (e.g., extremity, acquiescence, and the halo effect) can be effectively controlled because the options that measure different traits are matched to be equally acceptable and attractive in terms of their desirability or extremity (Brown, 2016; Brown & Maydeu-Olivares, 2013; Christiansen et al., 2005; Stark et al., 2005). Well-known examples of the application of FC item formats to noncognitive measurement include the Edward Personal Preference Schedule (Borislow, 1958), the Gordon Personal Profile and Inventory (Hausknecht, 2010), the Occupational Personality Questionnaire (SHL, 2013), and the Kuder Occupational Interest Survey (Kuder & Diamond, 1979). Although FC items have been found to be more advantageous than single-stimulus items used in normative tests and are commonly used in personality and interest measurement, the nature of ipsative scoring remains controversial. The outcome measures are obtained by summing the frequency of the response choices for each statement and measuring different latent traits across the FC items; thus, person-centered measures hinder between-person comparisons and may result in mathematical dependency among multiple trait scales (Cornwell & Dunlap, 1994; Meade, 2004).
To meet the practical demands of providing scoring comparisons between and within individuals in ipsative tests, a variety of IRT models have been proposed for FC data analysis based on either the ideal-point approach or the dominance approach (Andrich, 1995; Brown & Maydeu-Olivares, 2011; Morillo et al., 2016; Stark et al., 2005; W.-C. Wang et al., 2017). Furthermore, FC item formats administered to examinees range from choosing the most preferred statement in pairwise-comparison items to ranking statements from most preferred to least preferred in ranking items (de la Torre et al., 2012; Hontangas et al., 2015; Joo et al., 2018; W.-C. Wang et al., 2016). These formats have also been applied to computerized adaptive testing (CAT; Chen et al., 2020; Joo et al., 2020; Stark et al., 2012).
In some cases, such as clinical diagnostic settings, the preferred approach to classifications of test takers in assessments of personality or psychological disorders is to simply locate them on a continuum from low to high levels of latent traits. That is, individuals can be diagnosed and classified as either having or not having a certain type of personality or a specific disorder in a single analysis without additionally determining the thresholds on a latent continuum to define diagnostic classification through a latent continuous trait model (e.g., IRT models). Therefore, diagnostic classification models (DCMs, also known as cognitive diagnosis models; Rupp et al., 2010) have been developed to characterize the relationship of the latent discrete variables (also called attributes or skills) to the observed responses in a test and can provide diagnostic information as to whether test takers possess a measured attribute (e.g., a certain type of personality, disorder, or interest) rather than calibrating along a latent trait continuum.
There is abundant research and literature on the applications of DCMs to educational testing situations because DCMs allow for the efficient collection of finer-grained feedback on examinees’ strengths and weaknesses in cognitive skills, and remedial instruction interventions can be provided immediately by adjusting teaching strategies (Huang, 2017; Lee et al., 2011; Leighton & Gierl, 2007; Ravand, 2016). In addition to the application of DCMs to educational and achievement tests, Templin and Henson (2006) proposed a disjunctive version of a DCM, the deterministic input noisy or gate (DINO) model, and applied this model to diagnose the degrees of a psychological gambling disorder. With the exception of their research, most studies have used traditional exploratory clustering methods to classify individuals into different classes in terms of different personality types (e.g., Fals-Stewart et al., 1994; Solomon et al., 2001), and a few studies have applied DCMs to personality assessment (e.g., Revuelta et al., 2018).
Although DCMs and other latent class models have been applied in personality and noncognitive tests, single-stimulus formats, such as dichotomous items and Likert-type items (which may be dichotomized for simplicity; see Templin & Henson, 2006), are commonly used for testing and are susceptible to social desirability and fakability. There are few latent discrete variable models in the literature that involve administering FC items and classifying multiple latent noncognitive attributes without using post hoc clustering methods or a cutoff point score on a latent continuum. Therefore, the main purpose of this study is to develop a new class of multiple classification latent class models for FC items on noncognitive tests, which represents the most significant contribution of this study to psychometric theory and testing practices.
The following discussion focuses on pairwise-comparison items in which respondents compare statements in an FC item to determine which statement is preferred. Respondents can rank more than two statements from the most preferred to the least preferred, and the ranking data can then be reduced to multiple paired comparisons. This study is structured as follows. First, the classic comparative judgment theorem for pairwise comparison under the IRT framework is briefly reviewed, and a new class of pairwise-comparison models for measuring the latent discrete variables in FC items is introduced. Second, simulations are designed to evaluate the efficiency of the proposed model under a variety of manipulated conditions using Bayesian estimation, and the results are summarized from the parameter recovery. Third, the empirical data that were collected from the FC items to measure work motivation are used to demonstrate the applications and implications of the new models. Finally, this article presents overall conclusions of the results and provides suggestions and directions for future studies.
Existing IRT Approaches for FC Items
According to the law of comparative judgment (Thurstone, 1927), comparative statements involve unique psychological values or utilities that reflect respondents’ preferences. The favorable choice between two statements is determined by the difference of the two utilities. Let

and

where
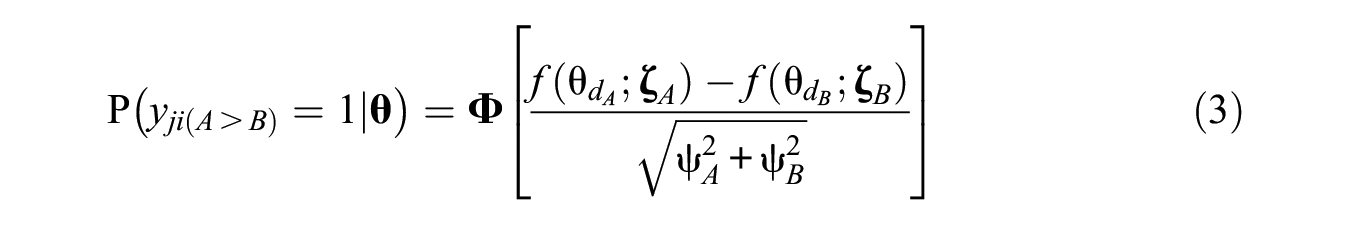
where
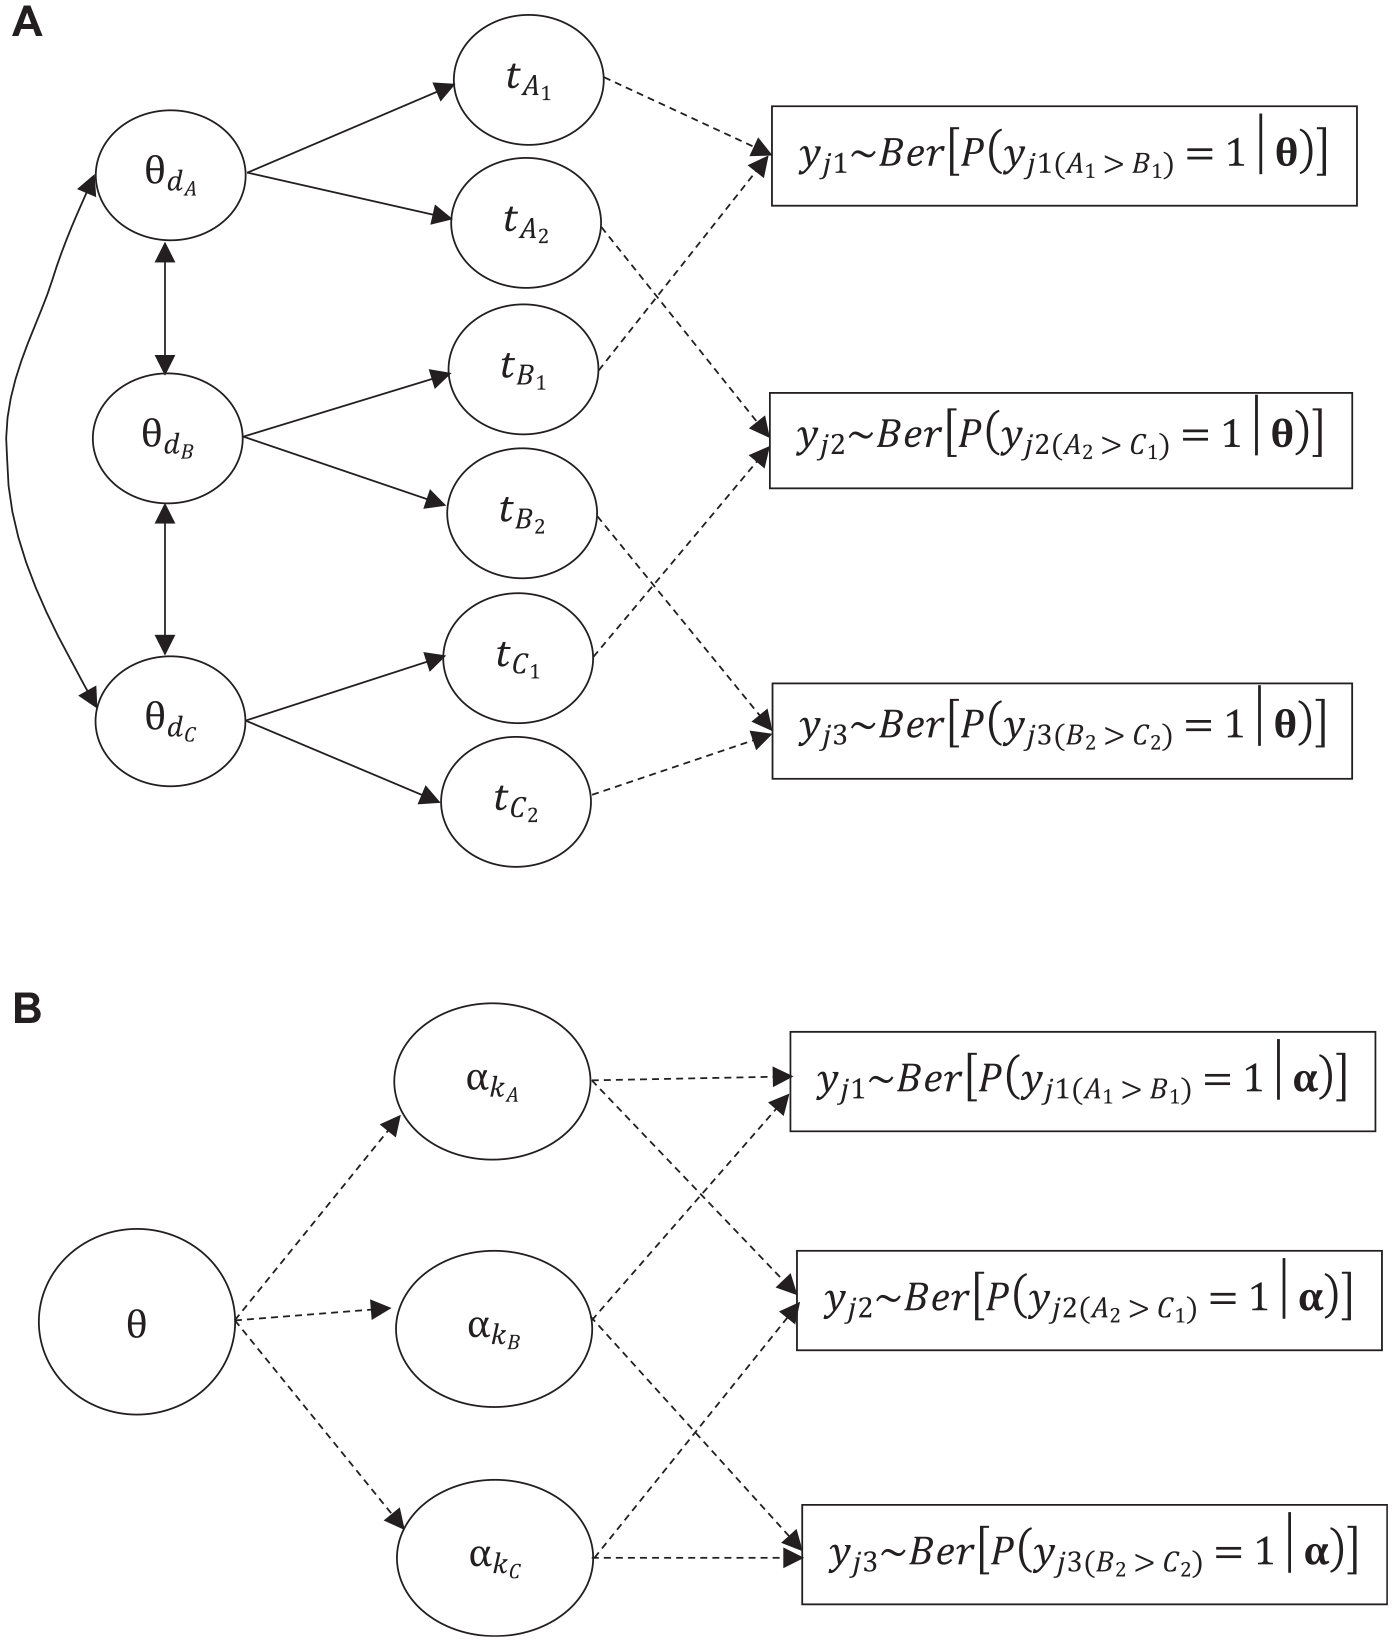
Graphical Representation of (A) the TIRT Model and (B) the FC-DCM
The choice between statements in an FC item involves a discriminal process that can be represented by the discriminal response function for each statement (Andrich & Luo, 2019). In TIRT, the discriminal response function is assumed to be monotonic when using a cumulative approach; that is, when a statement’s utility is higher, it is more likely that this statement will be selected. However, a discriminal response does not always follow a cumulative response pattern, as TIRT assumes. Rather, the highest selection probability may occur when the statement matches the person’s option (i.e., ideal point), and an unfolding model with single-peaked response patterns can be applied to the discriminal response functions of statements. Following the unfolding discriminal response function, the multi-unidimensional pairwise preference (MUPP) model has been developed for pairwise-comparison items (Stark et al., 2005) and has been extended to the fit of ipsative ranking items (de la Torre et al., 2012; Hontangas et al., 2015; Joo et al., 2018). In addition, Morillo et al. (2016) replaced the unfolding item response function used in the MUPP model with a dominance item response function and created an alternative FC model that is almost equivalent to the TIRT model. If the measurement of specific objectivity is desired, then the Rasch ipsative model is readily available to analyze pairwise-comparison and ranking items using the dominance approach, as used in TIRT (W.-C. Wang et al., 2016, 2017).
The Forced-Choice Diagnostic Classification Model
FC items are typically developed to minimize intentional response distortion, which has been commonly observed in normative tests by equating response choices on attractiveness but differentiating them in terms of their validity. That is, each choice option (i.e., statement) in FC items is generally designed to represent a different latent trait, and theoretically, construct validity should be satisfied for these response options (Brown & Maydeu-Olivares, 2013, p. 36; Christiansen et al., 2005, p. 269). Following the FC methodology tradition (e.g., Brown & Maydeu-Olivares, 2011), we use the term “item” to indicate an FC item or a pairwise-comparison item, and each item is composed of two statements that measure different latent traits (e.g., latent continuous or binary variables) to be compared and chosen by individuals. Note that an item constructed with FC formats must have two or more statements, which is definitely different from Likert-type item formats where in most cases, a Likert-type item only involves one dimension and is designed to reflect respondents’ different levels of endorsement in terms of one specific statement (e.g., strongly disagree, disagree, agree, and strongly agree). Because comparative statements are governed by distinct latent traits, an FC-format test is generally considered a multidimensional rather than unidimensional assessment.
A significant study of the five-factor personality format that uses FC items has demonstrated the application in which the statements that measure one of the five personality traits of neuroticism, extraversion, openness, agreeableness, and conscientiousness are compared and selected according to the respondent’s judgment within an item block (i.e., an FC item); choosing one statement means that another statement is not representative of the respondent (Brown & Maydeu-Olivares, 2011). It is rare that two comparative statements that measure the same dimension but are presented in opposite directions are judged by respondents (e.g., two statements that measure introversion and extraversion are simultaneously presented to be compared in an FC item), except for some applications in the literature (e.g., DeVito, 1985; Myers et al., 1998). Following the commonly used approach to constructing FC items, we assume that the comparative statements in an FC item measure distinct dimensions (or attributes) in both our proposed model and in the following empirical data analysis.
In the DCM framework, multiple latent continuous traits are replaced by multiple latent discrete attributes. These attributes can be thought of as dimensions because test takers’ responses to items are determined by their mastery of the attributes (Templin & Bradshaw, 2013). Note that the latent attributes can be defined in terms of multiple categories; for simplicity, this study constrains the attributes to latent binary variables. Figure 1(B) shows an illustrative example of a three-attribute DCM with FC formats in which the three attributes (denoted by
As in traditional factor models, the associations between latent attributes (i.e., traits) should be taken into account. The DCM literature has documented several approaches to modeling the dependencies between latent attributes (Culpepper & Balamuta, In Press), and we revisit the relevant issues in the final discussion section. In our developed FC-DCM, we assume that the attributes are governed by a second-order latent continuous trait (
The relationship between the higher-order latent trait and lower-order latent attributes can be modeled using the higher-order DCM approach proposed by de la Torre and Douglas (2004), which assumes a cumulative response process and uses a dominance IRT model for the probability curve of mastering an attribute. Therefore, the probability of test taker j mastering attribute
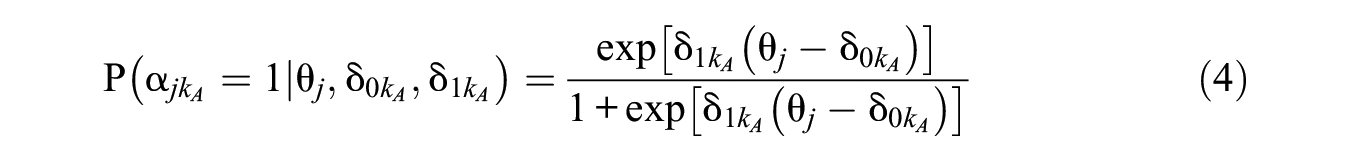
where
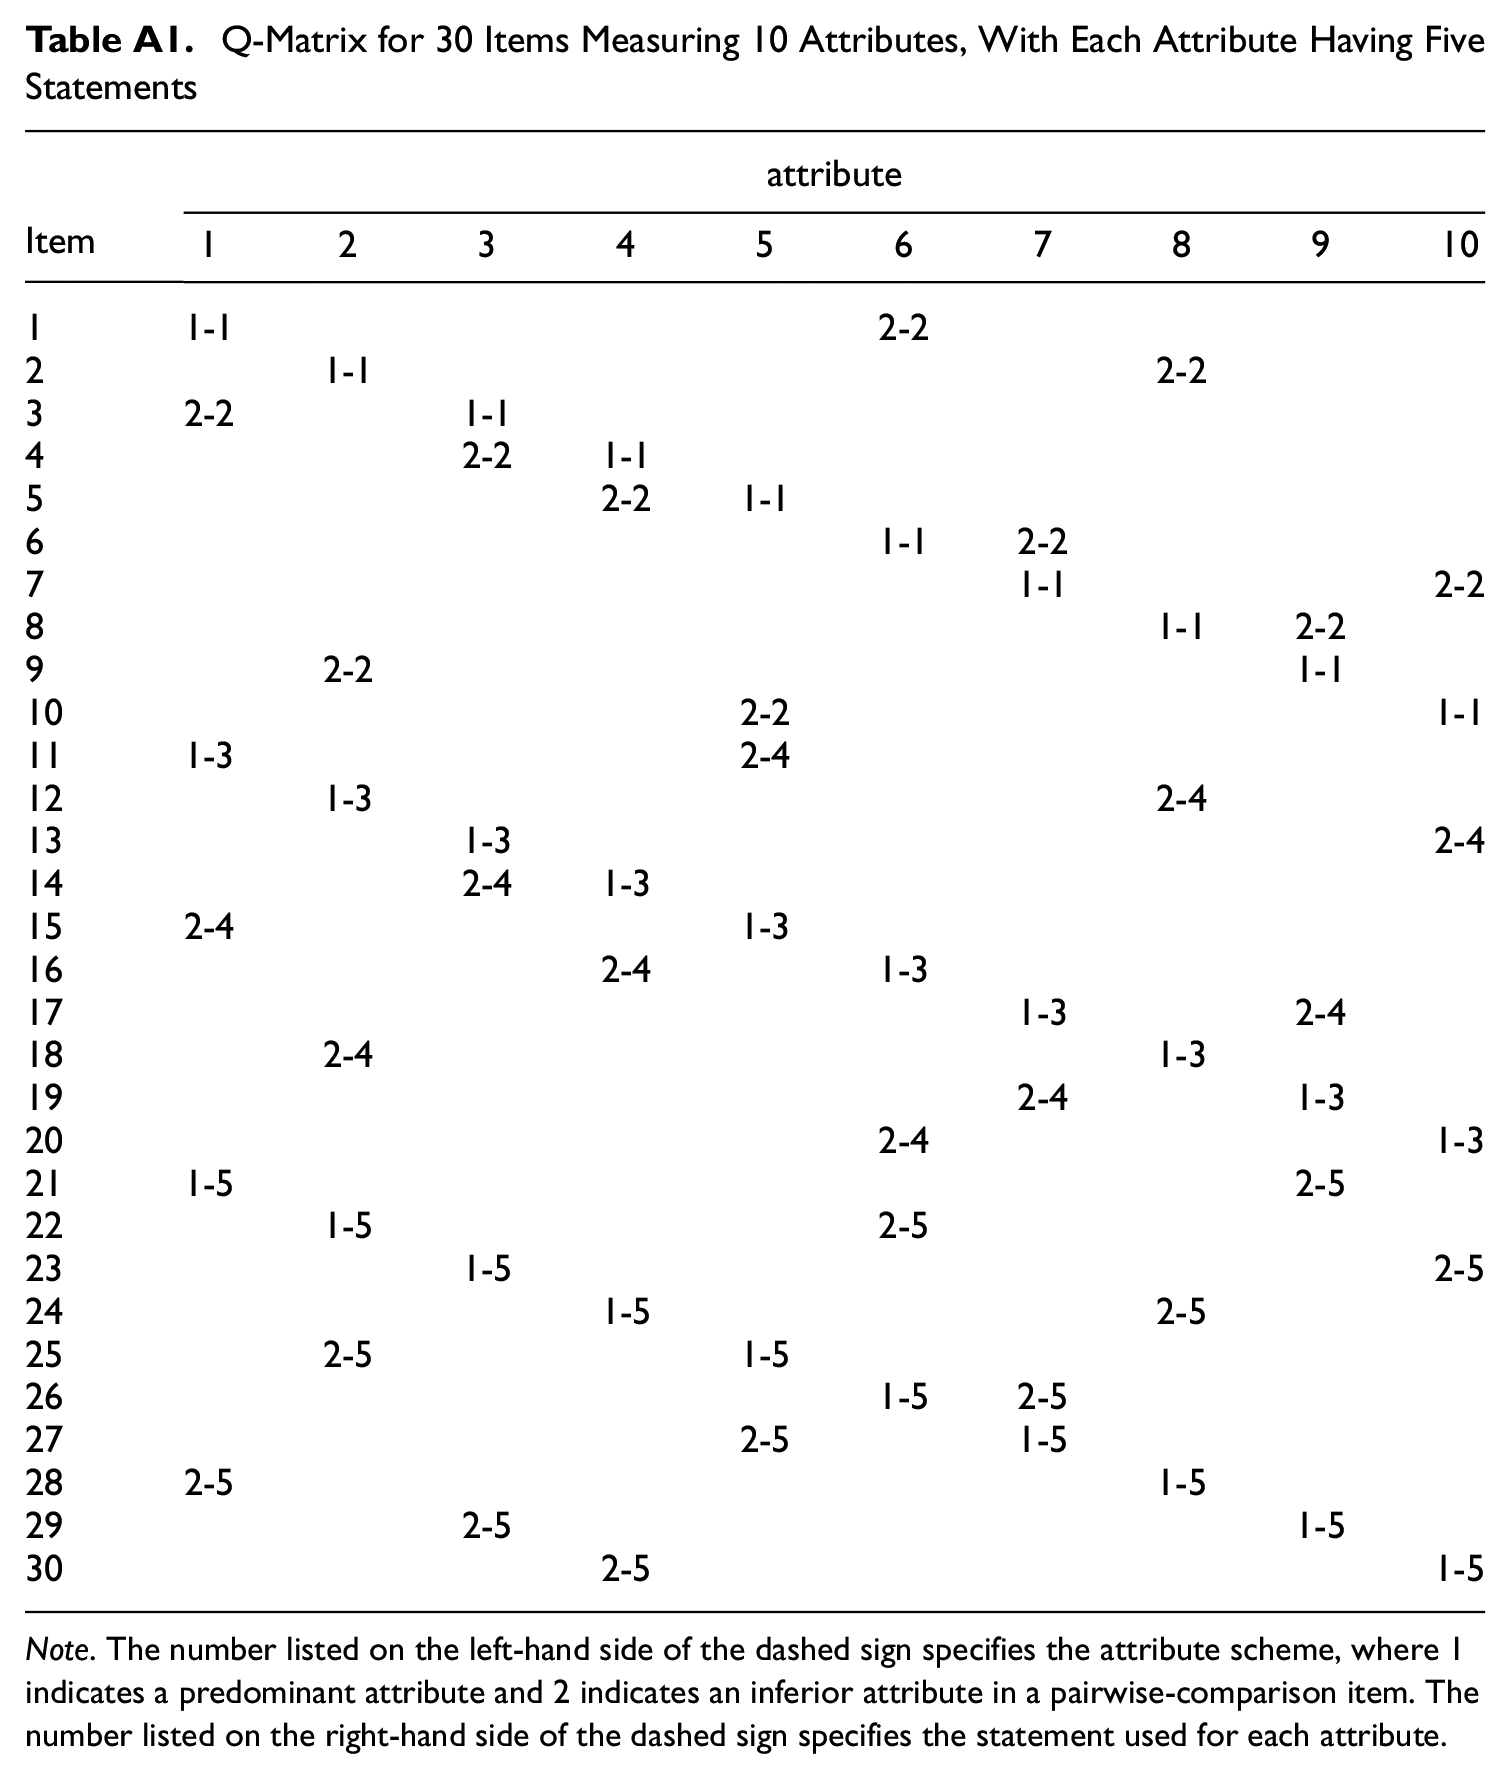
Next, a Q-matrix that maps the latent attribute onto the observable FC response should be specified a priori. Two statements that are designed to measure two distinguishable attributes can be compared in an FC item to force test takers to endorse the one that is most preferred or most representative of themselves. An illustrative Q-matrix is presented in Appendix A in which 10 attributes underlie the responses to 30 pairwise-comparison items, with each attribute having five statements and each statement being exclusively accounted for by a single attribute. We use this Q-matrix exemplification to conduct simulations to evaluate the identifiability issue in the proposed FC-DCM, as described below. Note that a more complex Q-matrix that allows each statement to measure more than one attribute can be constructed straightforwardly to build a more general FC-DCM, although it is not shown here due to space constraints.
Let


Furthermore,

where
Taking the five personality traits test described above as an example (Brown & Maydeu-Olivares, 2011) and using the retrofitting approach that is commonly implemented in DCMs (see the “Demonstrative Example” section for more details),
Note that unlike additive DCMs, such as the generalized DINA (G-DINA) model (de la Torre, 2011), where the change in the probability of endorsement is a result of having a given attribute, the FC-DCM is formulated to quantify the effects of the two distinct attributes. Because each pairwise-comparison item is composed of two statements and each statement has unique characteristics represented by their utility levels, the endorsement probability for the predominant attribute pattern in a given item, as shown in Equation 8, is expressed as an additive formulation of the two statement utility parameters. The major difference between the traditional additive DCMs and our proposed FC-DCM is that in the FC-DCM, the additive effect of each statement arises when the respondent’s mastery attribute pattern is identical to the predominant attribute pattern that an item specifies and when the effects of mastering the predominant attribute and not mastering the inferior attribute are quantified for the respective statements. In contrast, traditional additive DCMs consider and quantify only the parameters for the presence of the attributes for each item. The two statement utility parameters can thus be separately estimated to represent the effects of different attributes on the comparative statements when the predominant attribute (i.e.,
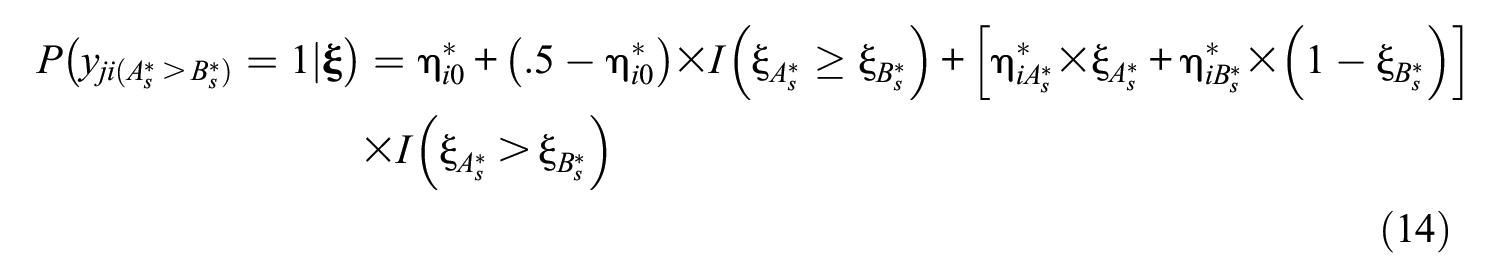
By combining the four probability functions listed in Equations 5 to 8, the full conditional probabilistic function can be expressed as
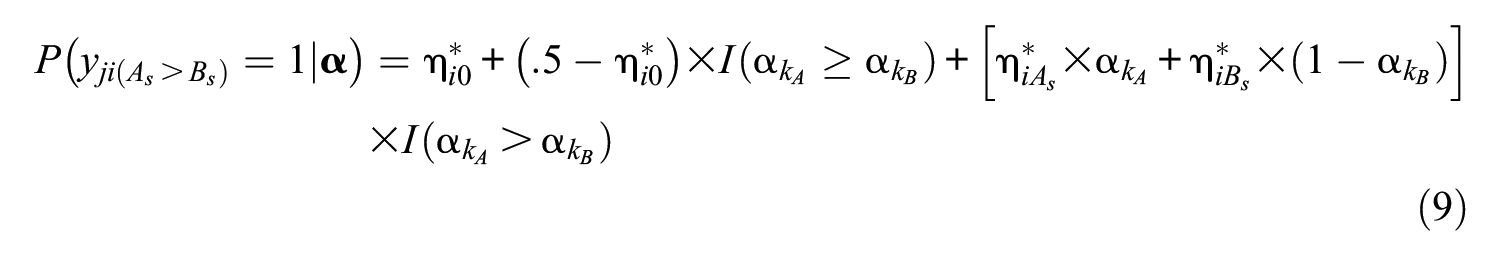
where
In some cases, a statement may load on more than one attribute simultaneously, and multidimensionality can occur within statements such that a complex Q-matrix should be developed for each paired statement in the FC items. It is not uncommon in practice for the indicators in psychological or personality tests to contribute to more than one dimension (e.g., Super, 1942). Therefore, the FC-DCM is not limited to FC items with two comparative attributes but can be extended to fit FC items with multiple comparative attributes.
To map statements to attribute k (

and

for the conjunctive modeling approach; and

and

for the disjunctive modeling approach.
As a result, the full conditional probability of selecting statement
where the parameters are interpreted as in Equation 9. The FC-DCM is substantially flexible such that researchers can customize their models in practice to allow a statement to load on more than two attributes simultaneously or to extend the proposed FC-DCM with a conjunctive or disjunctive approach. In some cases, it may happen that some statements follow the conjunctive function and others follow the disjunctive function; for example, some personality types may be compensatory, while other types belong to the noncompensation category based on substantive theory, which leads to the formulation of a hybrid FC-DCM. When a hybrid FC-DCM applies to such data, model fit evaluation can be implemented to determine the best-fitting model according to fit statistics. Various fit statistics and methods have been developed in the literature (e.g., Chen et al., 2013; de la Torre, 2011). The way that these model-data fit techniques work in the hybrid FC-DCM warrants further investigation that may go beyond the scope of this study.
Issues of identifiability for the newly proposed FC-DCM address whether the model parameters can be consistently estimated under a fitted DCM and its corresponding Q-matrix. Several conditions for model identifiability in a variety of DCMs have been developed and elaborated (e.g., Chen et al., 2015; Fang et al., 2019; Xu & Zhang, 2016). As noted by Fang et al. (2019), however, the identifiability conditions are substantially difficult to derive from unified theorems because model structures and functional forms depend largely on the specified Q-matrix and the selected DCM. To remain within the scope of this study and avoid a mathematically complicated derivation, we referred to previous works to seek possible identifiability results and conducted simulations to evaluate the consistency of the model parameter estimates. The relevant literature recommended that both conditions of a complete Q-matrix (i.e., a K-dimensional identity matrix, where K is the number of attributes) and at least three items for any given attribute fulfill the identifiability result (Fang et al., 2019; Hartz, 2002; Ravand & Baghaei, 2020; Xu & Zhang, 2016), which may apply to the proposed FC-DCM. Because a pairwise-comparison item always measures at least two attributes, the condition of having a complete Q-matrix is not accessible; thus, the second condition is considered to construct an appropriate Q-matrix in the FC-DCM. FC-DCM identifiability is evaluated by a series of systematic simulations, which are described in the following section.
Method
Simulation Design
Two simulation studies, namely, one involving between-statement multidimensionality (i.e., each statement measures one attribute) and the other involving within-statement multidimensionality (i.e., each statement measures two attributes), were conducted to evaluate the parameter recovery in the proposed FC-DCM using a Bayesian estimation under a variety of manipulated conditions. In both studies, the FC-DCM for the pairwise-comparison items was used to generate the responses, and three common factors were manipulated as the (a) numbers of attributes of 5 and 10, (b) test lengths of 30 and 60, and (c) sample sizes of 500 and 1,000. The particular factors manipulated for the two respective studies are as follows. In addition to the above three factors, in the first simulation study, an attribute was designed to have 5 or 10 statements, and each statement was allowed to be presented repeatedly in the FC items. The two statements in an FC item were assembled for all replicated data by randomly selecting two statements that measure two different attributes among 25 (
The statement utility parameters (e.g.,
In the FC-DCM, as shown in Equations 5 to 8, we assume that the response probability will equal .5 when no predominant attribute is unidentified. This constraint is set based on reasonable expectations of test takers’ response behaviors. However, this may not be the case in practice because response randomness may be observed due to the wording of the item stems or other item-related characteristics. Following the first simulation study, a supplementary simulation was conducted to allow the choice probability conditional on having an identical mastery status between the two statements (denoted by
In theory, when the number of attributes specified is larger, the test can provide more information, and the analysis will be more computationally burdensome (Embretson & Yang, 2013; Ravand & Baghaei, 2020). In real testing situations, a moderate or relatively high number of attributes has often been considered in the literature (e.g., Lee et al., 2011; H. Liu et al., 2013), and a rule of thumb indicated by de la Torre and Minchen (2014) recommends a maximum of 10 attributes. This recommendation is the major reason that the 10-attribute condition was considered in our study. As the number of attributes increases, however, more persons and more items are needed and expected to render higher attribute reliability and more accurate parameter estimation. Thus, we chose the 10-attribute condition for the evaluation of model identifiability in the FC-DCM. The exemplary Q-matrix with 10 attributes and 30 items, which is shown in Appendix A, was illustrated to generate item responses via simulation by increasing the sample sizes from 50 to 5,000 with equally spaced increments of 50; as a result, 100 person groups were used to calibrate the simulated data. The Q-matrix specification satisfies the condition that each attribute is required by at least three items and simultaneously structures attributes as either predominant or inferior across different pairwise-comparison items. If the estimated parameters converge to the generated value as the sample size increases, then this can provide numerical evidence of FC-DCM identifiability (Xu & Zhang, 2016).
Analysis
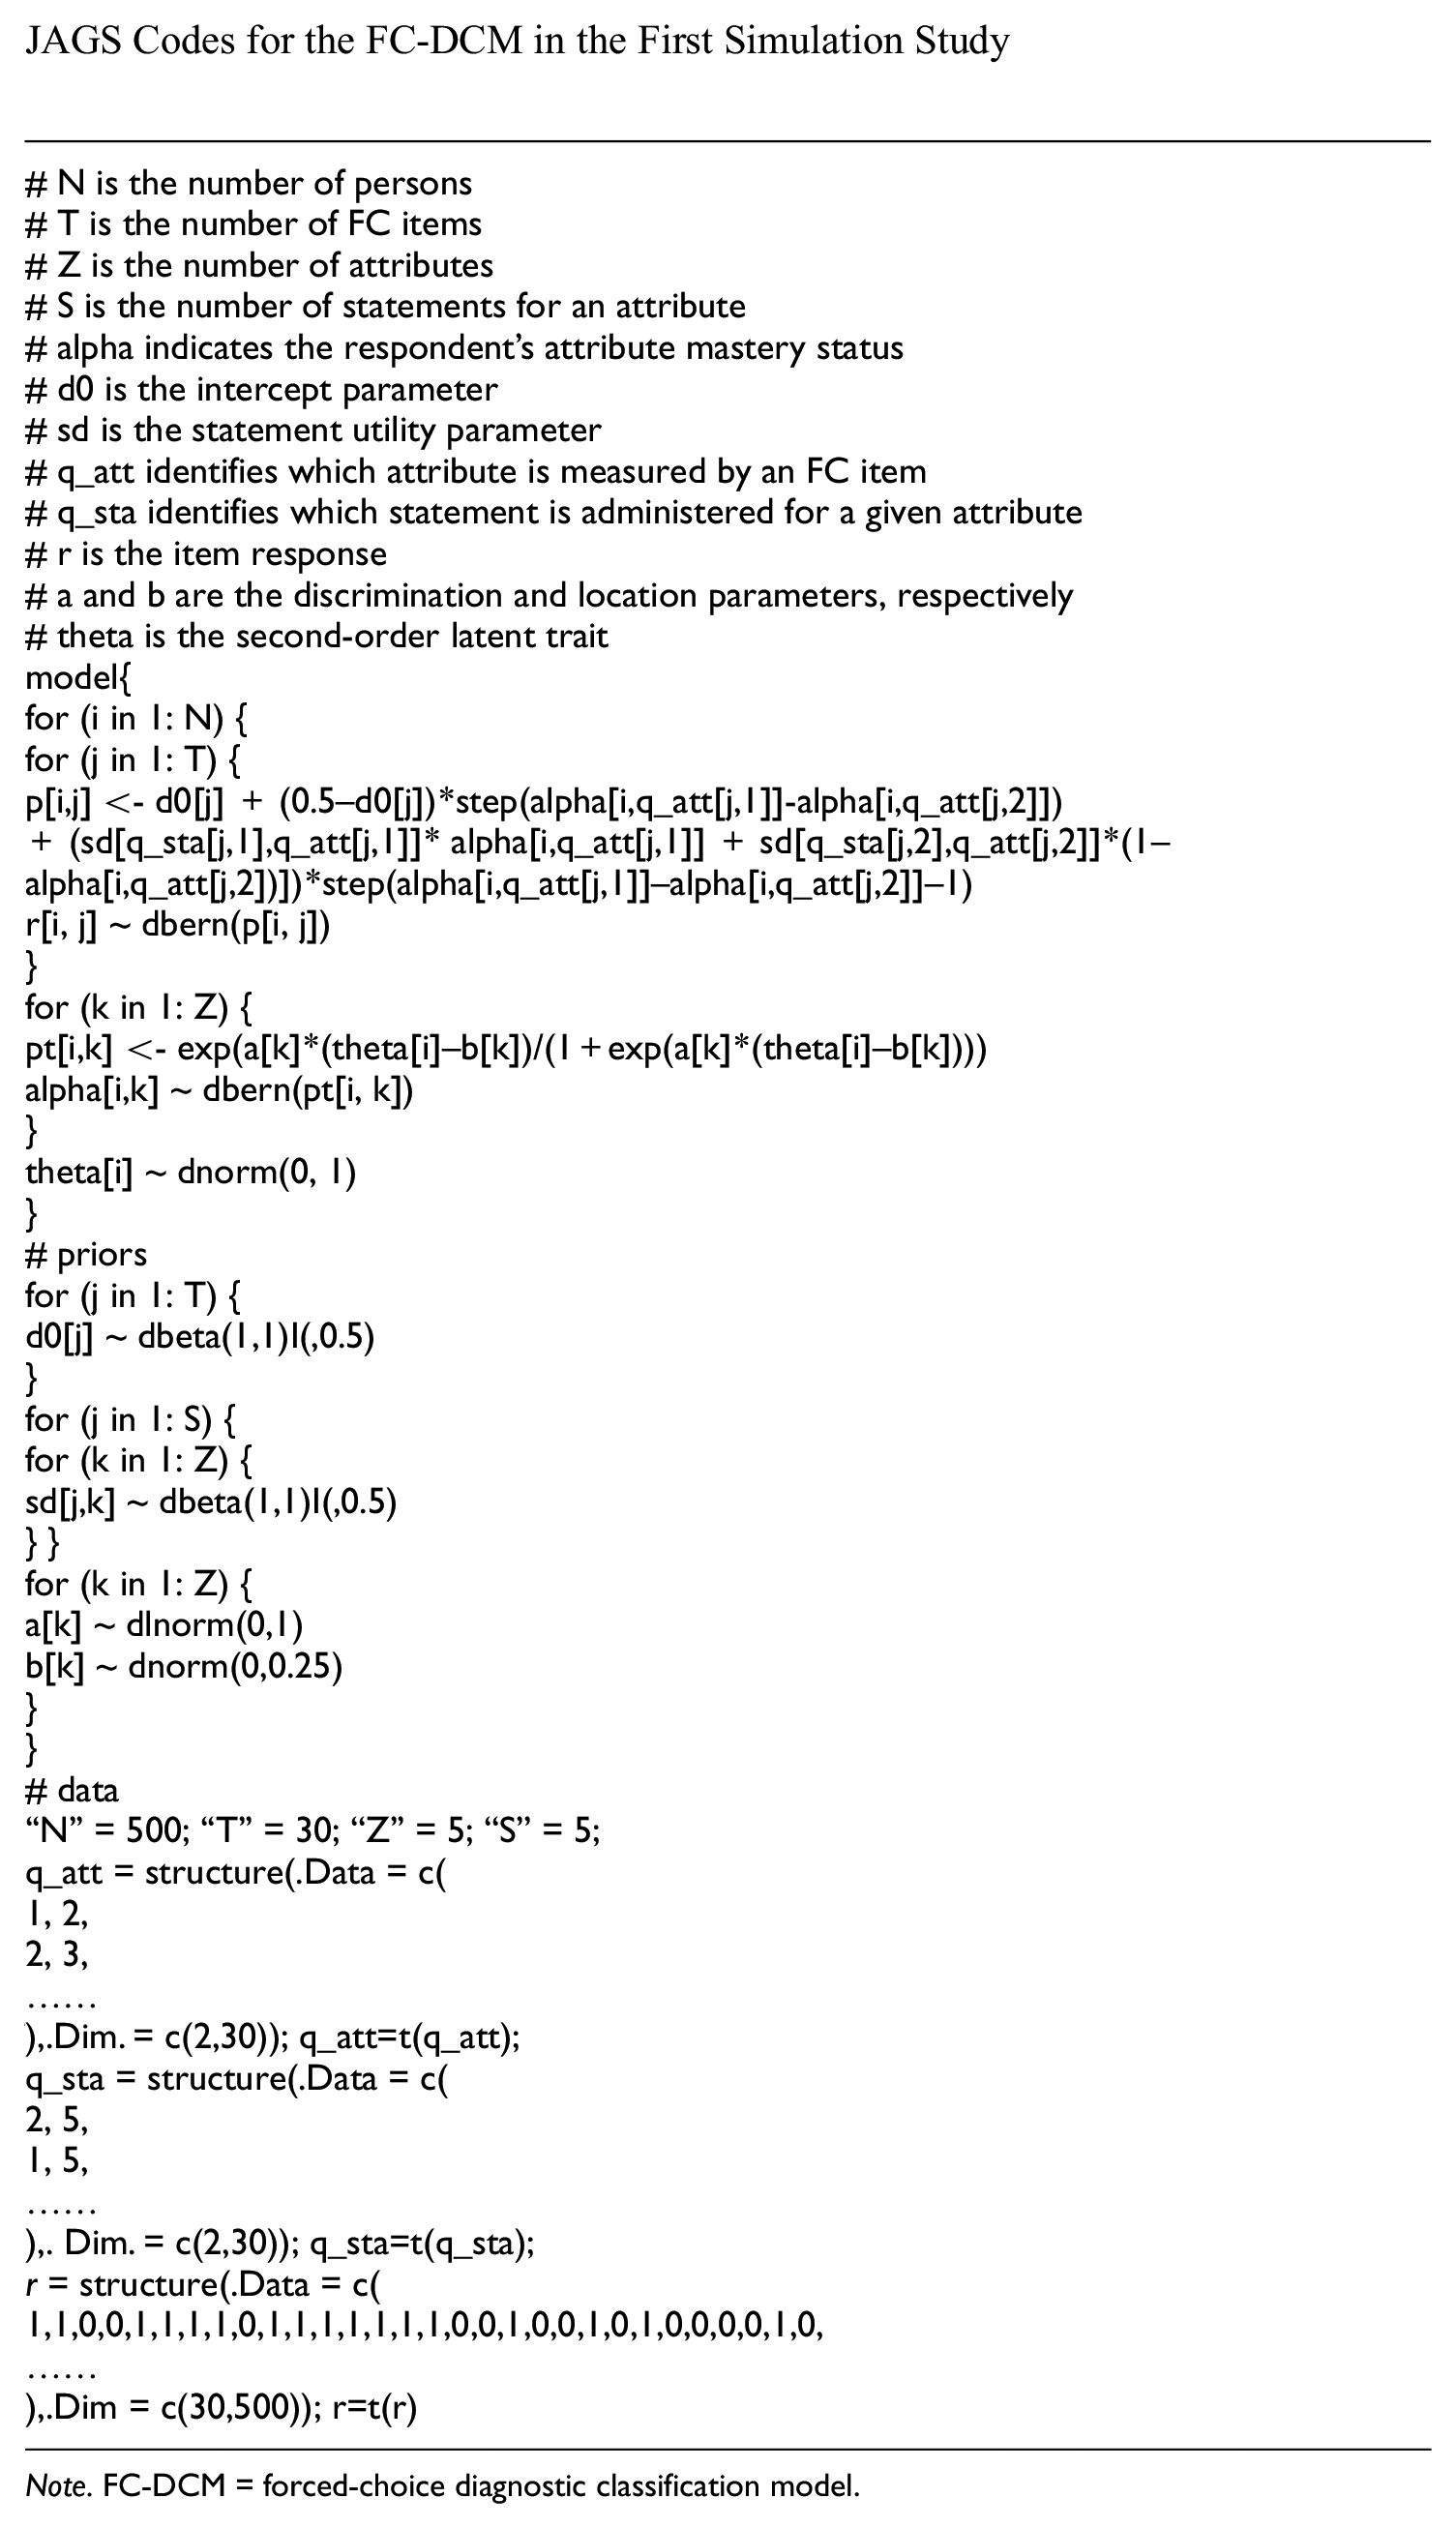
All the parameters in the FC-DCM were calibrated using Just Another Gibbs Sampler (JAGS) (Plummer, 2003) with Bayesian methods. Prior distributions for each model parameter should be specified and then combined with a statistical model and data responses to produce the joint posterior distributions of parameters for model parameter calibration. For the item and statement utility parameters, a beta prior with both hyperparameters equal to 1 was set for both the intercept and statement utility parameters with a truncated distribution between 0 and .5. For the second-order structural parameters, a normal prior distribution with a mean of 0 and a variance of 4 was used for the location parameters, and a lognormal distribution with a mean of 0 and a variance of 1 was used for the discrimination parameters. The choices of the priors for the model parameters were similar to those in the DCM literature that use a Bayesian estimation for model parameter estimation (e.g., Huang, 2017; Huang & Wang, 2014). The JAGS codes for the first simulation study are available and are listed in Appendix B.
Some notes should be provided regarding the JAGS syntax as follows. As in DCMs modeled with a confirmatory approach, a measurement component and a structural component should be identified for the FC-DCM. First, with respect to the measurement component, the responses of the pairwise-comparison items are determined by the subject’s mastery status of the prespecified attributes and the statement utility parameters, whose formulation is similar to JAGS programming for a variety of DCMs in the literature (e.g., Zhan et al., 2019). Second, the structural component can be specified by signifying the relationship between latent attributes, and we implement an IRT model by assuming that a second-order latent continuous latent trait accounts for the associations among latent attributes under the higher-order DCM framework (de la Torre & Douglas, 2004). Because the number of latent classes (the attribute mastery profiles) and the characteristics of each class are defined prior to the analysis, the FC-DCM is a confirmatory rather than an exploratory restricted latent class model. Therefore, the FC-DCM can be considered a variant of multiple classification latent class models under the higher-order factor-structure framework (see Templin & Henson, 2006).
Using the multivariate potential scale reduction factor (Brooks & Gelman, 1998) with three parallel chains, we discarded the first 5,000 iterations as burn-in and adopted the subsequent 10,000 iterations to produce the mean of the marginal posterior density for each model parameter as the parameter estimate. No multiple nodes or label switching were observed in the simulation and empirical analyses. The quality of the parameter estimation was evaluated by computing the bias and root mean square error (RMSE) for the model structural parameters and by computing the RMSE for the second-order latent trait parameter. In addition, the correct classification rate for each individual attribute (CCR-A) and attribute pattern (CCR-P) was computed to assess the recovery of the respondent’s attribute mastery status on a single attribute and the overall profile level. It is expected that the precision of parameter estimation will improve as the number of sample sizes, test lengths, attributes, and statements increases and that when each statement measures two attributes simultaneously, the specific-attribute condition can provide a better parameter estimation than the overlap-attribute condition because of the purified information provided in statements with distinct attributes.
Results
To respect the space constraints, this section summarizes the results by computing the means and standard deviations of the bias and the RMSE for the structural parameter estimates to assess the quality of the parameter estimation. Tables 1 and 2 show the bias and RMSE values for the comparative statements that measure one attribute in the FC items in the 5- and 10-attribute conditions, respectively. The proposed FC-DCM provided good parameter recovery, as indicated by the rather small bias values. With respect to the second-order attribute parameters (i.e.,
Statistical Summary of the Structural Parameter Recovery for Statements Measuring One Attribute From Five Attributes
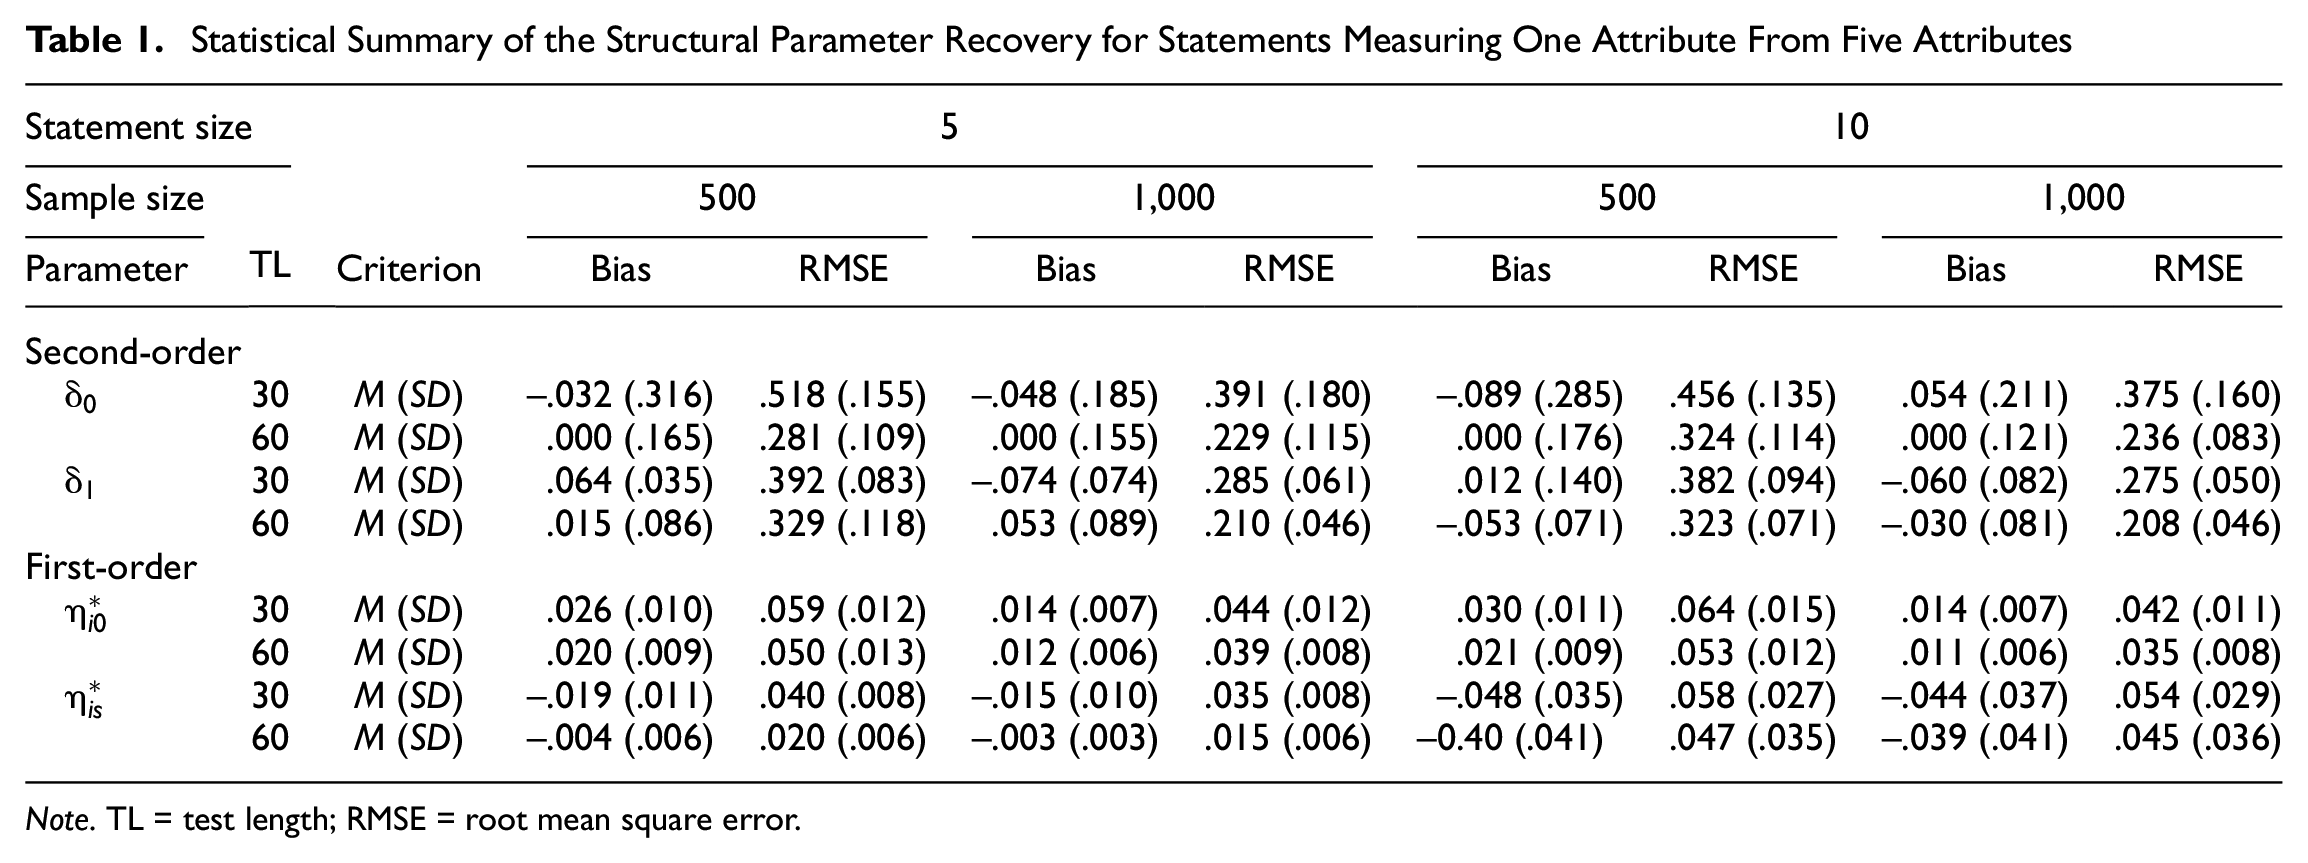
Note. TL = test length; RMSE = root mean square error.
Statistical Summary of the Structural Parameter Recovery for Statements Measuring 1 Attribute From 10 Attributes
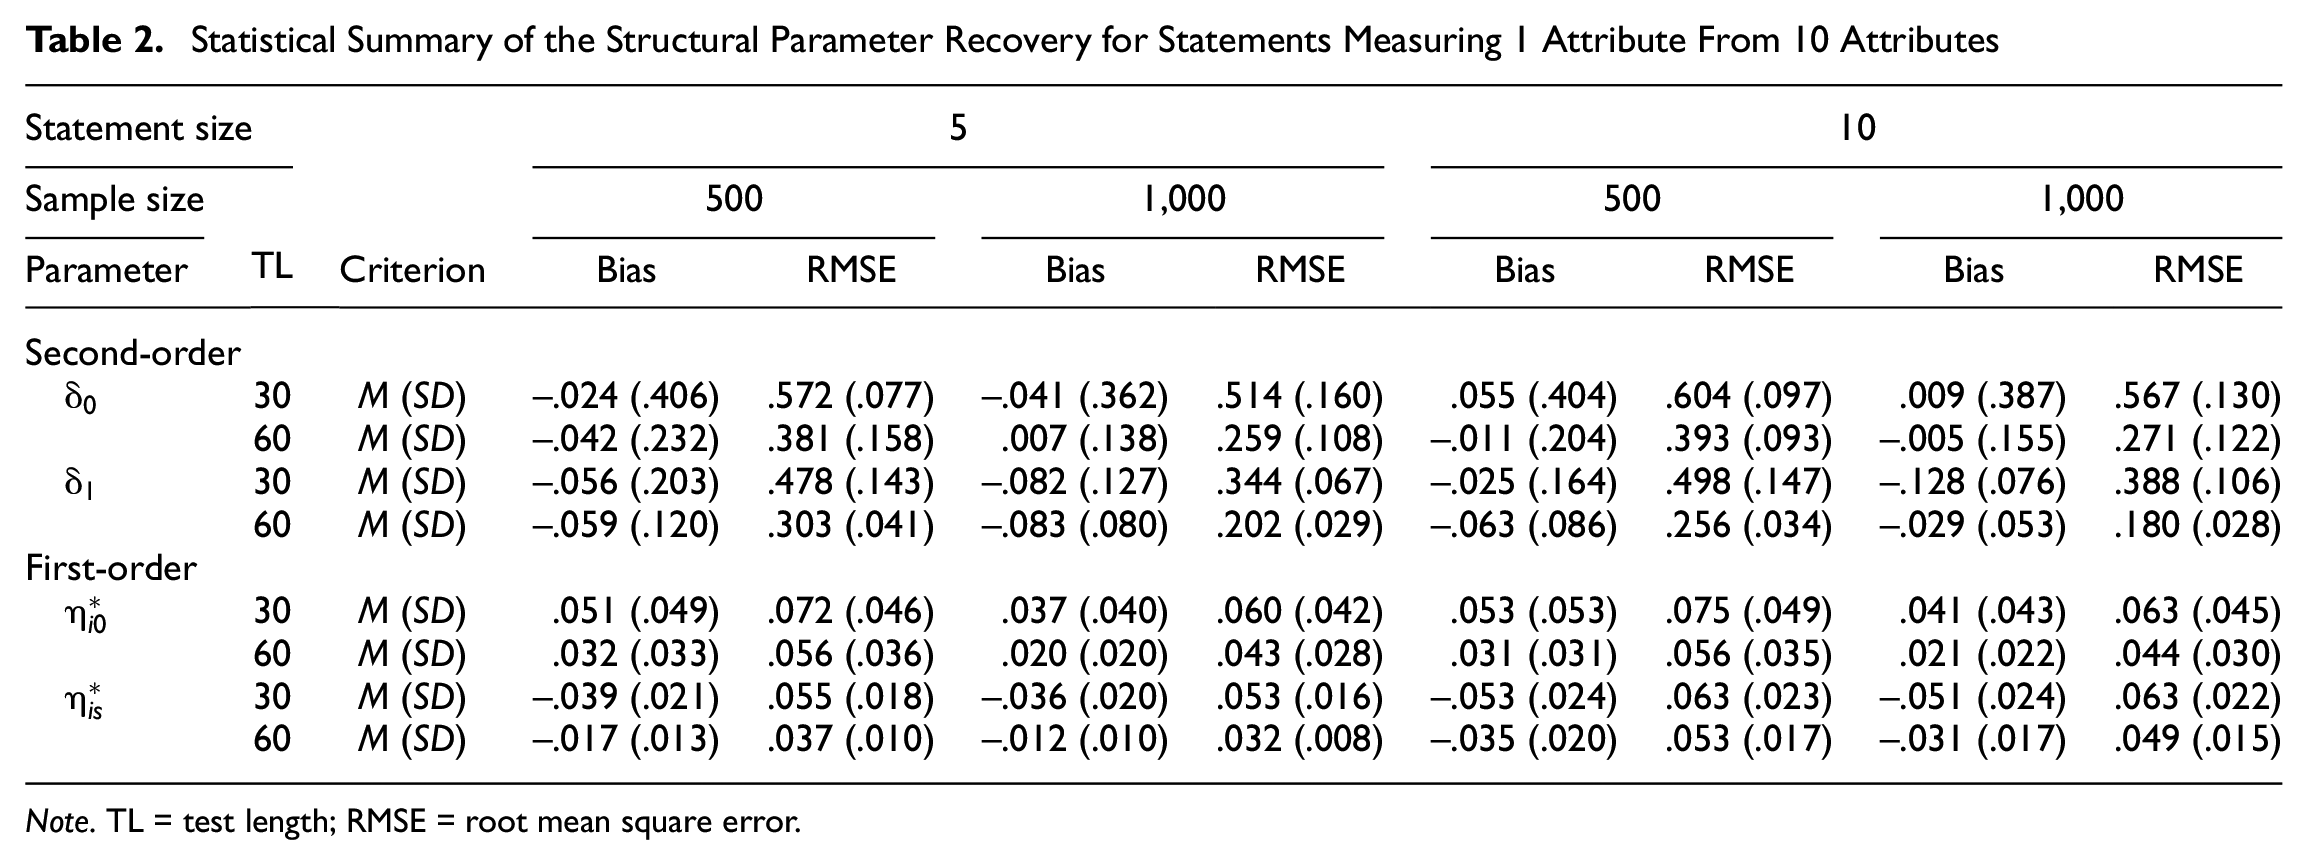
Note. TL = test length; RMSE = root mean square error.
The person parameter recovery was examined by inspecting the mean CCR-A and CCR-P and the mean RMSE values of the second-order latent trait estimate across 30 replications, which are listed in Table 3. The top half of Table 3 corresponds to the results of the first simulation study in which a statement was built to load on an attribute in pairwise-comparison items. With respect to CCR-A and CCR-P, as expected, a long test length resulted in higher classification accuracy, whereas the reverse effect was observed as the number of attributes increased from 5 to 10. There were few clear systematic patterns between the small and large sample sizes and between the small and large statement sizes. A long test length was also associated with a more precise second-order latent trait estimation when 10 attributes were used than when 5 attributes were used. Although the second-order latent trait parameters appeared to be recovered poorly due to their larger RMSE values, this result was not surprising because the precision of the second-order latent trait estimation largely depends on the amount of information that the attributes provide. The deteriorated estimation would be expected to be mitigated when a larger number of attributes is used to produce more test items (Hsu & Wang, 2015; Huang, 2020).
Statistical Summary of the Person Parameter Recovery for the Simulated Data
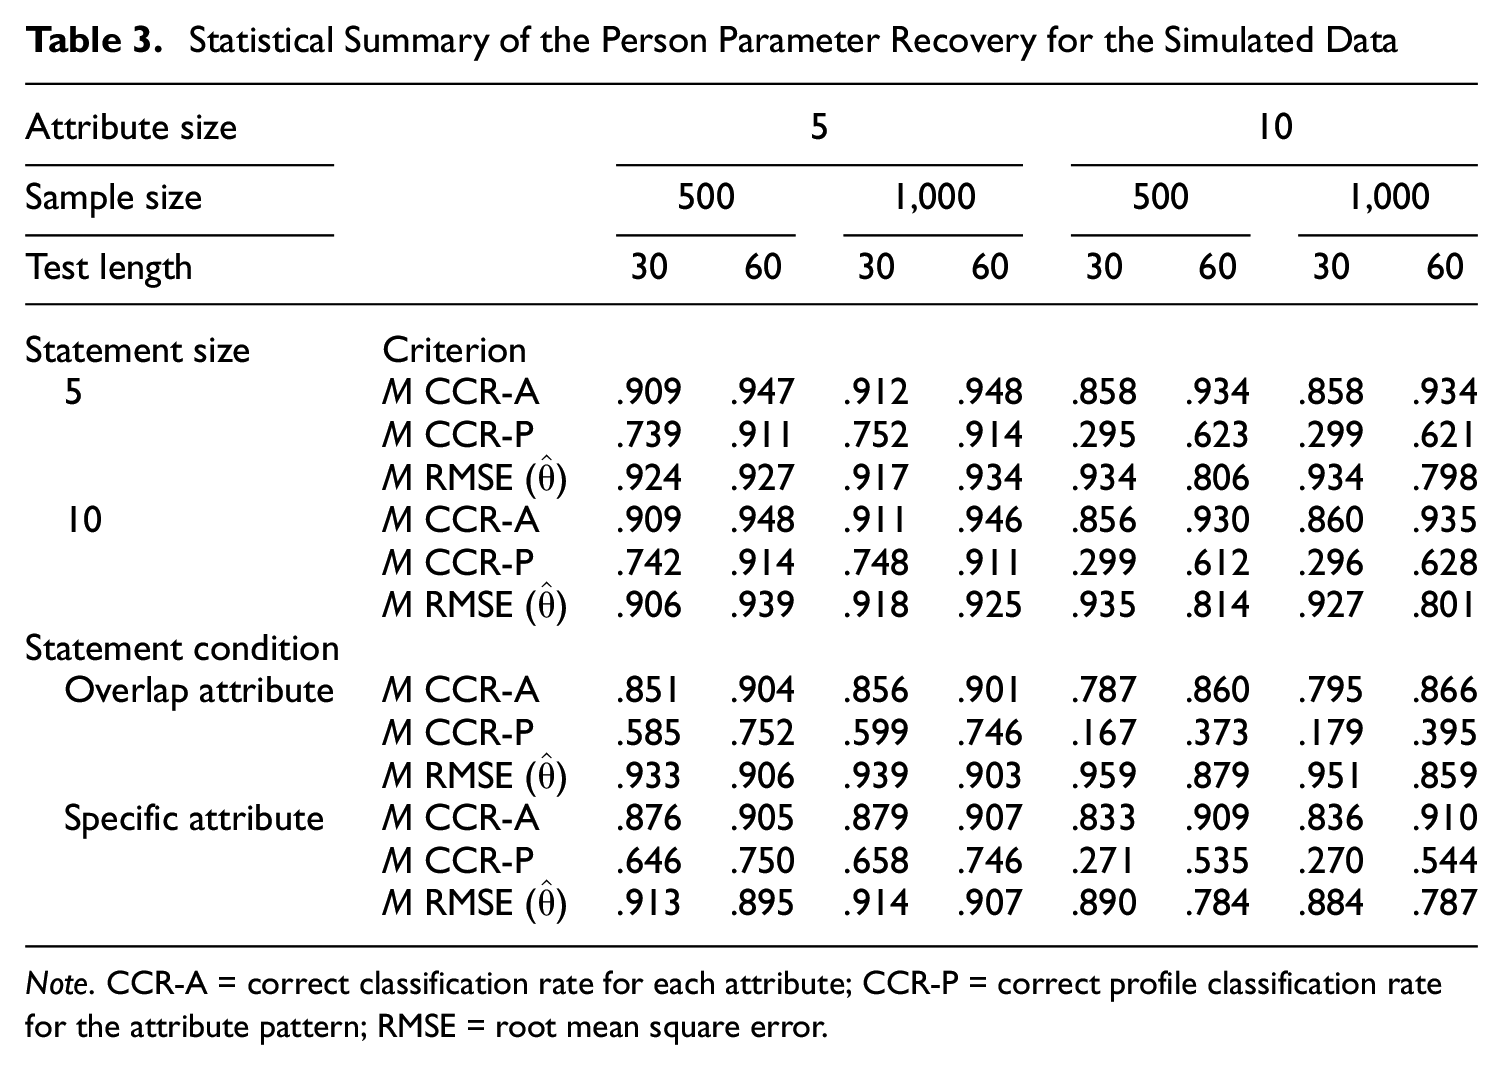
Note. CCR-A = correct classification rate for each attribute; CCR-P = correct profile classification rate for the attribute pattern; RMSE = root mean square error.
The second simulation study allowed each comparative statement to measure two attributes. The recovery of the structural parameters of the model is summarized in Tables 4 and 5 for the 5- and 10-attribute conditions, respectively. Generally, parameter recovery patterns similar to the first simulation study were observed for both attribute conditions. Except for some cases in the 10-attribute condition, the bias values were very small. As expected, for most simulation conditions, a large sample size and long test length produced smaller RMSE values and yielded a better parameter recovery. The specific-attribute condition appeared to provide a more precise estimation than the overlap-attribute condition, which indicates that the comparative statements that measure distinct attributes can result in purified diagnostic information between comparison attributes and are recommended for use when pairwise-comparison items are characterized by within-statement multidimensionality. Furthermore, the 10-attribute condition was more vulnerable than the 5-attribute condition to the use of overlap-attribute statements for the location and discrimination parameters because the bias values were slightly larger in the 10-attribute condition with overlap-attribute statements, as shown in Table 5.
Statistical Summary of the Structural Parameter Recovery for Statements Measuring Two Attributes From Five Attributes
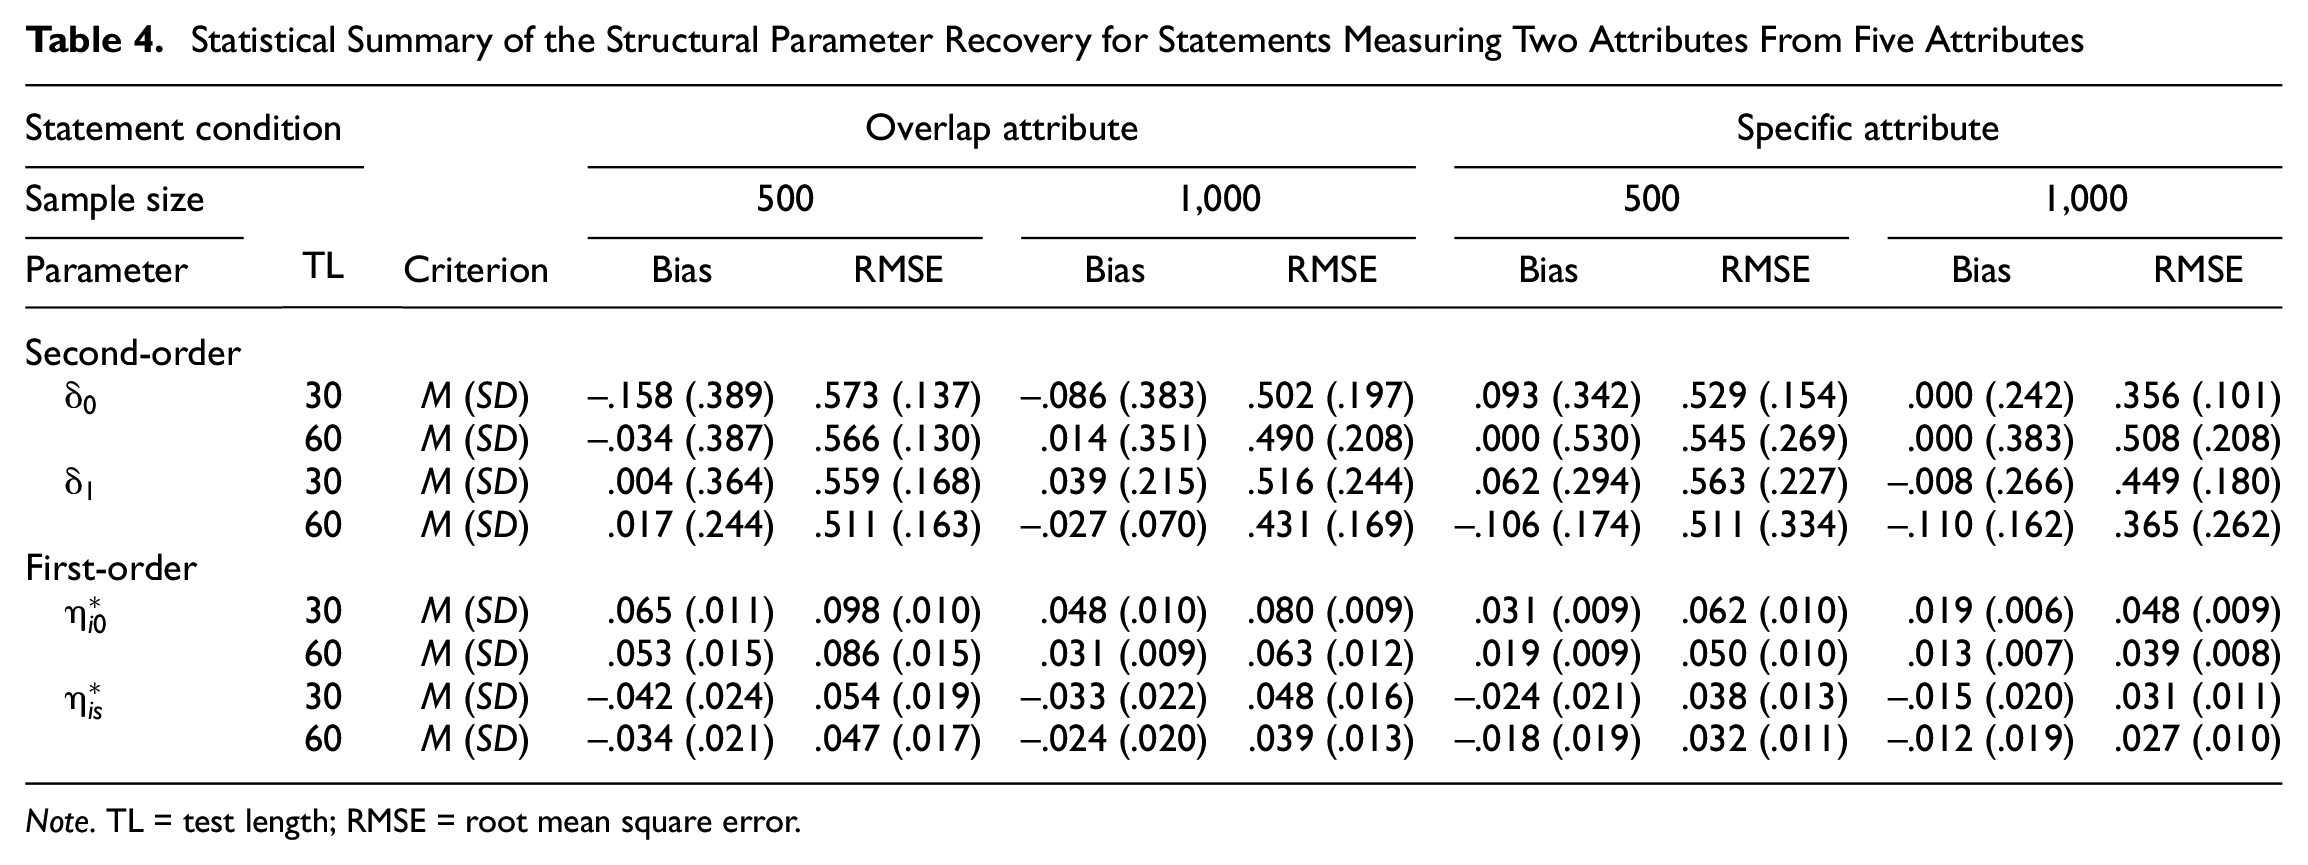
Note. TL = test length; RMSE = root mean square error.
Statistical Summary of the Structural Parameter Recovery for Statements Measuring 2 Attributes From 10 Attributes
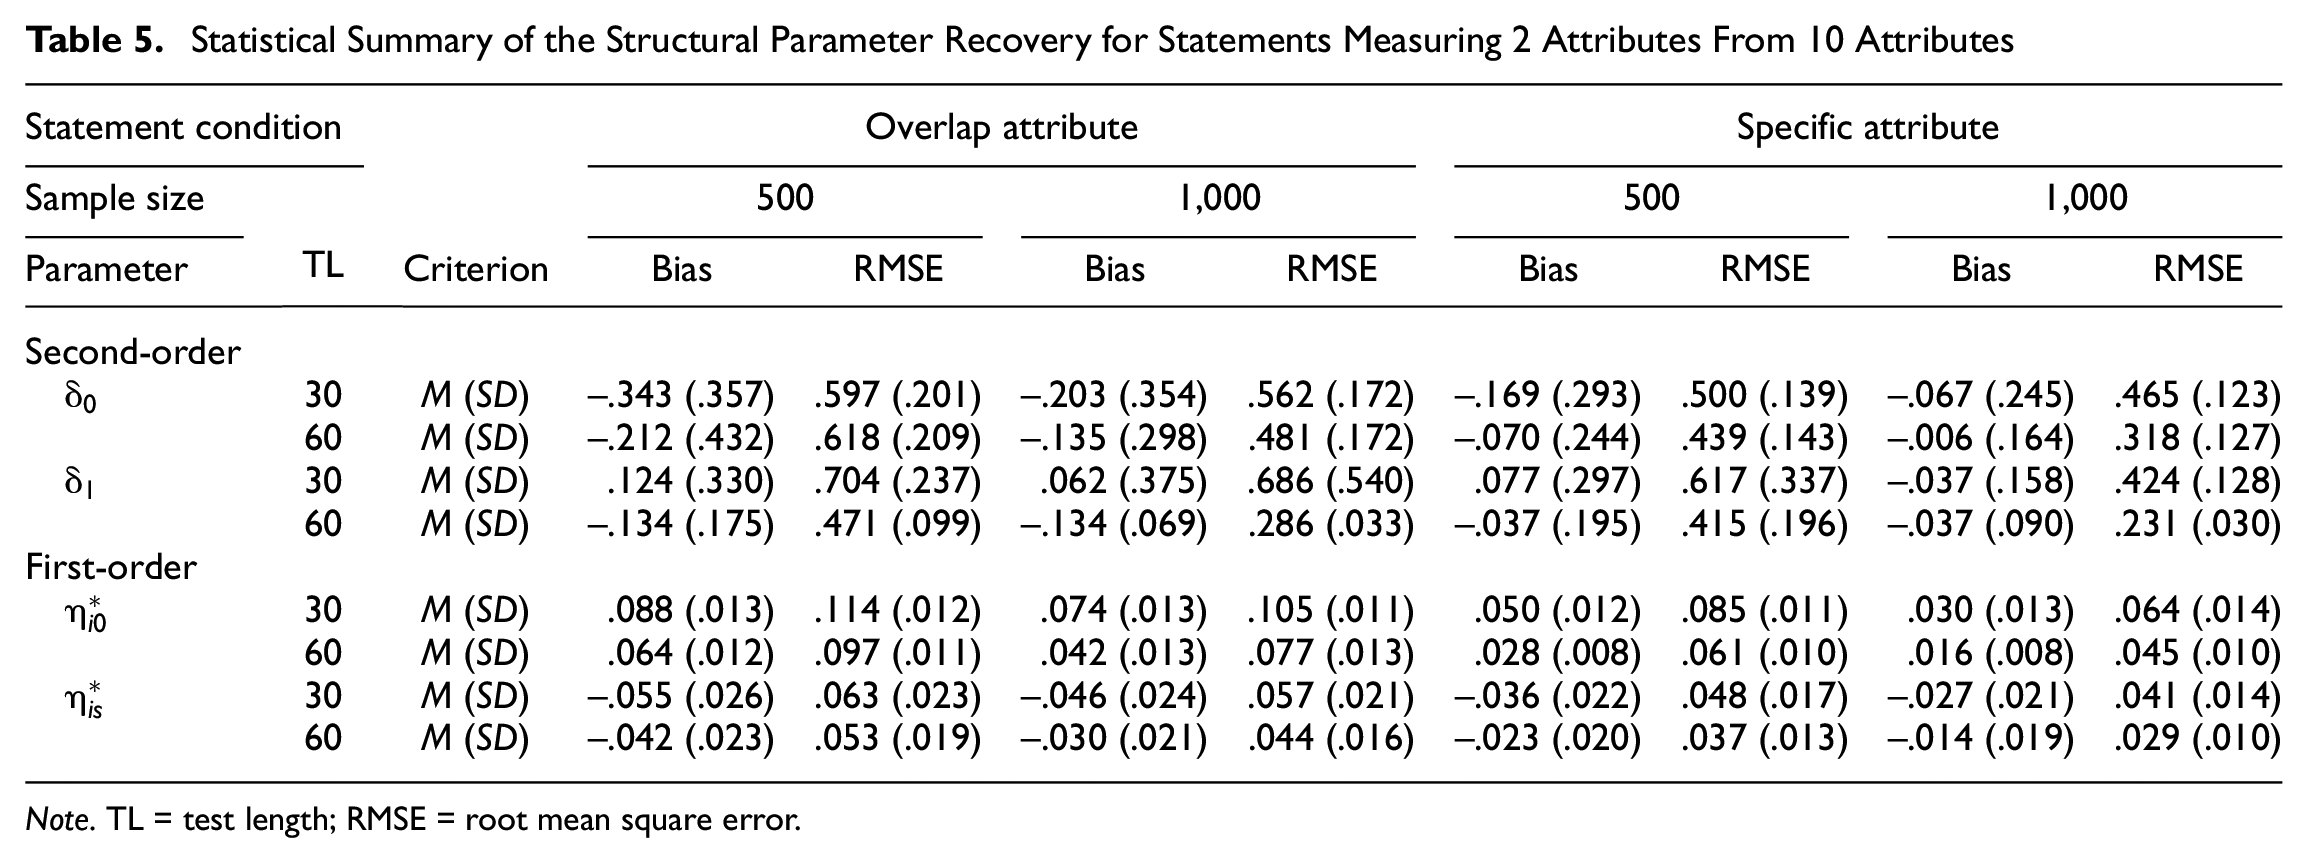
Note. TL = test length; RMSE = root mean square error.
The bottom half of Table 3 shows the mean CCR-A and CCR-P for evaluating the attribute mastery recovery and the mean RMSE values for assessing the second-order latent trait recovery in the second simulation study. For most of the manipulated conditions, the mean percentages of the correct attribute classifications increased as the test length increased from 30 to 60 items and when specific-attribute statements were used, whereas the mean correct classification rates decreased as the number of attributes increased from 5 to 10. With respect to the
The results of the two supplementary simulations are summarized in Table 6 and provide a comparison to the first simulation study in which the same manipulated conditions were considered (i.e., 1,000 persons’ responses to 60 items with five statements that measure five attributes). When the
Statistical Summary of the Parameter Recovery for the Two Supplementary Simulations
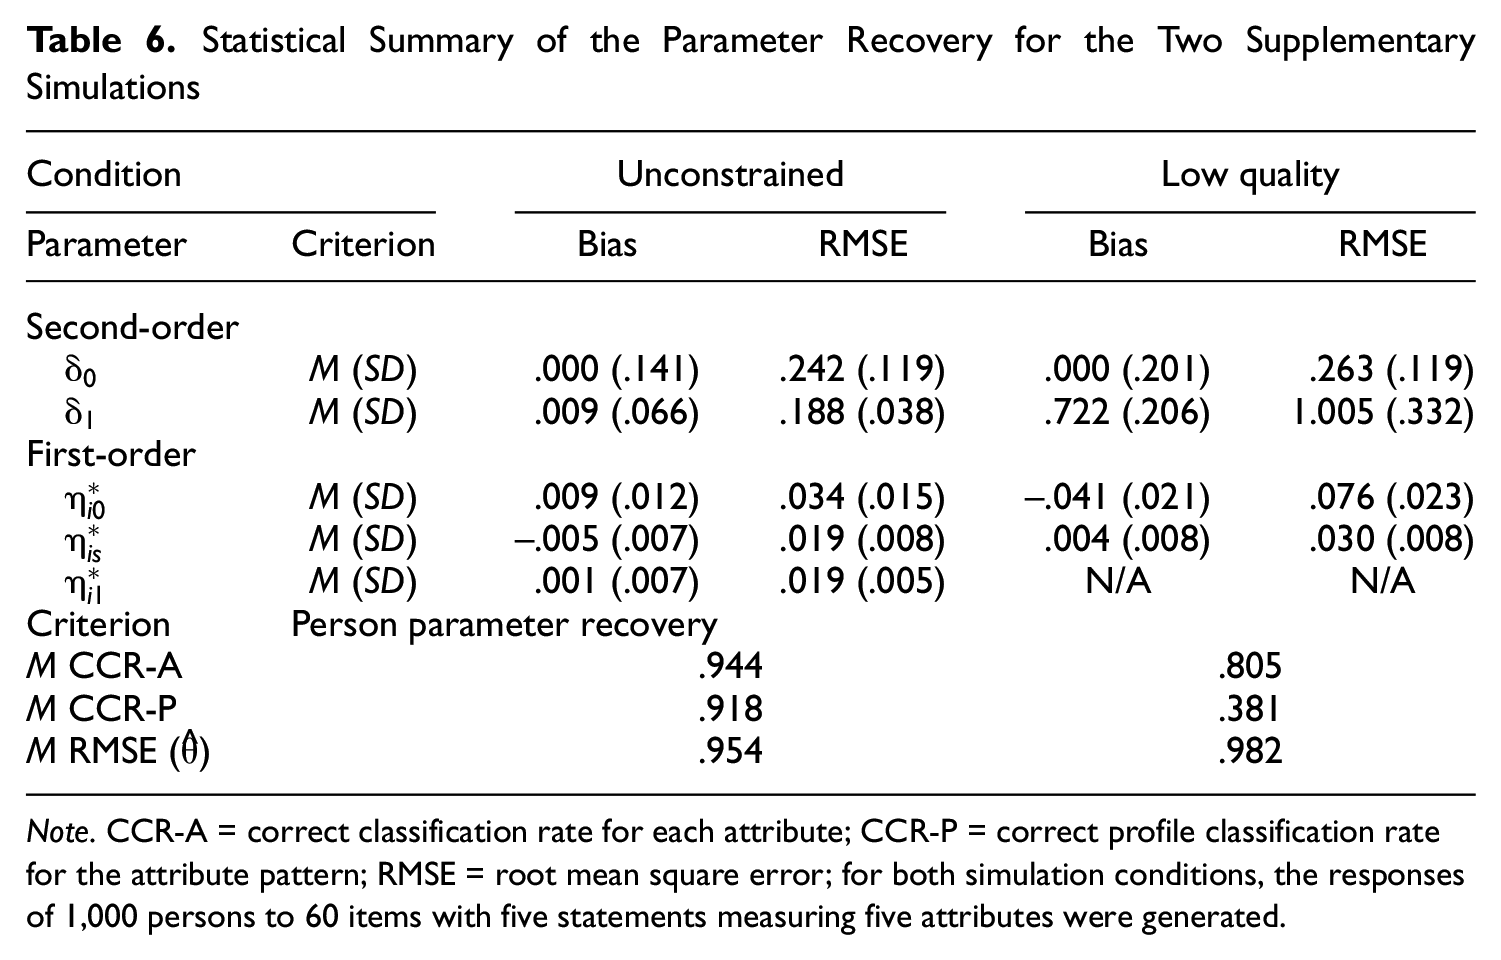
Note. CCR-A = correct classification rate for each attribute; CCR-P = correct profile classification rate for the attribute pattern; RMSE = root mean square error; for both simulation conditions, the responses of 1,000 persons to 60 items with five statements measuring five attributes were generated.
Finally, the consistency of the estimator with respect to the statement and population parameters (which are indicative of the first- and second-order parameters, respectively) was evaluated in a set of simulations with different sample sizes. If the parameter estimates recover to their generated values as the sample size increases, then this can provide numerical evidence for FC-DCM identifiability (Xu & Zhang, 2016). As shown in Figure 2, all estimation curves present similar consistency patterns, and the mean RMSEs across the estimates for each of the four types of parameters (i.e.,
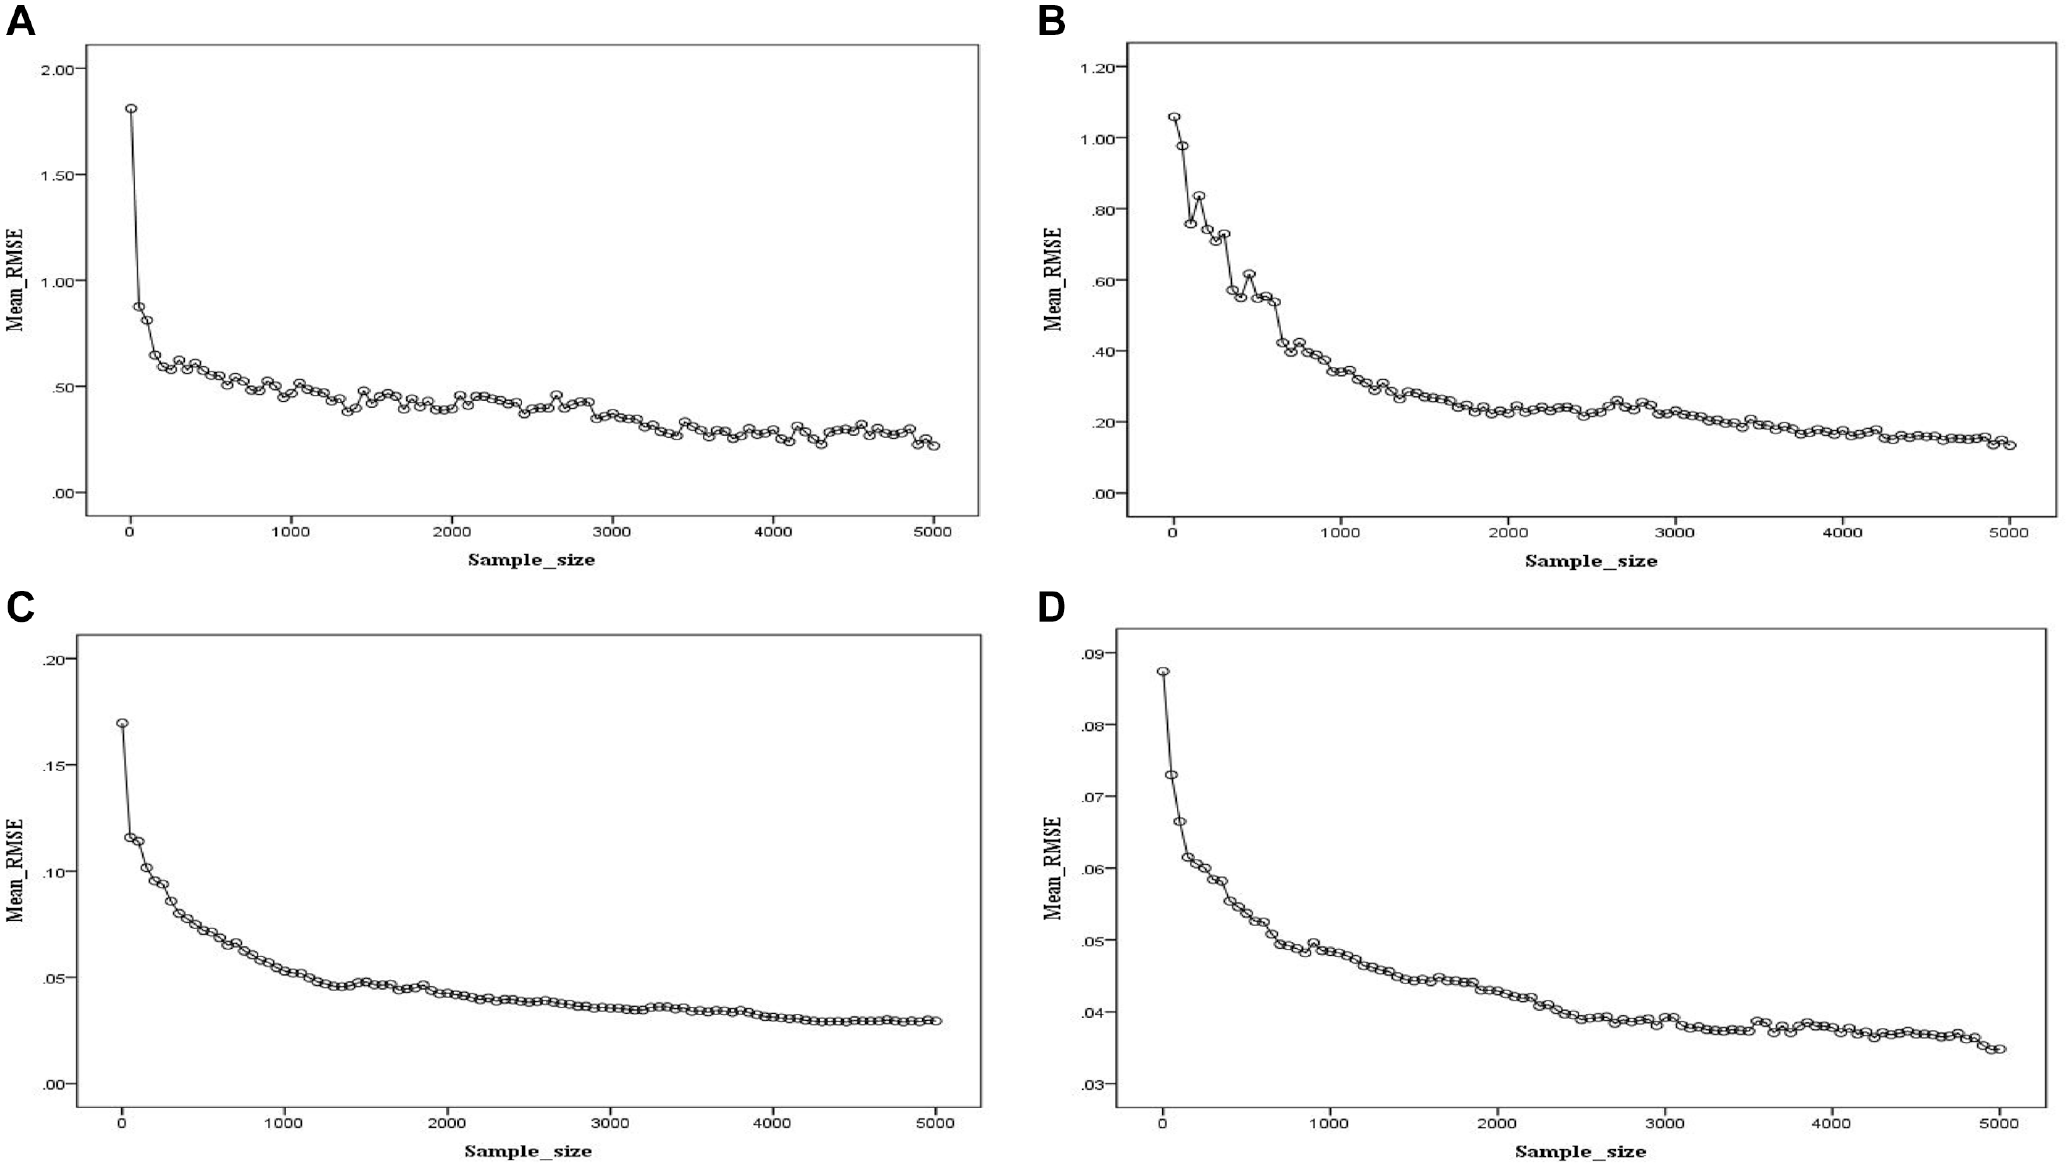
Changes in the Values of the Mean RMSE as the Sample Size Is Increased. (A) Attribute Location Parameter, (B) Attribute Discrimination Parameter, (C) Item Intercept Parameter, (D) Statement Utility Parameter
Demonstrative Example
Nine broad features that relate to the work environment were developed to measure the degree of applicants’ work motivation. Respondents were asked to rank the nine features according to their judgment of the importance of the feature in an ideal job environment (Yang et al., 2010). The ranking data were collected based on 1,080 respondents. Maydeu-Olivares and Brown (2010) used a TIRT model to fit the transformed binary data with 36 paired comparison items and found that the TIRT provided acceptable model-data fit when an underlying latent trait (i.e., work motivation) was assumed to govern these work features. In this demonstrative analysis, nine job features, (1) a supportive environment, (2) challenging work, (3) career progression, (4) ethics, (5) personal impact, (6) personal development, (7) social interaction, (8) competition, and (9) work security, are treated as measuring distinct attributes, and the proposed FC-DCM is used to fit the FC data with pairwise-comparison items.
Note that the work-motivation assessment data were collected under a traditional test theory framework that aims to create a single score for a large content domain, and they were analyzed with the TIRT model to achieve the measurement goals (Maydeu-Olivares & Brown, 2010) rather than being used for the purposes of diagnostic classification. In such situations, retrofitting DCMs to data responses obtained from the assessment that are not initially developed for diagnostic purposes serves as a plausible approach to obtain diagnostic information and has been used widely in applied settings (e.g., de la Torre, 2011; Huang, 2017; Lee et al., 2011; Templin & Henson, 2006). Although the analysis results based on the TIRT appear to show that a unidimensional latent trait underlies the item responses, evidence from the cumulative literature has indicated that few data sets can reflect pure unidimensionality (Thissen, 2016) and a larger construct can be theoretically broken down into a variety of subdomains and attributes (R. Liu et al., 2017). It is not uncommon for the data from a unidimensional IRT-based test to fit a DCM by identifying attributes in terms of test specifications or item characteristics in retrofitting contexts (Ravand & Baghaei, 2020). Therefore, the nine features were considered to be different diagnostic attributes, and these features were selected repeatedly to form pairwise-comparison items. Specifically, an attribute was measured multiple times, and more information was attainable through multiple comparisons across attributes. For more detailed procedures on retrofitting in DCMs, interested readers are advised to refer to the study performed by R. Liu et al. (2017).
Because one statement that represents each latent attribute was repeatedly compared in the paired comparison items and a higher-order structure is assumed to account for the relationship between attributes in the fit of the FC-DCM, four research questions arise regarding measurement invariance with respect to the discrimination and statement utility parameters, which generates four variants of the FC-DCM to be compared with respect to the model-data fit. When imposing equivalence constraints on both the discrimination parameters across attributes and the statement utility parameters across paired comparison items, a restricted version of the FC-DCM can be formulated and is denominated as the restricted FC-DCM. When only the invariance assumption of the discrimination parameters is maintained across attributes, the restricted FC-DCM extends to the FC-DCM with discrimination invariance. In contrast, the FC-DCM with statement utility invariance arises by constraining only the statement utility parameter of the same attribute to be equal across paired comparison items.
Finally, the saturated FC-DCM emerges by allowing both the discrimination and statement utility parameters to be estimated freely across attributes and comparative items and serves as the most general formulation of the FC-DCM in the fit of the data. The Akaike information criterion (AIC) and Bayesian information criterion (BIC) were computed and compared for the selection of the better-fitting model. In addition, posterior predictive model checking was conducted to provide evidence of the model-data fit in an absolute sense by assessing the plausibility of the replicated data against the observed data during numerous iterations based on the classic item difficulty (i.e., the proportion of endorsement of each item) that has previously been used in the Bayesian scheme for evaluating the fit of DCMs (Huang, 2017).
As with the analysis procedure used in the simulation study, the results showed that the restricted FC-DCM produced a better fit to the data due to its smaller AIC and BIC values (AIC = 24,990 and BIC = 25,270) than the FC-DCM with statement utility invariance (AIC = 25,010 and BIC = 25,320), followed by the FC-DCM with discrimination invariance (AIC = 25,290 and BIC = 25,880) and the saturated FC-DCM (AIC = 25,310 and BIC = 25,930). The mean absolute difference of the proportion of item endorsement obtained between the replicated data and the observed data over the interactions across items was close to zero, which indicates that the restricted FC-DCM yielded an absolutely appropriate fit to the data.
Under the best-fitting FC-DCM, the common attribute discrimination parameter was estimated to be .291, the item intercept parameters were estimated to be between .003 and .019 (M = .008), and the statement utility parameters were all estimated to be approximately .249. Regarding the attribute location parameters, the parameters were estimated to be −2.525, −2.462, −2.172, −2.340, .752, −4.064, .837, 4.938, and 4.379 for the nine attributes, which suggests that the applicants who were higher on the latent continuum that represents work motivation perceived the importance of the “competition” attribute in the work environment, whereas those lower on the latent continuum treated the “personal development” attribute as a significant feature in their ideal job. Corresponding to the higher-order structural parameter estimation, it was found that the proportions of applicants who judged the nine attributes as important job characteristics were .674, .670, .651, .662, .445, .764, .439, .140, and .218, which indicates that the “personal development” and “competition” attributes represented the most and least important working characteristics for applicants’ work motivation, respectively. Furthermore, the correlations between each pair of attributes were estimated to be between −.359 and .152 (M = −.117); this range covers negative and positive values due to the ipsative measurement property (Aitchison, 1986) and is similar to the findings of the dimension correlations that use IRT-based FC models (e.g., Bürkner et al., 2019; Chen et al., 2020).
In the TIRT analysis of the same data, Maydeu-Olivares and Brown (2010) found that the characteristics of a supportive environment, challenging work, and career progression were the three predominant indicators that relate to general work motivation and that the three features of social interaction, competition, and work security were the least strongly related to work motivation. Although there were some differences in the judgment of importance among these job features between the TIRT and FC-DCM, the observed similar result patterns for the two distinct methodologies may confirm the validity of the proposed FC-DCM when analyzing the work-motivation ranking data.
Conclusion
The merit of FC item formats for noncognitive assessments has been supported and evidenced by their ability to minimize not only uniform response biases but also extremely favorable responses compared with normative tests, as documented in the recent literature (e.g., Brown & Maydeu-Olivares, 2011; Christiansen et al., 2005, 2013; Stark et al., 2005). Most psychometric models developed for FC items are designed to calibrate respondents on latent continuous trait scales and rarely provide classification information about whether respondents have a certain type of measured variable unless a prespecified threshold is additionally imposed on a latent continuum. In contrast, the DCM facilitates the goal of obtaining diagnostic information regarding classification on multiple attributes but is still susceptible to intentional response biases through improved scores due to the use of single-stimulus items. In this study, based on Thurstone’s law of comparative judgment (Thurstone, 1927), we develop a new class of DCM for pairwise-comparison items (i.e., the FC-DCM) to combine the advantages of FC formats and the DCM by simultaneously controlling for motivated response distortion and providing both a classification of latent binary attributes and an overall evaluation of the latent continuous trait under the higher-order DCM framework. The proposed FC-DCM is flexible for application to practical settings such that a statement that represents one or more attribute(s) can be repeatedly selected for judgments on the pairwise-comparison items, between- and within-statement multidimensionality can be created where appropriate, and conjunctive or disjunctive versions of the FC-DCM can be developed and empirically examined based on a diversity of assumptions.
A series of simulation studies were conducted to assess the parameter recovery and the efficiency of the developed FC-DCM under a variety of manipulated conditions using Bayesian estimation. When each statement was allowed to measure an attribute in the first simulation study, it was observed that the improved model structural parameters were closely associated with a large number of respondents and test items and that the first-order structural parameters (i.e., the statement utility parameters) appeared to be recovered better than the second-order structural parameters (i.e., the location and discrimination parameters). Increasing the number of attributes from 5 to 10 decreases the precision of the model’s structural parameter estimation, whereas increasing the number of statements from 5 to 10 appears to have a less clear and systematic impact on the model’s structural parameter estimation. The major factors that influence the precision of the second-order latent trait estimation and the accuracy of the attribute classification are the number of test items and the measured attributes, with a longer test corresponding to better latent trait and attribute estimations and more attributes resulting in lower attribute classification accuracy but improving the latent trait estimation.
The second simulation study allowed each statement to load on two attributes and manipulated whether the two statements in a comparative item measured a common attribute (i.e., the overlap- and specific-attribute conditions). As in the first simulation, the results show that in most conditions, improved model structural parameters are attainable when a long test length and a large sample size are used and that the first-order model parameters have a better parameter recovery than the second-order model parameters. In addition, the specific-attribute condition produces a better model parameter estimation than the overlap-attribute condition. The effect of the attribute size on the model parameter recovery is the same in the first and second simulation studies. For the person parameter recovery, similar to the first simulation study, both the test length and the number of attributes have a substantial impact on the latent trait and attribute estimation. Unsurprisingly, the specific-attribute condition provides a better parameter estimation than the overlap-attribute condition regardless of the item or person parameters; previous studies have indicated that a simple-structured Q-matrix that arranges each item to measure only one attribute can provide more differentiated information between two cognitive profiles than a complex-structured Q-matrix that arranges each item to measure more than two attributes (e.g., Huang, 2018; C. Wang, 2013). Accordingly, the FC-DCM developed for pairwise-comparison items can provide satisfactory model parameter recovery and accurate person attribute classification when the comparative statements are structured as measuring either a single attribute in a simple-structured Q-matrix or distinct attributes in a complex-structured Q-matrix.
The demonstration example was selected from a ranking task that recruited job applicants to order nine work environment features in terms of their importance in an ideal job, with the outcome measures used as an indicator of general work motivation. The ranking data were transformed into 36 paired comparison items. Maydeu-Olivares and Brown (2010) used the TIRT model to fit comparative data and found that the TIRT model that assumes a common underlying trait provided an acceptable model-data fit. In our analysis, the nine broad features were treated as latent attributes governed by a common second-order latent trait, and the same comparative data were fit to the FC-DCM. Four variants of the FC-DCM were proposed in terms of different assumptions of model parameter equivalence and compared with respect to the goodness of fit to the data. In the best-fitting model, the results revealed that job applicants tend to judge the “personal development” attribute as the most important feature in the work environment and the “competition” attribute as the least important feature. The ordering of the proportion of each attribute by the applicants in the FC-DCM appears to be similar to the ordering of the strength of the relationship between each feature and the common trait in the TIRT analysis. The main difference between the FC-DCM and TIRT analyses is that the FC-DCM can both classify respondents into different categories for each attribute with diagnostic information and provide an overall evaluation on a latent continuous scale with summative assessment purposes, while the TIRT merely satisfies the needs of the latter case. Note that the empirical analysis included one statement for each measured attribute. Although the number of statements used for the pairwise-comparison items appeared to be less influential in parameter recovery in the simulation studies, the results should be interpreted with caution, and more statements are recommended to increase the diversity of attribute measures.
To model the dependencies between attributes, we use the higher-order DCM and assume that a general latent trait determines the probability of mastering each of the attributes for respondents when local independence is satisfied for attribute mastery conditional on the more broadly defined latent trait (de la Torre & Douglas, 2004). In addition to the major advantages of greatly reducing the estimation complexity compared with the saturated model and simultaneously obtaining an overall ability assessment and discrete attribute classification, the higher-order variable is analogous to the overall unidimensional IRT score and may be promising for retrofitting DCMs to IRT-based data, as is the case with our empirical demonstration (R. Liu et al., 2017). If some type of attribute hierarchy, such as psychologically sequential attribute mastery, is observed (see Leighton & Gierl, 2007), then a reduced saturated model may provide an alternative approach to modeling the relationships of attributes by constraining zero probability for the impermissible attribute profiles. Other methods, such as log-linear parameterization (Rupp & Templin, 2008) and tetrachoric parameterization (Hartz, 2002), are also available and can be directly applied to the new FC-DCM to account for attribute associations.
Directions for further development and the extension of the FC-DCM are provided for future research. First, although the FC-DCM together with a specified Q-matrix provides consistent parameter estimation in our study, further work on identification and estimation issues based on solid mathematical foundations is necessary to indicate the diverse conditions under which the model parameters are identifiable from the data. Second, dichotomously discrete latent variables are used as indicators of whether respondents possess a specific attribute. These are most commonly observed in the DCM literature and are implemented in our developed FC-DCM. In some cases, polytomous attributes that allow individuals to be divided into multiple categories may provide additional diagnostic information (Chen & de la Torre, 2013; Sun et al., 2013) and can be extended to the FC-DCM. Third, the FC formats were limited to comparative items in this study, and paired comparison outcomes were obtained by transforming the ranking data. However, not all paired comparison items can be converted into rankings due to a possible intransitive pattern (Maydeu-Olivares & Brown, 2010). In addition, FC models for ranking data have recently been proposed and provide a more efficient estimation than comparative data (Joo et al., 2018; W.-C. Wang et al., 2016). Establishing an FC-DCM for ranking data would be an encouraging and valuable area for future research. Fourth, from the perspective of testing efficacy, it is desirable to apply the FC-DCM to CAT by combining the advantages of FC formats, DCMs, and CAT. As observed in the simulation studies, the second-order latent trait is not estimated satisfactorily because a limited number of attributes are commonly used in DCMs such that the latent continuous trait cannot be precisely estimated (Hsu & Wang, 2015). With the popularity of computer technology, the response times of respondents can be routinely recorded and used as collateral information to facilitate the precision of person and item measures in higher-order DCMs (Huang, 2020; Zhan et al., 2018). How to implement response times to improve the parameter estimation in the FC-DCM and the effectiveness of incorporating additional information in the estimation process would be interesting topics for future research.
Footnotes
Appendix A
Q-Matrix for 30 Items Measuring 10 Attributes, With Each Attribute Having Five Statements
| Item | attribute | |||||||||
|---|---|---|---|---|---|---|---|---|---|---|
| 1 | 2 | 3 | 4 | 5 | 6 | 7 | 8 | 9 | 10 | |
| 1 | 1-1 | 2-2 | ||||||||
| 2 | 1-1 | 2-2 | ||||||||
| 3 | 2-2 | 1-1 | ||||||||
| 4 | 2-2 | 1-1 | ||||||||
| 5 | 2-2 | 1-1 | ||||||||
| 6 | 1-1 | 2-2 | ||||||||
| 7 | 1-1 | 2-2 | ||||||||
| 8 | 1-1 | 2-2 | ||||||||
| 9 | 2-2 | 1-1 | ||||||||
| 10 | 2-2 | 1-1 | ||||||||
| 11 | 1-3 | 2-4 | ||||||||
| 12 | 1-3 | 2-4 | ||||||||
| 13 | 1-3 | 2-4 | ||||||||
| 14 | 2-4 | 1-3 | ||||||||
| 15 | 2-4 | 1-3 | ||||||||
| 16 | 2-4 | 1-3 | ||||||||
| 17 | 1-3 | 2-4 | ||||||||
| 18 | 2-4 | 1-3 | ||||||||
| 19 | 2-4 | 1-3 | ||||||||
| 20 | 2-4 | 1-3 | ||||||||
| 21 | 1-5 | 2-5 | ||||||||
| 22 | 1-5 | 2-5 | ||||||||
| 23 | 1-5 | 2-5 | ||||||||
| 24 | 1-5 | 2-5 | ||||||||
| 25 | 2-5 | 1-5 | ||||||||
| 26 | 1-5 | 2-5 | ||||||||
| 27 | 2-5 | 1-5 | ||||||||
| 28 | 2-5 | 1-5 | ||||||||
| 29 | 2-5 | 1-5 | ||||||||
| 30 | 2-5 | 1-5 | ||||||||
Note. The number listed on the left-hand side of the dashed sign specifies the attribute scheme, where 1 indicates a predominant attribute and 2 indicates an inferior attribute in a pairwise-comparison item. The number listed on the right-hand side of the dashed sign specifies the statement used for each attribute.
Appendix B
JAGS Codes for the FC-DCM in the First Simulation Study
| # N is the number of persons # T is the number of FC items # Z is the number of attributes # S is the number of statements for an attribute # alpha indicates the respondent’s attribute mastery status # d0 is the intercept parameter # sd is the statement utility parameter # q_att identifies which attribute is measured by an FC item # q_sta identifies which statement is administered for a given attribute # r is the item response # a and b are the discrimination and location parameters, respectively # theta is the second-order latent trait model{ for (i in 1: N) { for (j in 1: T) { p[i,j] <- d0[j] + (0.5–d0[j])*step(alpha[i,q_att[j,1]]-alpha[i,q_att[j,2]]) + (sd[q_sta[j,1],q_att[j,1]]* alpha[i,q_att[j,1]] + sd[q_sta[j,2],q_att[j,2]]*(1–alpha[i,q_att[j,2])])*step(alpha[i,q_att[j,1]]–alpha[i,q_att[j,2]]–1) r[i, j] ~ dbern(p[i, j]) } for (k in 1: Z) { pt[i,k] <- exp(a[k]*(theta[i]–b[k])/(1+exp(a[k]*(theta[i]–b[k]))) alpha[i,k] ~ dbern(pt[i, k]) } theta[i] ~ dnorm(0, 1) } # priors for (j in 1: T) { d0[j] ~ dbeta(1,1)I(,0.5) } for (j in 1: S) { for (k in 1: Z) { sd[j,k] ~ dbeta(1,1)I(,0.5) } } for (k in 1: Z) { a[k] ~ dlnorm(0,1) b[k] ~ dnorm(0,0.25) } } # data “N” = 500; “T” = 30; “Z” = 5; “S” = 5; q_att = structure(.Data = c( 1, 2, 2, 3, …… |
| ),.Dim. = c(2,30)); q_att=t(q_att); q_sta = structure(.Data = c( 2, 5, 1, 5, …… ),. Dim. = c(2,30)); q_sta=t(q_sta); r = structure(.Data = c( 1,1,0,0,1,1,1,1,0,1,1,1,1,1,1,1,0,0,1,0,0,1,0,1,0,0,0,0,1,0, …… ),.Dim = c(30,500)); r=t(r) |
Note. FC-DCM = forced-choice diagnostic classification model.
Declaration of Conflicting Interests
The author declared no potential conflicts of interest with respect to the research, authorship, and/or publication of this article.
Funding
The author disclosed receipt of the following financial support for the research, authorship, and/or publication of this article: This study was supported by the Ministry of Science and Technology (No. 109-2410-H-845-015-MY3).