
Abstract
Data from cluster randomized trials do not always have a pure hierarchical structure. For instance, students are nested within schools that may be crossed by neighborhoods, and soldiers are nested within army units that may be crossed by mental health–care professionals. It is important that the random cross-classification is taken into account while planning a cluster randomized trial. This article presents sample size equations, such that a desired power level is achieved for the test on treatment effect. Furthermore, it also presents optimal sample sizes given a budgetary constraint, with a special focus on conditional optimal designs where one of the sample sizes is fixed beforehand. The optimal design methodology is illustrated using a postdeployment training to reduce ill-health in armed forces personnel.
Keywords
Cluster randomized trials are conducted to evaluate the effectiveness of interventions in the behavioral, health, and biomedical sciences. Examples are health promotion interventions to improve vaccine uptake with students nested within schools and psychotherapy interventions to reduce post-traumatic stress disorder with soldiers nested within military units such as platoons or companies. The basic feature of this type of trial is that subjects are nested within clusters and randomization is done at the cluster level, which implies all subjects within the same cluster receive the same treatment. Although cluster randomization is less efficient than individual-level randomization, it is often chosen for political, financial, and ethical reasons and to avoid the risk of contamination of the control condition (Gail, Mark, Carroll, & Green, 1996; Moerbeek, 2005). For a basic introduction to the cluster randomized design, the reader is referred to Campbell and Walters (2014), Donner and Klar (2000), Eldridge and Kerry (2012), Hayes and Moulton (2009), and Murray (1998).
Measurements of outcomes from subjects within the same cluster are likely to be correlated because of mutual influence and shared norms. Such correlations should be taken into account while analyzing the data, and in this article, the multilevel regression model is used for that purpose (Goldstein, 2011; Hox, 2010; Snijders & Bosker, 2012). It is important that all levels of nesting are identified and included in the multilevel model. Ignoring one or more levels may result in biased estimates of treatment effects and, in particular, their standard errors, which may result in inflated type I or type II error rates (Moerbeek, 2004; Moerbeek, Van Breukelen, & Berger, 2003a; Opdenakker & Van Damme, 2000). In a similar manner, the results of cluster randomized trials may also be biased when imperfect hierarchies, such as random cross-classifications, are present in the data but ignored in the data analysis (Gilbert, Petscher, Compton, & Schatschneider, 2016; Luo & Kwok, 2009; Meyers & Beretvas, 2006). An example of a cross-classified design is a cluster randomized trial where soldiers are nested within army units and treated by mental health–care professionals (Castro, Adler, McGurk, & Bliese, 2012; Mulligan et al., 2012). As not all soldiers from the same unit are treated by the same professional, units and professionals are crossed with each other. Cross-classified structures can easily be taken into account by including a random effect for each crossed factor (Goldstein, 1994; Rasbash & Goldstein, 1994), such as for the units and professionals in the example. This implies a variance component is estimated for each random factor to represent the between-unit and between-professional variance in the outcome variable. The higher these variances, the more the units and the more the professionals differ from each other with respect to the outcome variable and the more severe the consequences of ignoring crossed random factors while analyzing data from a cluster randomized trial.
The possibility of random cross-classifications should not only be considered while analyzing data but also while designing cluster randomized trials. Part of a good design is a proper sample size calculation: How many clusters and which cluster size are needed to detect a treatment effect with a desired probability? Over the past two decades, much attention has been paid to sample size calculations for cluster randomized trials with two levels of nesting (Raudenbush, 1997), three levels of nesting (Cunningham & Johnson, 2012; Heo & Leon, 2008; Konstantopoulos, 2009; Moerbeek, Van Breukelen, & Berger, 2000; Teerenstra, Moerbeek, Van Achterberg, Pelzer, & Borm, 2008), dichotomous outcomes (Moerbeek, Van Breukelen, & Berger, 2001), and 2 × 2 factorial designs (Lemme, Van Breukelen, & Berger, 2015; Moerbeek, Van Breukelen, & Berger, 2003b). Thus far, attention has been restricted to cluster randomized trials with a pure hierarchical data structure. In terms of the example, sample size equations are available for trials where soldiers are nested within units, but the nesting within professionals is ignored. In other words, such sample size equations inform us how many units are needed and how many soldiers per unit should be sampled, but they do not inform us how many professionals should be included in the trial and how many soldiers each of them should treat. This may result in a design that is suboptimal and therefore a misuse of the researchers’ and participants’ time and efforts.
The aim of this contribution is to present sample size equations for cluster randomized trials with random cross-classifications. It is important to distinguish two different types of random cross-classifications in cluster randomized trials: those that exist naturally and those that do not. The cross-classification of army units and health-care professionals is an example of the latter. A pure hierarchy with soldiers nested within units exists before randomization of units to treatment conditions, and the random cross-classification is established once soldiers are assigned to professionals. In a completely crossed design, data are available in each cell (i.e., in each unit-professional combination). In the literature of trials of therapist interventions, this design has been referred to as a cross-therapist design. One can also image a design where the first set of units is treated by the first handful of professionals, the second set of units is treated by the second handful of professionals, and so on. This is a partially crossed design (or a nested-therapist design) and may be encountered when not all units return from combat at the same time and not all professionals are available for the whole duration of the study. By clever randomization of soldiers to professionals, one can achieve a balanced design. Balanced designs are favored, as they are more efficient than unbalanced designs (Van Breukelen & Candel, 2012; Van Breukelen, Candel, & Berger, 2007).
An example of a cluster randomized trial with a naturally existing random cross-classification is an intervention study to improve vaccine uptake (Ali et al., 2007) with students nested within schools and crossed by neighborhoods. The number of neighborhoods served by schools is likely to be highly variable, and neighborhoods serving different schools will only be partially overlapping at the best. In such an example, the design is likely to be unbalanced. One may try to achieve a balanced design by subsampling students from each school–neighborhood combination, but this may not always be justified in practice. For instance, it may not be considered ethical to offer an intervention to some students in a school and to refrain other students in the same school from that intervention. In the most extreme case, some cells may not have any students at all, which implies a balanced design cannot be achieved by subsampling.
The organization of this article is as follows. In the next section, the multilevel model for cross-classified data is presented, and the partitioning of the variance to the different levels is given. The third section studies statistical power and optimal design for the complete random cross-classification. It presents mathematical expressions for the variance of the treatment effect estimator, as this variance will be used to calculate the required sample size to achieve a desired power level for the tests on main and interaction effects. It will be shown that the power level depends on the number of units, the number of professionals, and the number of soldiers per cell. Once two of them are fixed, the third can be calculated such that the desired power level is achieved. When neither sample size is fixed beforehand, the best combination of these three sample sizes can be determined by taking a budgetary constraint into account. Special attention is also paid to conditional optimal designs (Hedges & Borenstein, 2014), where one of the three sample sizes is fixed and the cost constraint is used to calculate the other two. The focus of fourth section is on partial random cross-classifications and the loss of efficiency as compared to the complete random cross-classification. The third and fourth sections restrict to balanced designs; an extension to unbalanced designs is made in the fifth section. The final section gives a summary of the results, a discussion, and directions for future research.
Statistical Model and Variance Partitioning
Army units are at random assigned such that half of them receive the intervention and the others receive the control. Within each unit, soldiers are subsequently assigned to mental health–care professionals. The regression model relates outcome

Treatment condition
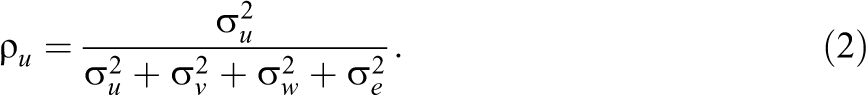
The intraclass correlations quantify the proportion variance that is attributable to each random effect. The proportion variance at the level of the unit is
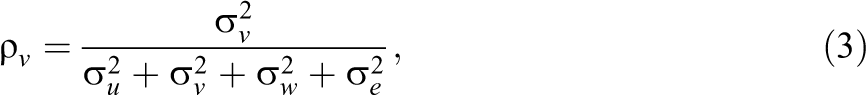
Similarly, the intraclass correlation at the level of the professional is
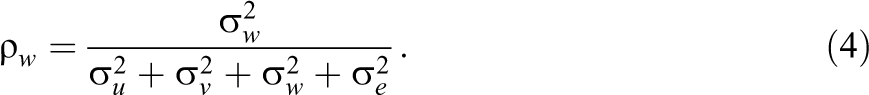
and the intraclass correlation due to the random unit by professional interaction is
These proportions vary between 0 and 1. The proportion variance at the soldier level is
Complete Random Cross-Classification
In the design with a complete random cross-classification, data are available in each cell. This implies each health professional delivers both the intervention and control. The sample size calculations that follow in this section assume a balanced design: Randomization of soldiers to professionals is done such that each cell has the same amount of soldiers
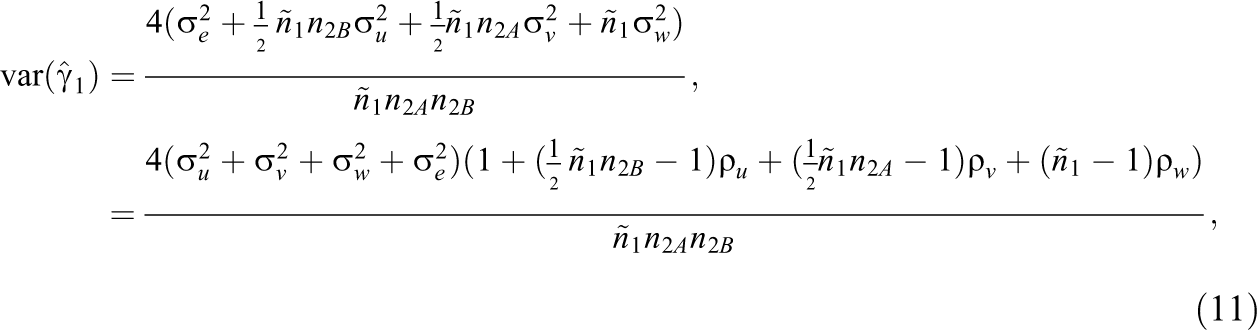
Given a balanced design, the treatment effect size
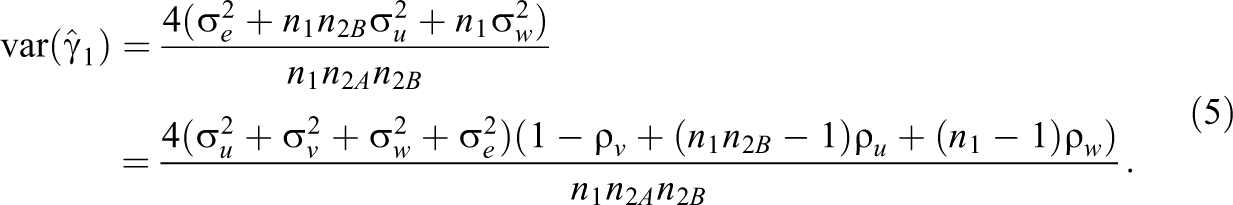
This variance is estimated by replacing the variance components by their estimates. A justification of Equation 5 is given in Appendix 1 of the Supplemental Material.
The variance for the treatment effect estimator depends on the variance component
Note that the unit variance component
The term
The Relation Between Sample Size and Power
Equation 5 shows that the precision with which the effect of intervention is estimated increases with increasing sample size. In other words, a larger sample size implies a higher statistical power to detect the intervention effect, provided it exists in the population. In trials like this, there is not just one sample size but three: the number of units
The test statistic for the test on intervention effect is calculated as

where the random variable

and for the two-sided alternative hypothesis

For large degrees of freedom, the t distribution can be approximated by the standard normal and the general equation for the relation between sample sizes and power for the test on the intervention effect
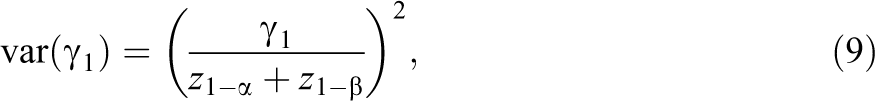
where
In many trials, some of the sample sizes
Required Number of Units
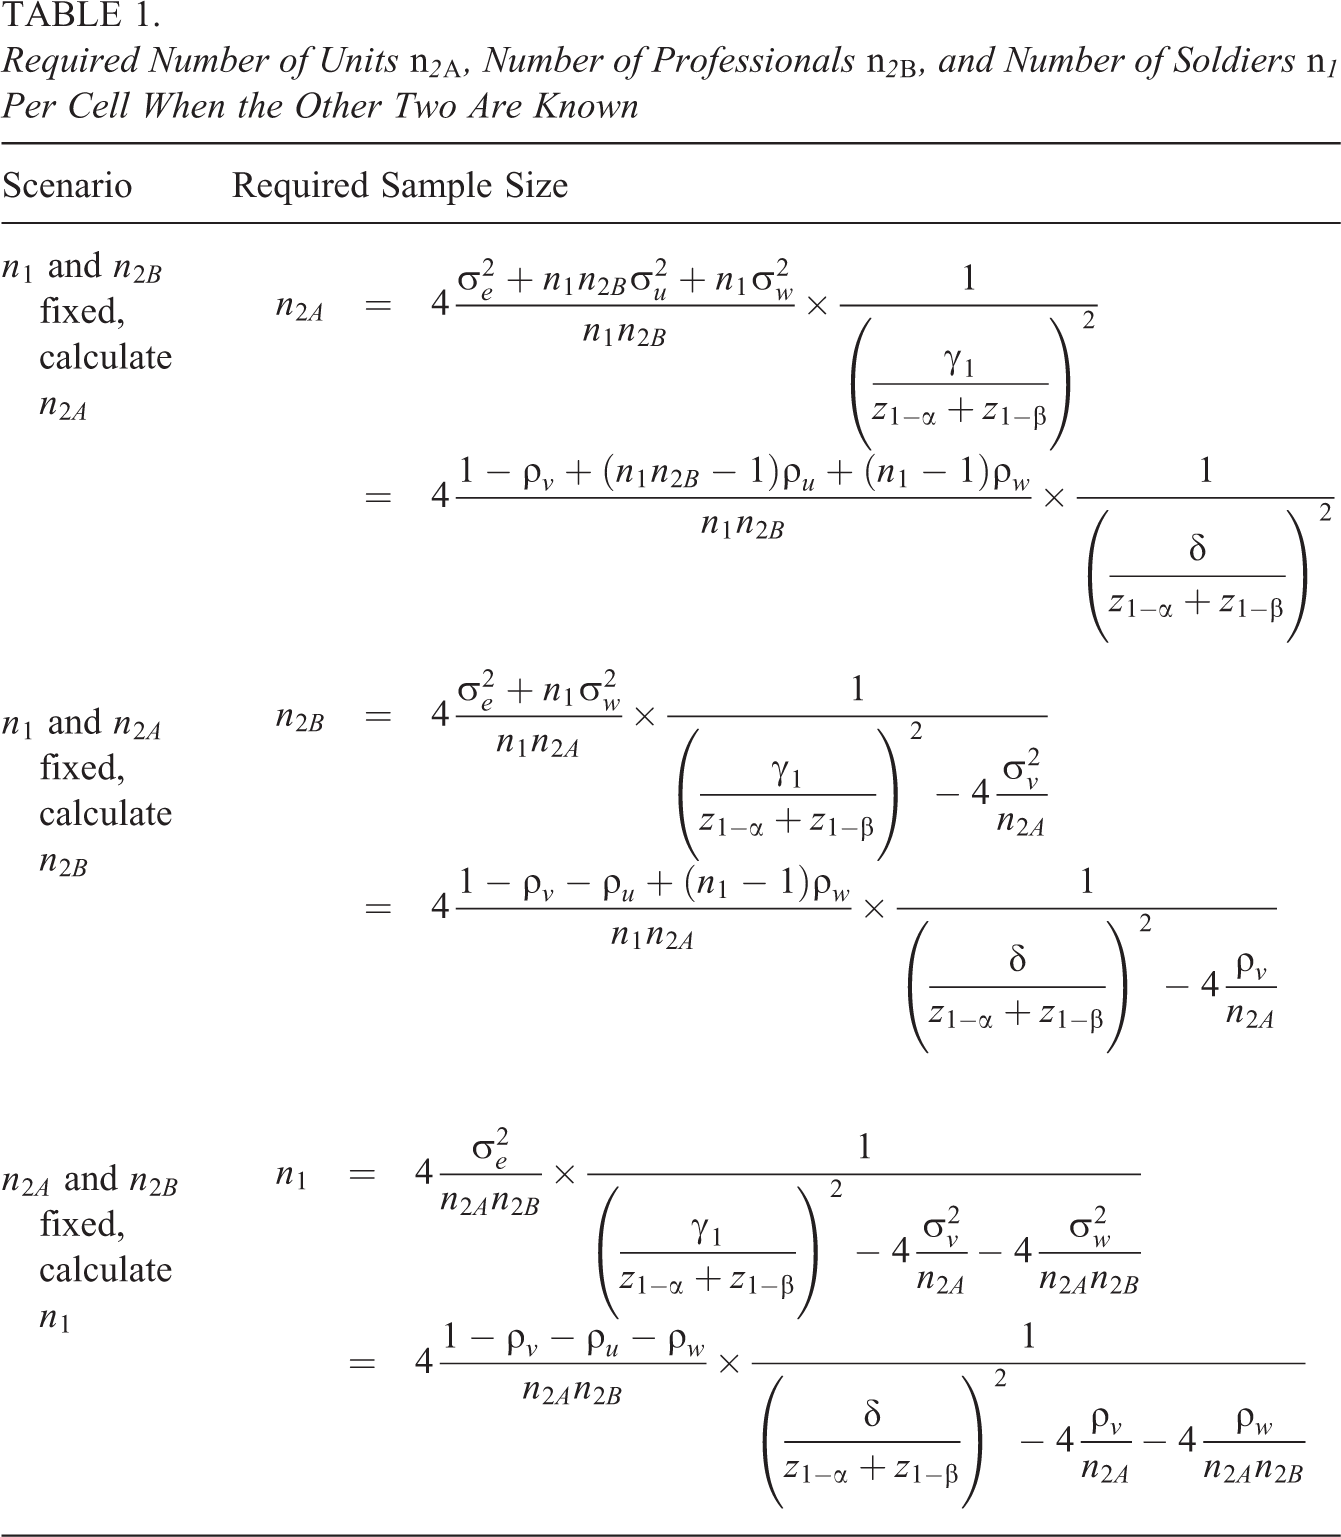
It is obvious the required sample size increases when the other two sample sizes decrease. In addition to that, a larger sample size is needed when smaller type I and type II error rates α and β are required. Furthermore, sample size depends on the size of the effect
Optimal Sample Sizes Given a Budgetary Constraint
Here, we focus on the derivation of the optimal combination of the number of units, professionals, and soldiers per cell:
Assume the costs to include a unit are

Here,
The next step in finding an optimal design is to choose an optimality criterion, which must be minimized under the above cost constraint. In this article, we consider the variance of the treatment effect estimator,
The relative efficiency measures how well any other design ξ performs as compared to the optimal design
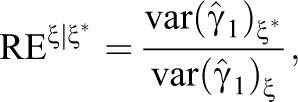
where the numerator is
Unfortunately, there exist no simple closed-form formulas for the optimal sample sizes, and the optimal design should therefore be found on the basis of numerical techniques. R code for this purpose is available from the first author upon request. This R code also calculates the RE of alternative designs as compared to the optimal design. The use of the code will be demonstrated on the basis of an example in An Example: Postdeployment Training to Reduce Ill-Health in Armed Forces Personnel subsection.
Conditional Optimal Designs
In practice, it may occur that the number of army units, the number of health professionals, or the number of soldiers per cell is fixed beforehand. For instance, one may want to include all soldiers within a unit in the intervention and then the budgetary constraint is used to determine the optimal numbers of units and professionals. This is a so-called conditional optimal design, and such designs have been derived for three- and four-level cluster randomized trials without a random cross-classification (Hedges & Borenstein, 2014).
Table 2 shows expressions for conditional optimal designs in cluster randomized trials with a random cross-classification and the budgetary constraint (Equation 10; see Appendix 2 of the Supplemental Material for the derivation of these conditional optimal designs). In the first scenario,
Conditional Optimal Designs in Cluster Randomized Trials With Random Cross-Classifications
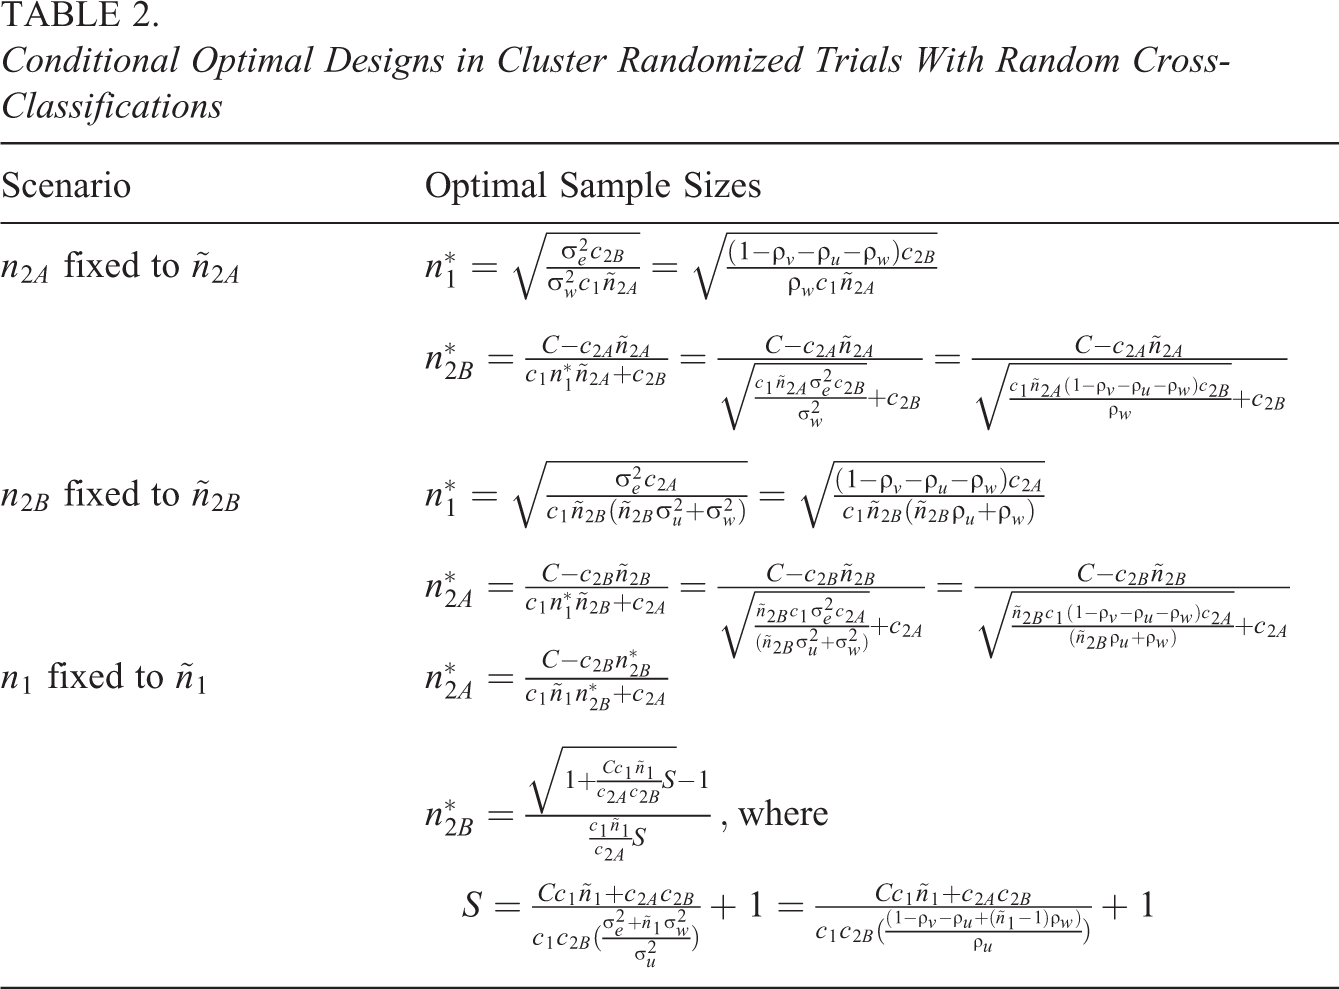
The optimal sample sizes for the scenario where
For all three scenarios, R code is available from the first author upon request and can be used to find the optimal design and to evaluate the relative efficiency of suboptimal designs. Its use will be demonstrated in the next section.
An Example: Postdeployment Training to Reduce Ill-Health in Armed Forces Personnel
In the study by Mulligan et al. (2012), companies of approximate size 100 were randomly assigned to an intervention or control and treated by 12 health-care professionals. The intervention was a postdeployment psychoeducational intervention, and the control was a standard brief. The primary outcomes were the symptoms of post-traumatic stress and common mental disorders. Secondary outcomes were depression, sleep quality, alcohol misuse, and stigmatizing beliefs regarding seeking help for or having a mental health problem. In their power analysis, they assumed a medium standardized effect size and an intraclass correlation at the company level of
Let us consider a scenario where the number of professionals and the size of the company are fixed, and the number of companies to achieve a power of 80% is calculated. Figure 1 shows the power as a function of the number of companies up to
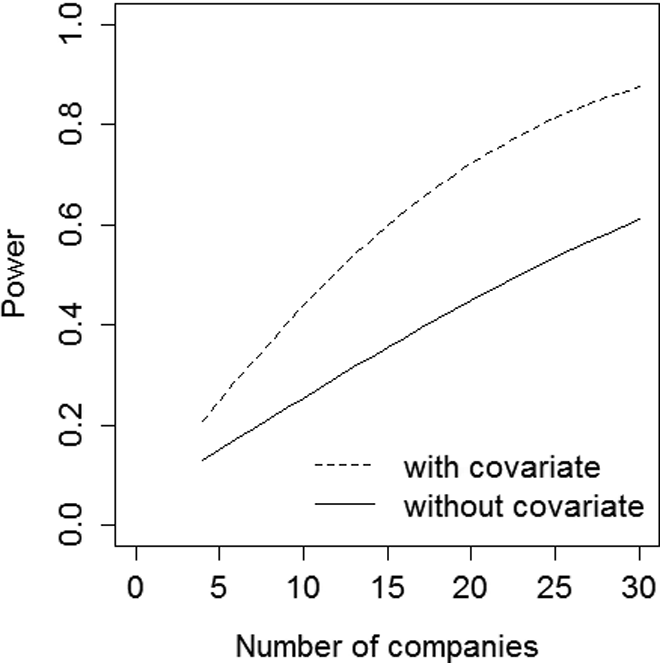
Power as a function of the number of companies
As increasing the number of professionals and/or the number of soldiers per cell only has a minor effect on power, other means should be used to get a more acceptable power level of
In case neither sample size is fixed beforehand, a budgetary constraint can be used to derive the optimal design. Suppose the maximum number of companies that can be recruited is
The contour graph at the left of Figure 2 shows how many soldiers can be included per cell as a function of the number of companies on the horizontal axis and the number of professionals on the vertical axis. Note that, as the number of companies and professionals is only evaluated at integer values, the contour lines are not smooth. It may be clear the number of soldiers per cell decreases as the number of companies and/or professionals increase.
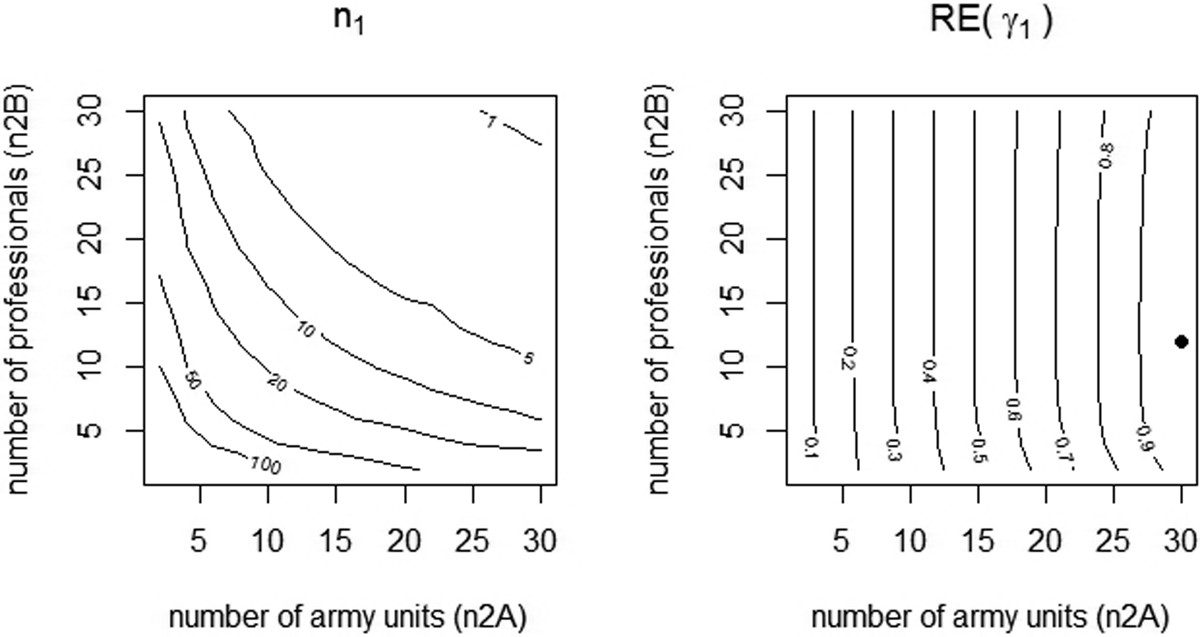
Contour plot for the number of soldiers per cell (left graph) and for the relative efficiency (right graph). The dot represents the optimal design.
The contour plot at the right shows relative efficiencies of designs with
The optimal design may not always be feasible in practice and one may want to use a conditional optimal design by fixing one of the three sample sizes beforehand. Figure 3 shows the conditional optimal designs for various scenarios. The two top graphs relate to the scenario where the number of companies is fixed to
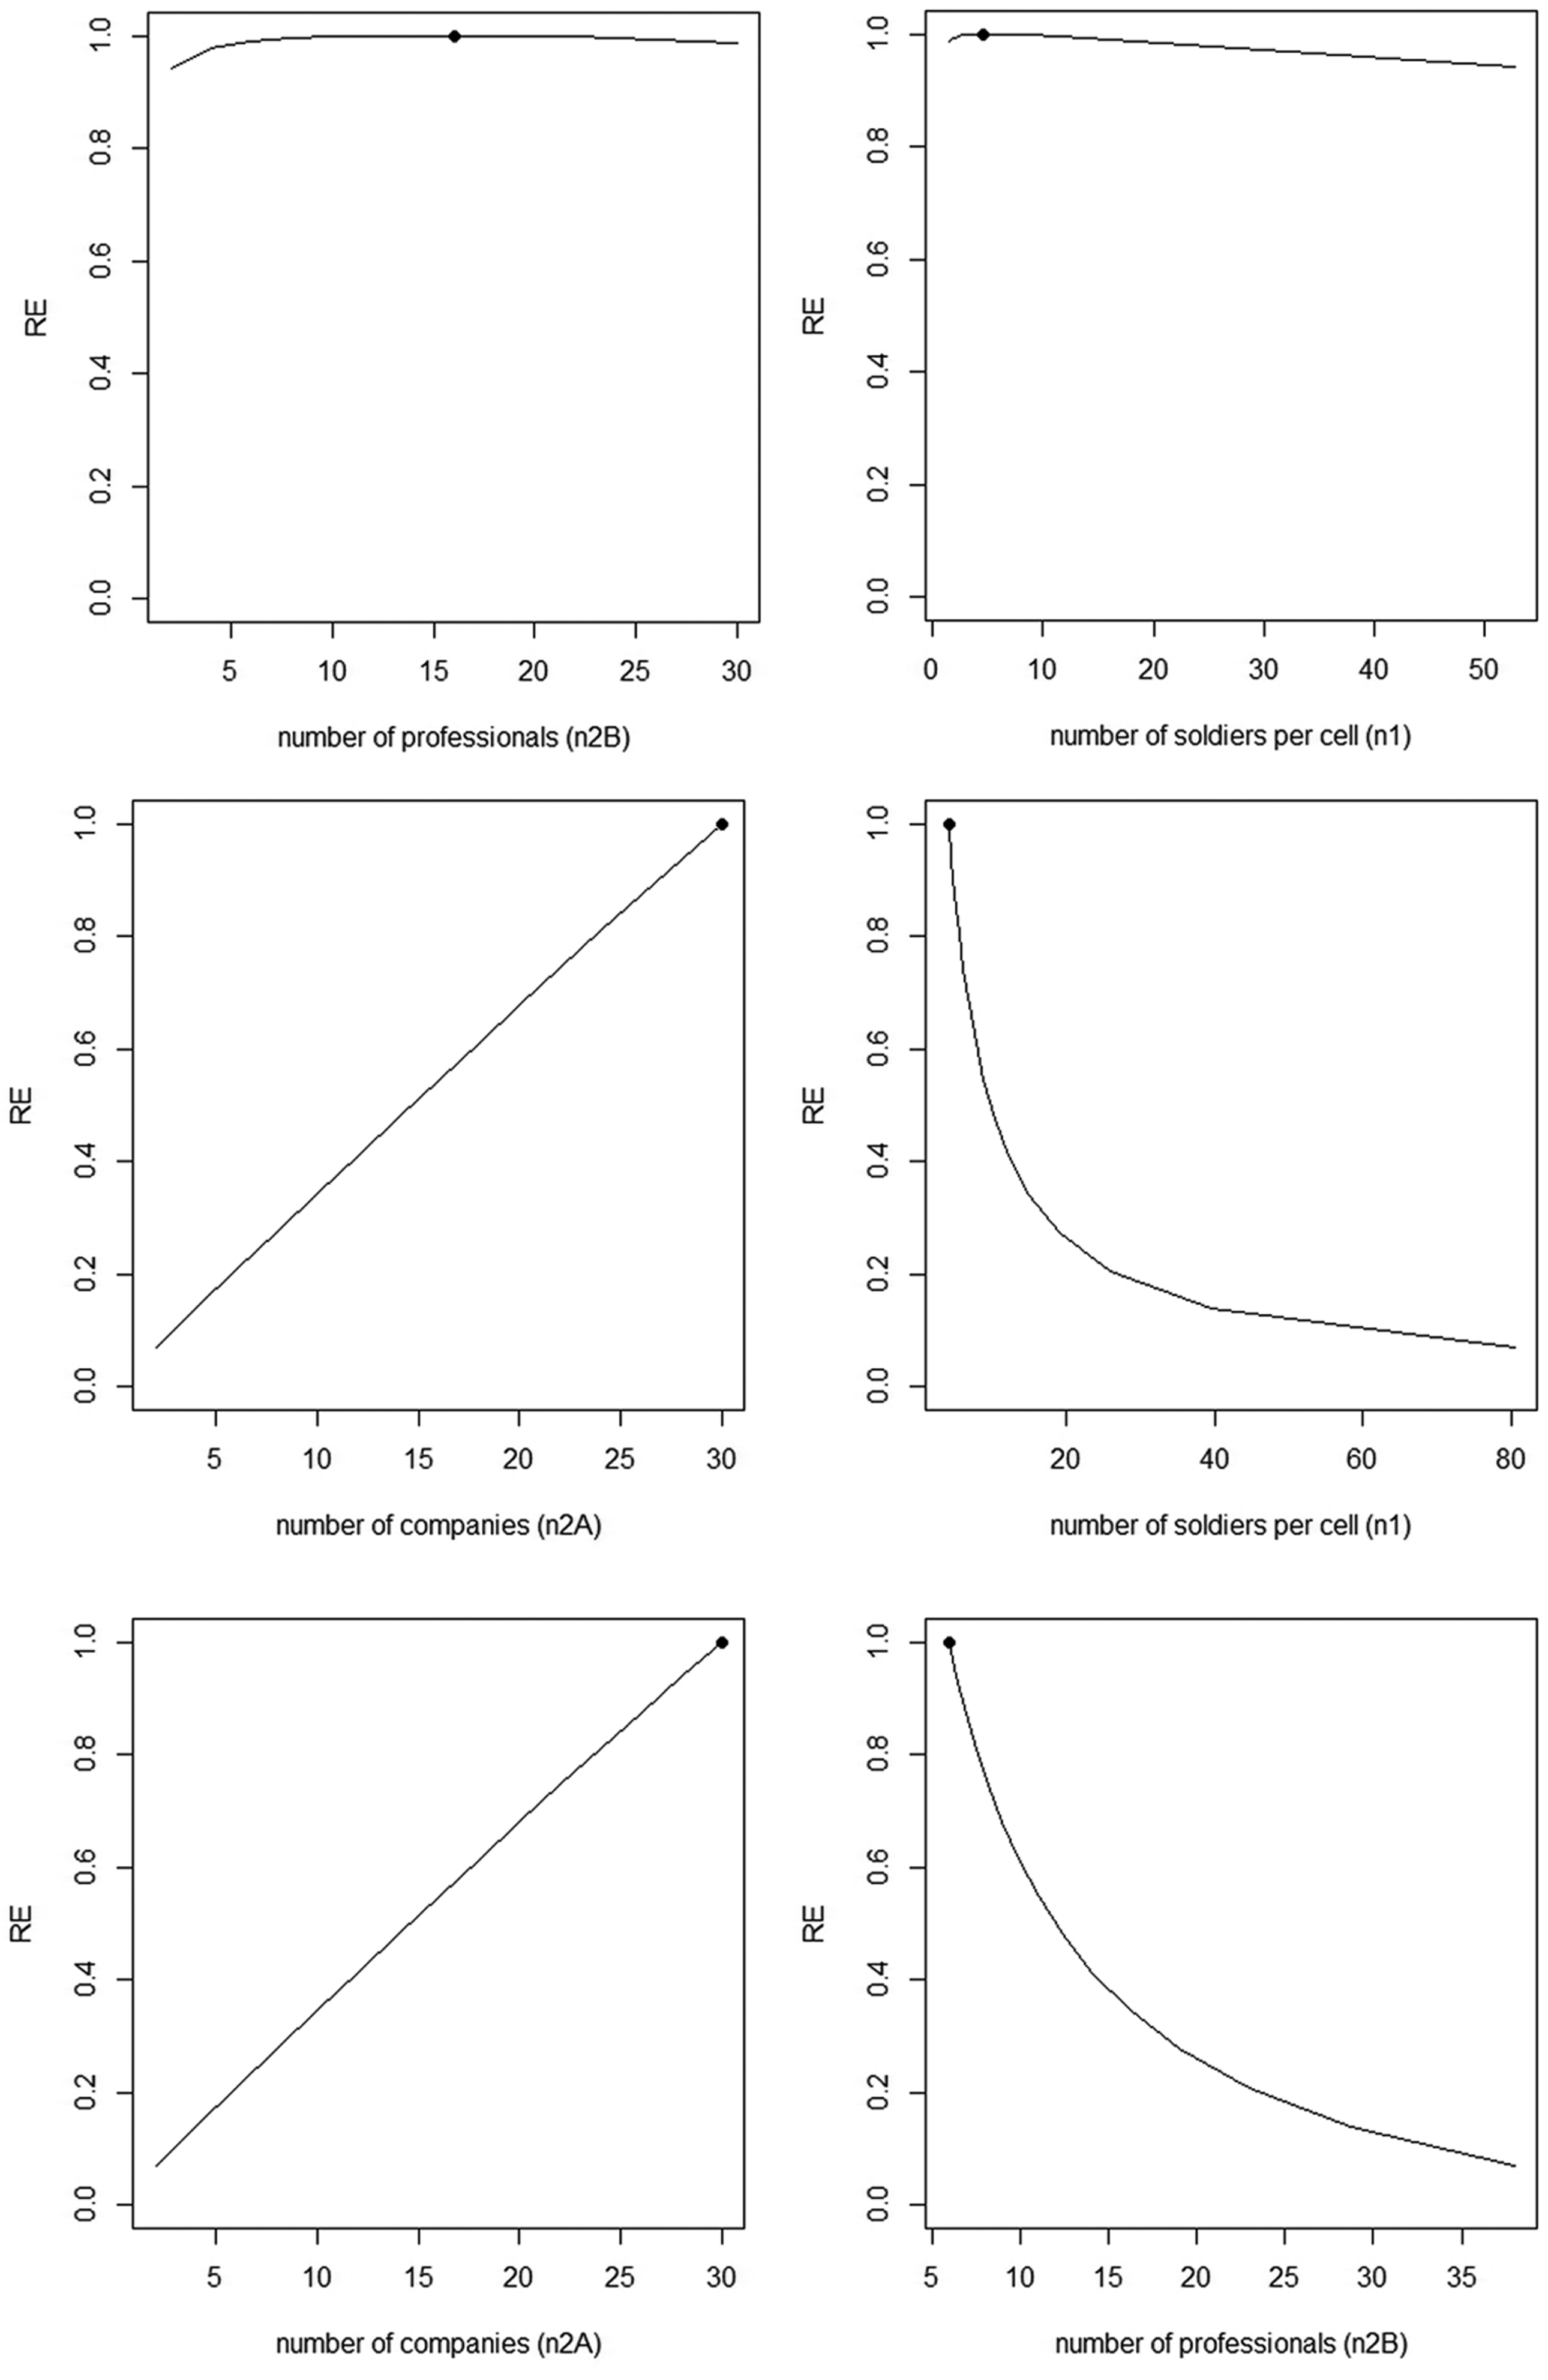
Conditional optimal designs and relative efficiencies of alternative designs. Top graphs:
In the second scenario, the number of professionals is fixed to
In the third scenario,
Partial Random Cross-Classification
The complete cross-classification of the previous section implicitly requires all health professionals deliver both the intervention and control. This was more or less the case in the study by Mulligan et al. (2012), where one type of health professional delivered the control only and all other types delivered both control and intervention. Such a design may result in contamination of the control group through the health professional and hence an underestimate of the effect of treatment and a reduced power (Moerbeek, 2005). To help ensure intervention fidelity, all intervention sessions were observed by a member of the research team.
Another means to minimize contamination is restricting each professional to offer either the intervention or control but not both. This is a so-called partial random cross-classified design since some of the cells have
For instance, consider a design in which clusters 1,…,
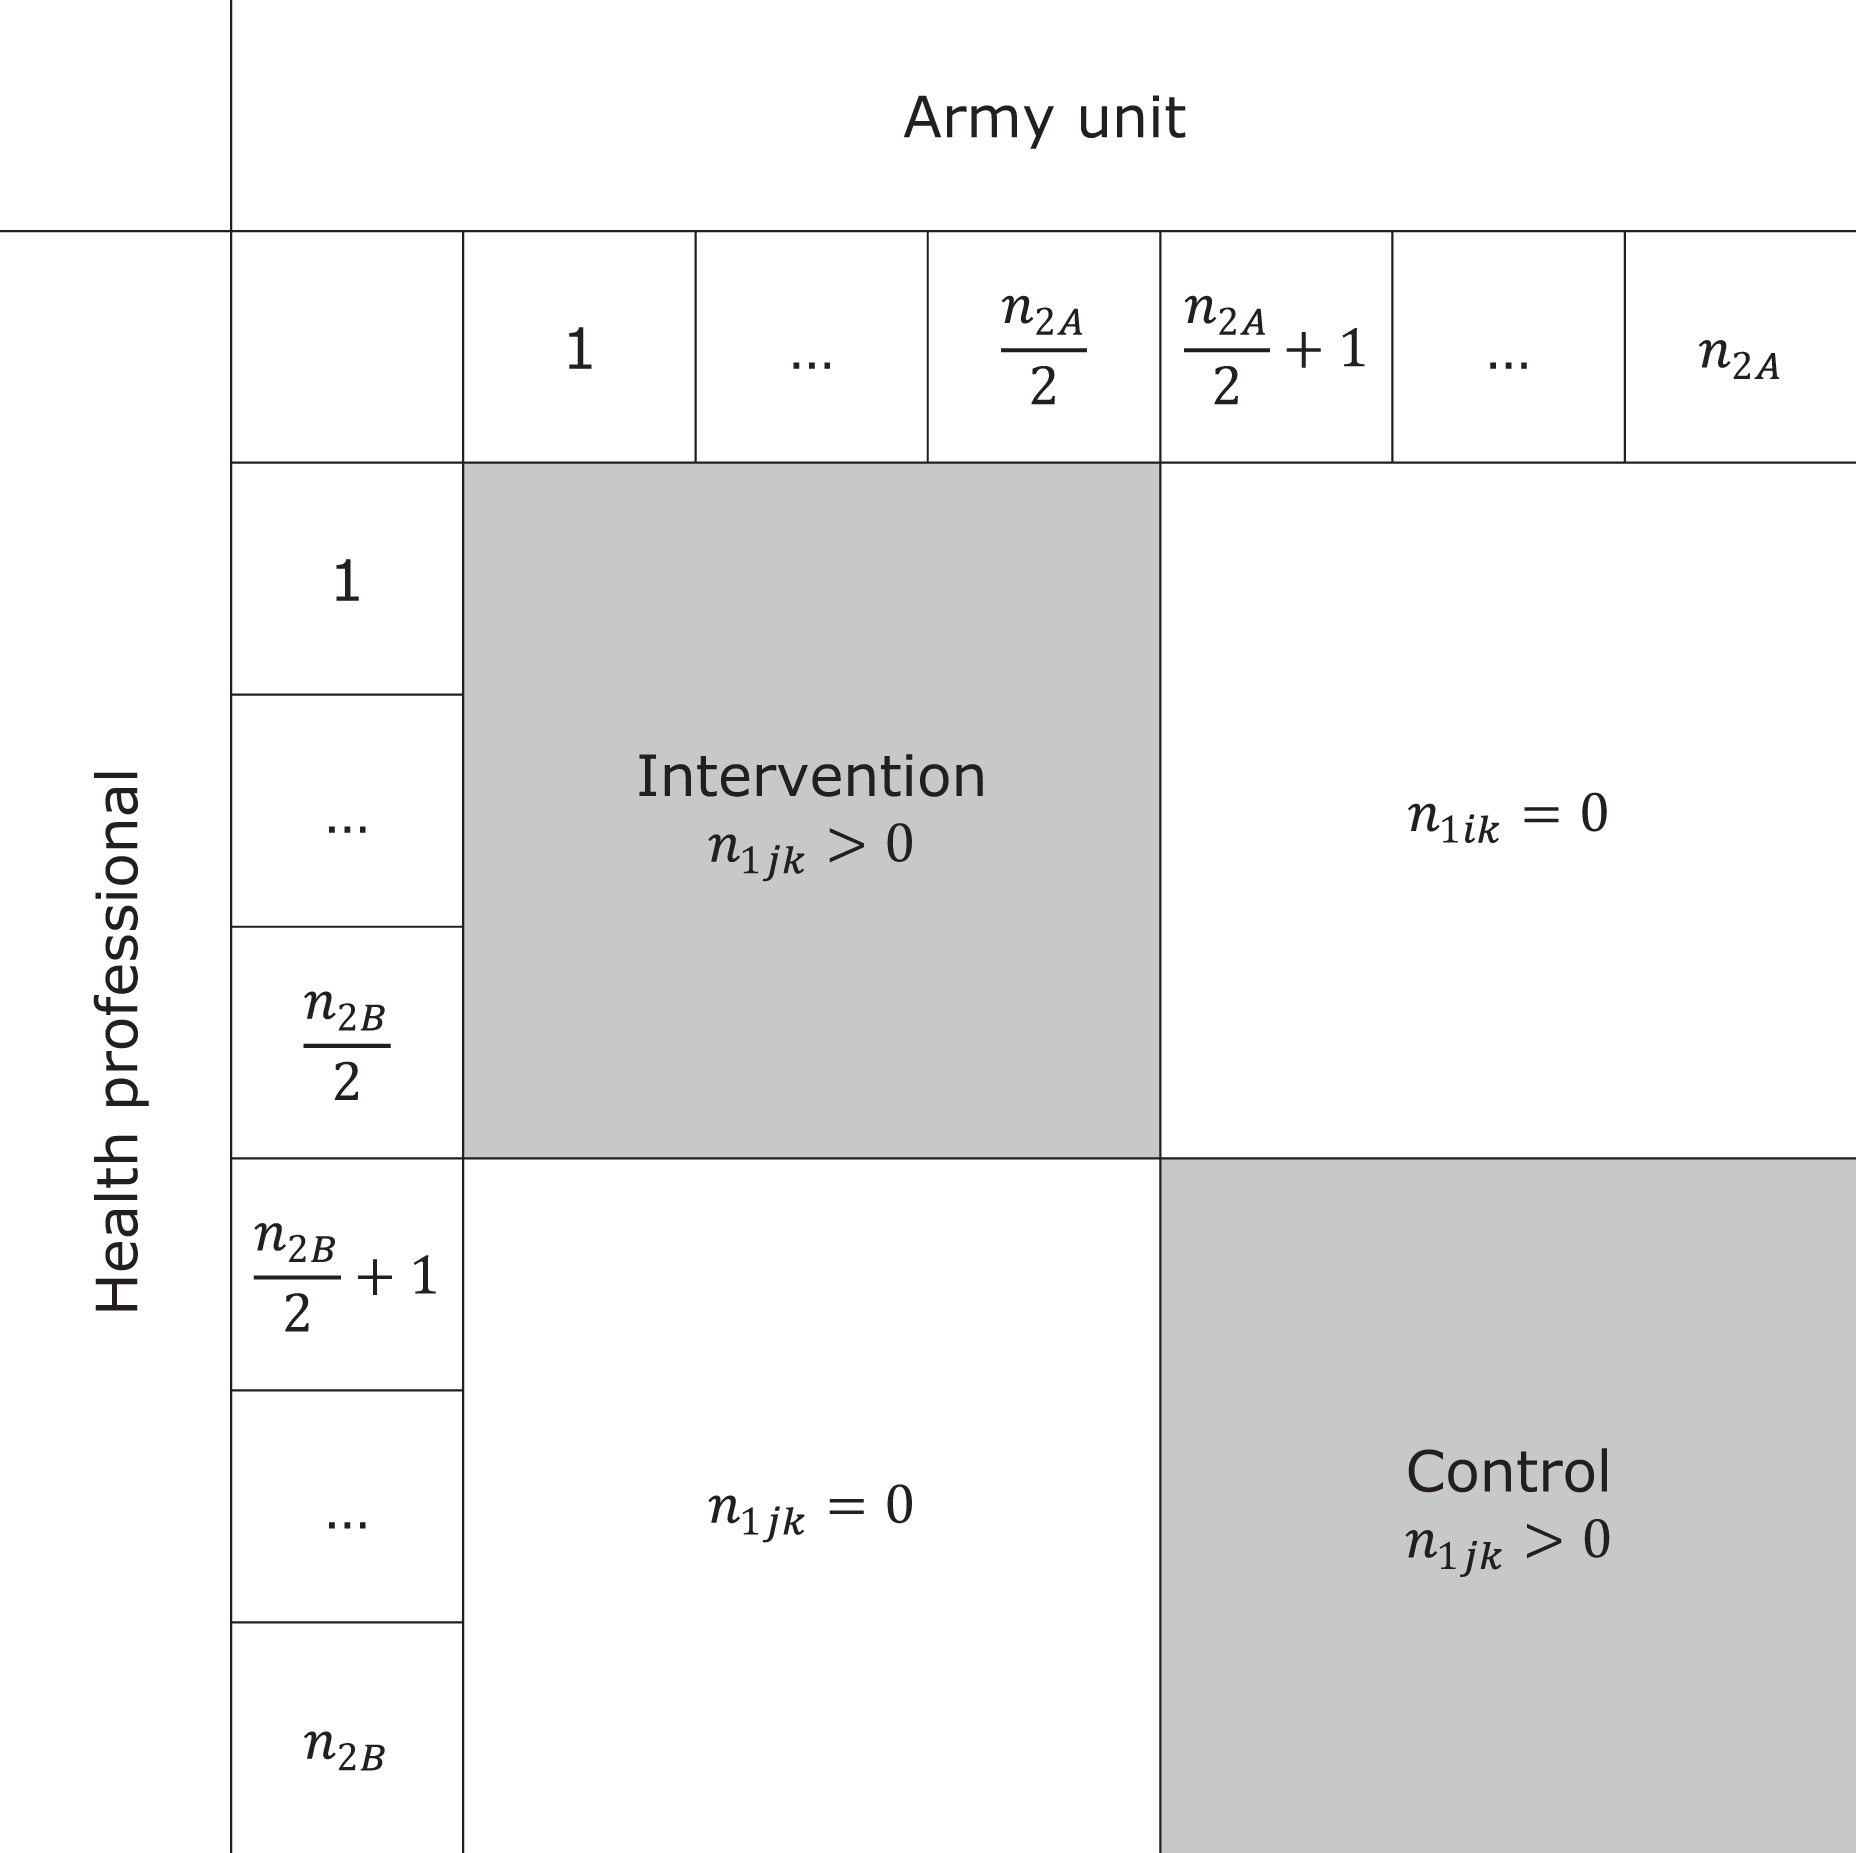
Cross-tabulation of sample size per army unit and health professional in a partial cross-classification.
In the remainder of this section, we assume a balanced design with
which includes the term
To illustrate the loss of efficiency, consider a study with
Unbalanced Designs
The focus of this section is on random cross-classifications that exist naturally, for instance, the cross-classification of schools and neighborhoods or that of primary and secondary schools. In such cases, the design is likely to be unbalanced, and subsampling to achieve a balanced design is not always possible or justified.
Consider as an example a trial of the long-term effects of a smoking-prevention intervention that was offered to pupils in eighth grade of elementary school in the Netherlands (Ausems, 2003). The last follow-up measurement was taken when all pupils had already transferred to secondary school. It is important to consider the between-secondary school variability while estimating the effect of the intervention on the long-term measurements, since secondary schools may vary with respect to their policy toward smoking, availability of cigarettes in the school, and its neighborhood and peer pressure among pupils.
The random cross-classification should also be taken into account while designing the study. The R code, available from the first author, can be used to perform a simulation study to calculate the power to detect a treatment effect. This code can handle any number of primary and secondary schools and any number of pupils per primary–secondary school combination. The sample sizes are provided by an external file crossclassdata.txt in which each primary school is represented by a row, each secondary school is represented by a column, and the values in the cells give the number of pupils per primary–secondary school combination. For each simulated data set, random assignment of primary schools to treatment conditions is done, and data are generated and estimated on the basis of equation (1) using the function lmer from the package lme4 (Bates, Mächler, Bolker, & Walker, 2015). The empirical power is calculated as the proportion of data sets for which the null hypothesis is rejected.
To actually use the R code, one must have insight in the distribution of the cell sizes across the primary and secondary schools. For this purpose, one may use administrative data from municipalities or school districts or use data from past research. We use cell sizes from the study by Paterson (1991), where 3,435 pupils are nested in 148 primary schools crossed by 19 secondary schools. In addition, estimates of the intraclass correlation coefficients and the standardized effect size of the primary school intervention must be given. The sizes of these model parameters are given in the first few lines of the R code. We use
Conclusion and Discussion
Data in cluster randomized trials do not always have a pure hierarchical structure with subjects nested within clusters. In a random cross-classification structure, the clusters are crossed with clusters of another type. Previous research has shown a data analysis that ignores a random cross-classification data may result in biased results (Gilbert et al., 2016; Luo & Kwok, 2009; Meyers & Beretvas, 2006). It is also important that a random cross-classification is taken into account while designing a cluster randomized trial. This article presents formulas for the sample sizes such that a desired power level is achieved, and optimal sample size equations given a budgetary constraint.
It should be mentioned that this article provides sample size guidelines from a power and optimal design perspective. There are other criteria, guidelines, and recommendations to make decisions with respect to sample size in cluster randomized trials. For instance, Snijders and Bosker (2012) recommend to use at least 20 clusters if the aim is to generalize inferences to the population of clusters. They mention that with as few as 10 clusters, the data will contain only scant information about the population. Hayes and Moulton (2009) recommend using at least four clusters per treatment condition to ensure a valid analysis. This recommendation is also included in the extension of the Consort 2010 statement to cluster randomized trials (Campbell, Piaggio, Elbourne, & Altman, 2012). Sample sizes should also be chosen such that model parameters and their standard errors are estimated with small bias, and the coverage of confidence intervals is within acceptable limits. Over the past two decades, much simulation research has been done to provide sample size guidelines for frequentist estimation (Maas & Hox, 2005) and Bayesian estimation (Hox, Van De Schoot, & Matthijsse, 2012). These studies focused on perfect hierarchies; future simulation studies should focus on imperfect hierarchies such as random cross-classifications.
The optimal design methodology is also applicable in trials where randomization to treatment conditions is done at the individual level, but treatment is offered by health professionals. Such designs are referred to as individually randomized group treatment trials (Pals et al., 2008). An example is a trial on the effectiveness of surgery for lower back pain, where patients are not only nested within surgeons but also within physiotherapists such that surgeons and therapists are crossed with each other. Patients treated by the same health professional will respond more alike due to therapist effects arising from experience, skills, compassion, adherence to protocols, and so on. Random cross-classifications are further encountered in group treatment trials where several therapist deliver treatment (Roberts & Walwyn, 2013).
This article assumes a constant effect of treatment over therapists, and the multilevel cross-classified was used to take nested and crossed data structures into account. If treatment effects are not constant, however, multilevel models can bias estimated treatment effects, and ordinary least squares with cluster adjusted standard errors might be preferred. Furthermore, we implicitly assumed the subjects to be randomly assigned to therapists. In practice, the assignment of subjects to therapists is often not experimentally controlled, and the multilevel cross-classified model can yield biased standard errors of treatment effect estimates because parameters required to compute the standard errors are not identifiable from the data. So multilevel cross-classified models are used to adjust standard errors in case the data have a nested and cross-classified structure, but they are not always the correct approach to take. Weiss, Lockwood, and McCaffrey (2016) provide suggestions for mitigating the bias due to nonrandom assignment of therapists to subjects.
To apply the optimal design methodology, one must be able to provide prior estimates of the intraclass correlation coefficients of the two crossed random factors. For cluster randomized trials with crossed random effects, such estimates are hardly available in the literature, but at least one can use estimates from cluster randomized trials without a random cross-classification to get some insight in to the sizes of the intraclass correlation coefficients. A large overview of papers that report estimates of intraclass correlation coefficients is presented by Moerbeek and Teerenstra (2016). For cluster randomized trials without a random cross-classification, it has been shown that optimal designs are rather robust to incorrect prior estimates of the intraclass correlation coefficient (Korendijk, Moerbeek, & Maas, 2010). Furthermore, there are approaches to deal with uncertainty in the intraclass correlation coefficient in the design phase of a trial, such as maximin optimal designs (Van Breukelen & Candel, 2015) and internal pilot designs (Lake, Kammann, Klar, & Betensky, 2002; Van Schie & Moerbeek, 2014).
The balanced design with equal number of subjects per cell is most efficient but cannot always be achieved in practice. The relative efficiency of unbalanced designs has been studied for cluster randomized trials without a crossed random factor (Van Breukelen & Candel, 2012; Van Breukelen et al., 2007). Sampling 10% more clusters often suffices in accounting for unbalancedness. In designs with cross-classified data, the unbalancedness may occur across both random factors and increasing the sample size by 10% may probably not suffice. As Lai and Kwok (2014) already remarked, closed forms of the treatment effect estimator and its variance are very complex functions of the cell sizes. Future research should focus on the loss of efficiency due to an unbalanced design. As for now, the R code, available from the first author, may be used to evaluate the power of unbalanced designs.
Over the past three decades, much attention has been paid to the design and analysis of cluster randomized trials with a pure hierarchical structure. In recent years, a shift in attention has been made to data structures that are not purely hierarchical, such as cross-classified data. Partially cross-classified data were studied in this article but can also be found in studies where some of the subjects are nested in one random factor and others in two cross-classified random factors (Luo, Cappaert, & Ning, 2015). An example is a study on the effect of after-school programs, where pupils in the control are nested in schools and pupils in the intervention are nested within schools crossed by after-school programs. As for now, optimal design recommendations for such trials are lacking. Another example is multiple membership models, see Chung and Beretvas (2012), Luo and Kwok (2012) for the implications of ignoring multiple membership structures, and Roberts and Walwyn (2013) for optimal design methodology. Thus far, the main focus has been on linear models with continuous outcome scores; future research should focus on dichotomous outcome scores.
Footnotes
Declaration of Conflicting Interests
The author(s) declared no potential conflicts of interest with respect to the research, authorship, and/or publication of this article.
Funding
The author(s) received no financial support for the research, authorship, and/or publication of this article.
References
Supplementary Material
Please find the following supplemental material available below.
For Open Access articles published under a Creative Commons License, all supplemental material carries the same license as the article it is associated with.
For non-Open Access articles published, all supplemental material carries a non-exclusive license, and permission requests for re-use of supplemental material or any part of supplemental material shall be sent directly to the copyright owner as specified in the copyright notice associated with the article.