
Abstract
Under the Every Student Succeeds Act, college and career readiness became the central focus of education policy in the United States. Career academies (CAs) are a popular way to support students in their postsecondary transitions, but little causal evidence exists about whether this model of schooling is effective in promoting learning and transition outcomes. We capitalize on the adoption of the CA model in a large school district that was under the threat of school turnaround and employ a generalized difference-in-differences approach to test whether adopting this model improved student outcomes. We find suggestive evidence that CA adoption improved graduation rates and that these effects were most likely concentrated among schools that had the lowest graduation rates at baseline.
Keywords
In the era of test-based accountability, some districts had begun to use CAs as a school reform and improvement strategy. Such behavior is, in principle, consistent with a central element of the CA theory of change, which includes the notion that applied learning should increase engagement and job-related skill development, which could also improve general learning and educational attainment (Kemple & Snipes, 2000). In fact, a number of mid- to larger-sized school districts have adopted the CA model as a means to improve a range of outcomes in schools with poor high school completion rates (Akron Public Schools, n.d.; Jefferson County Public Schools, n.d.; Rockford Public Schools, n.d.). In this study, we capitalize on the adoption of the CA model in a large school district to test whether adopting this model in high schools resulted in improved graduation rates, test score outcomes, and attendance. As we describe in greater detail below, the implementation of the CA model represents a substantial overhaul in the school structure, in that it creates smaller communities within the school organized around occupational themes and encourages core academic teachers to align their lessons to the CA content.
Importantly, we learn about the efficacy and impact of the CA model in a district that otherwise faced the threat of state takeover in the absence of another viable school or district improvement strategy. Thus, in the context of this study, we aimed to isolate the impact of the adoption of CA on short-term educational outcomes within lower-performing schools that in the absence of this change otherwise faced the threat of takeover. The large-scale adoption of the CA model, across the majority of district high schools in a short period of time, and the absence of similar concurrent reforms elsewhere, allow us to employ a generalized difference in differences and event study methodologies. We capitalize on the within-school, cross-cohort changes in exposure to the CA model, and compare the schools that experienced the change to otherwise similar in-state comparison groups.
We find suggestive evidence that the adoption of the CA model improved graduation rates for the first several treated cohorts and the increase in graduation rates, relative to comparison, appears to have persisted. Schools that had the lowest graduation rates at baseline (pre-reform) appear to experience larger impacts. Examination of ninth grade attendance suggests that adoption of the model did not directly and immediately improve school attendance, indicating that the improvements in attainment come from other elements of the CA model. Analyses of the implementation of CA on end-of-course exams reveal suggestive positive impacts in the early years of rollout. Descriptively, we see that rates of participation in CA activities are high and that all schools implemented academy themes in high-growth occupational areas such as IT, STEM, and health science.
The rest of this paper is laid out as follows. First, we review the relevant literature on CAs and career and technical education (CTE), as well as models and efforts related to school turnaround. From the literature, we find that the potential for CAs to be successful as part of turnaround strategies may relate to how faithfully the model is implemented, and whether there are resources available to support this implementation. Next, we describe the education and school change context at the center of this study before defining the specific data and sample for our analyses. Then, we present our analytic approaches, followed by results, robustness checks, and a discussion of the results in the context of related literature.
CAs and School Improvement
CAs as a policy approach has existed as a high school reform model in the United States educational system for over 30 years (Lanford & Maruco, 2018). CAs first opened in in Philadelphia in the 1960s when they were introduced as a means to improve engagement and connection to the workforce (Stern, 1992; Stern et al., 2010). Originally, CAs began as an educational model that offered smaller learning communities to students that focused on specific industry sectors (Stern & Sterns, 2008). Within these reorganized learning spaces, teaching and learning opportunities are provided to students that help them acquire the necessary technological and vocational and technical skills that tie classroom experiences with real-world examples and opportunities (Gajda & Dorfman, 2006). Today, CAs allow students to take courses that integrate core academics and applied learning around a career theme that also align with postsecondary and career options. Thus, in CA settings, CTE is intertwined with core state graduation requirement courses in ways that are not typical in other comprehensive high schools.
To date, CAs have grown considerably with 7,000 known academies reported through one of the largest academy related groups, the National Career Academy Coalition (2019). This has coincided with efforts throughout the U.S. educational system to improve the preparation of K-12 students transition into college and professional careers (Darling-Hammond et al., 2014). Thus, studies have highlighted the potential for CAs to build a sense of community, increase interpersonal connections, and create positive culture and space for equity and inclusion (Fletcher & Tan, 2022).
We center the literature around CAs as a model of secondary schooling and as a school turnaround strategy because the context of our study sits at this particular intersection. The CA models were adopted in the district we study as an explicit means to improve student and school performance while under pressure from their state because of academic performance within a high-stakes accountability system. In fact, since the start of this policy approach, a handful of other districts have adopted similar approaches to adopting CA models with the intention of driving school improvement (Akron Public Schools, n.d.; Jefferson County Public Schools, n.d.; Rockford Public Schools, n.d.). Thus, this opportunity to learn may provide leading evidence of what we could expect when other schools or districts take a similar approach to improving school and student outcomes.
Scholarship related to CAs has produced mixed evidence of efficacy, with only a small subset of this literature providing contexts that can support causal inference. Earlier descriptive (non-causal) studies of CAs tended to focus on settings where student outcomes were already in need of improvement (see, e.g., Stern et al., 2010), but because they lacked true random or quasi-random variation, it is hard to know if any positive difference in outcomes generated among CA participants was due to the CAs themselves, or other omitted factors that biased these estimates In 2008, MDRC reported on a randomized controlled trial of nine CAs. This work demonstrated that boys randomly admitted to CAs experienced better employment and earnings outcomes up to 7 years after graduating from high school (Kemple & Willner, 2008). In a follow-up analysis of these nine academies, Page (2012) demonstrated that most of the improvement in these employment outcomes for boys was related to their work-based learning experiences. The connection between preparation for work and the CA model is deliberate, and so this finding was consistent with earlier descriptive work (Maxwell, 2001), and consistent with the model’s theory of change. Kemple and Willner (2008) showed no impact on high school graduation. Though improving these attainment outcomes was not the explicit focus of the CA model, the potential to increase them using this model in the MDRC study may have been limited by the very high graduation rates among the control group. This contrasts with the earlier descriptive work (Stern et al., 2010), which found positive associations between CA participation and high school graduation, and where baseline outcomes were much lower in the comparison group, but where the causal attribution could not be made.
A more recent evaluation of a single CA in North Carolina found large positive impacts on the graduation, attendance, and test scores of students randomly admitted to this oversubscribed academy focused on information technology (Hemelt et al., 2019). In this study, data were not available for workforce outcomes; however, these impacts on attainment, learning, and engagement are consistent with other recent evidence from whole-school models that include or emphasize CTE as a central element (Bonilla, 2020; Brunner et al., 2023; Dougherty, 2018). In this context, the CA was implemented in a relatively high-performing setting (where the control mean of graduating from high school was close to 90%). Thus, findings in this setting suggest that it may be possible that CAs could induce improved attainment and learning outcomes, even in a relatively high performing setting.
Since most of the studies of CAs either predate the era of test-based accountability or the adoption of school turnaround models, they do not necessarily offer insight into what one would expect if the CA model was adopted under the higher-pressure regimes that characterized the first 15 years of the 21st century. The recent evaluation in North Carolina of a single CA does suggest, however, that properly structured, a CA could induce improvements in attainment and learning that align with the desired outcomes of school improvement and turnaround strategies.
The parallel and related literature on other types of school turnaround efforts is mixed about whether and how approaches to school turnaround can improve educational outcomes. For example, Chin et al. (2019) found positive impacts of adopting a school turnaround strategy in Newark, New Jersey on English Language Arts achievement outcomes. Similarly, Zimmer et al. (2017) showed that turnaround efforts in Tennessee resulted in higher test scores, and Strunk et al. (2016) showed positive impacts on test scores under the implementation of turnaround in Los Angeles. In contrast, Dougherty and Weiner (2019) found null effects on test scores and attendance under turnaround efforts in Rhode Island, and Papay et al. (2022) showed that the extent to which turnaround efforts were effective related to the resources invested to support those efforts. Most of the turnaround literature has used data from elementary and middle schools, and relatively short post-treatment time frames, which has meant that longer-term outcomes like graduation rates have not been used (e.g., Henry et al., 2019). However, the main consensus across the turnaround literature seems to be that positive impacts on test scores are possible, though likely dependent on the extent to which turnaround efforts include resources in addition to mandates or sanctions (Redding & Nguyen, 2020). Important to this study is that none of these prior studies include turnaround efforts that include CAs.
To summarize, while CA models have been shown to be effective in improving learning outcomes in at least a few settings, some of this evidence is plagued by potential omitted variables bias and the inability to support causal claims, while others causal studies either find no impacts on these outcomes or show impacts but in settings that are not analogous to school turnaround settings. In contrast, the school turnaround literature shows massive variation in impacts of adopting these strategies, with an indication that the likelihood of impact may be related to whether and how additional resources might be used to support such efforts. Thus, we hypothesize that a CA approach in a setting that is otherwise analogous to other turnaround settings could be impactful, but that a priori it is not obvious whether it would be. Thus, our study offers an opportunity to test this hypothesis, even as other districts around the country are adopting or considering CA models as an approach toward improving schooling and student outcomes.
Study Context
In 2005, the focal district of this study faced low graduation rates and low attendance. In an effort to address these challenges, the district was awarded a federal grant and partnered with the local chamber of commerce, several local non-profits, and a national philanthropic organization to implement Freshman Academies (FAs) in 8 of their 16 high schools (we refer to these schools as “early-adopting schools”) in school year 2007 to 2008. The grant website specifies that applicants can select no more than eight schools per grant application, and the abstract from the district’s application states that these eight schools were the largest and highest need in the district. FAs are intended to create smaller learning communities and to ease the transition to high school, by assigning students to smaller communities of peers and teams of teachers.
In school year 2009 to 2010, these early adopting schools as well as four additional schools (“late adopters”) formalized the model and prepared to implement CAs for 10th through 12th graders. In these 12 high schools, all ninth graders participate in the FAs. At the end of their ninth grade year, all students participate in a district-wide career fair (CF) to learn about the CA choices available at their school. Each school has between two and four CAs, with several pathways nested within each CA. Students select a CA within their school (such as Health Science and STEM) and then select one of the pathways within the CA (such as Diagnostic Services or Therapeutic Services) for their 10th through 12th grade years. In 10th grade, students participate in an industry field trip, as 11th graders they job shadow an industry partner, and as 12th graders they reflect on their CA experiences through a capstone course.
The implementation of CAs represents a substantial departure from the previous school structure, and from the school structure of most comprehensive high schools. The CAs create smaller communities, in which students take both their core academic classes as well as electives aligned with their CA themes in grades 10 to 12. Elective courses are organized around the occupational themes and align with state CTE elective course offerings. Core academic teachers in math and English language arts (ELA), for example, are paired with a CA and are expected to tailor their lessons and assignments to the academy theme and content. For example, in a health science academy, one pathway might relate to nursing. In this case, ELA and math lessons might offer writing or word problem examples that use content and contexts of the health professions or that reinforce competencies in those fields while also addressing state standards in ELA and mathematics. To support the transition to this model, the district invested in professional development for all teachers during the rollout, and reconfigured the school day so that core academic and CTE teachers within the same CA share planning time to facilitate collaboration.
As shown in Table 1, schools rolled out these CA activities gradually over time. The first CF was held in 2009 to 2010. Then, student industry field trips (FTs) for 10th graders were taken to scale in 2011 to 2012. In 2012 to 2013, the student job shadowing (JS) for 11th graders was taken to scale. In 2013 to 2014, capstone research classes (CRC) were implemented for 12th graders.
Career Academies Rollout
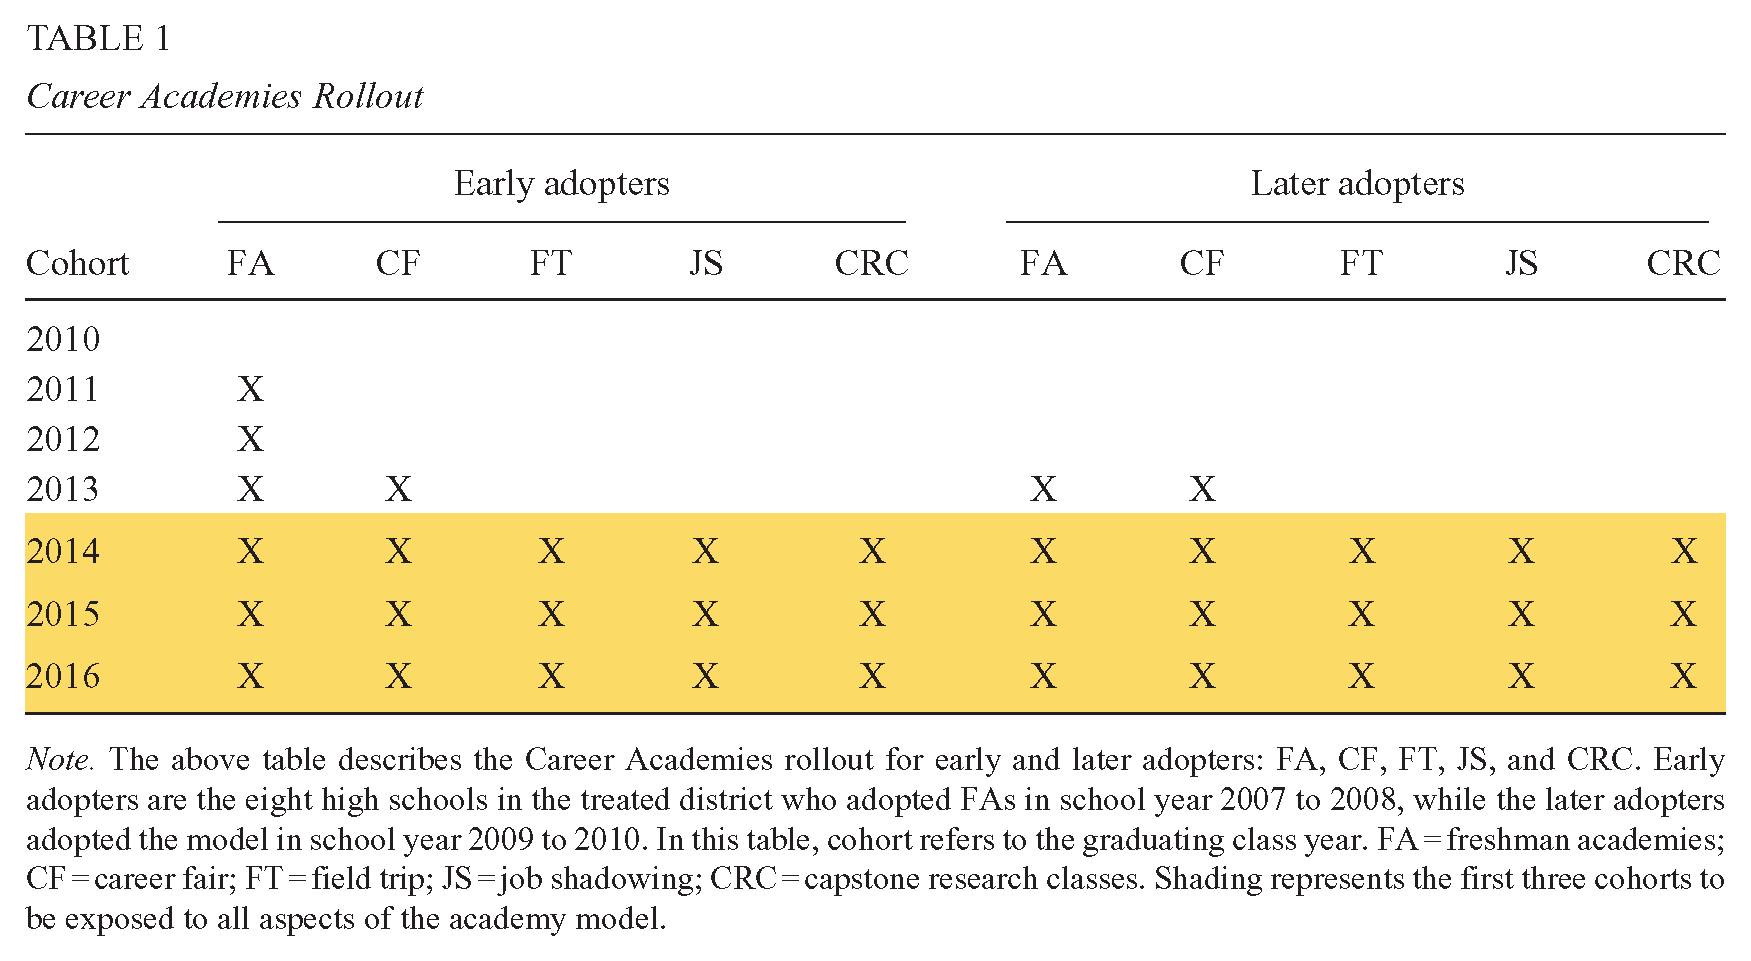
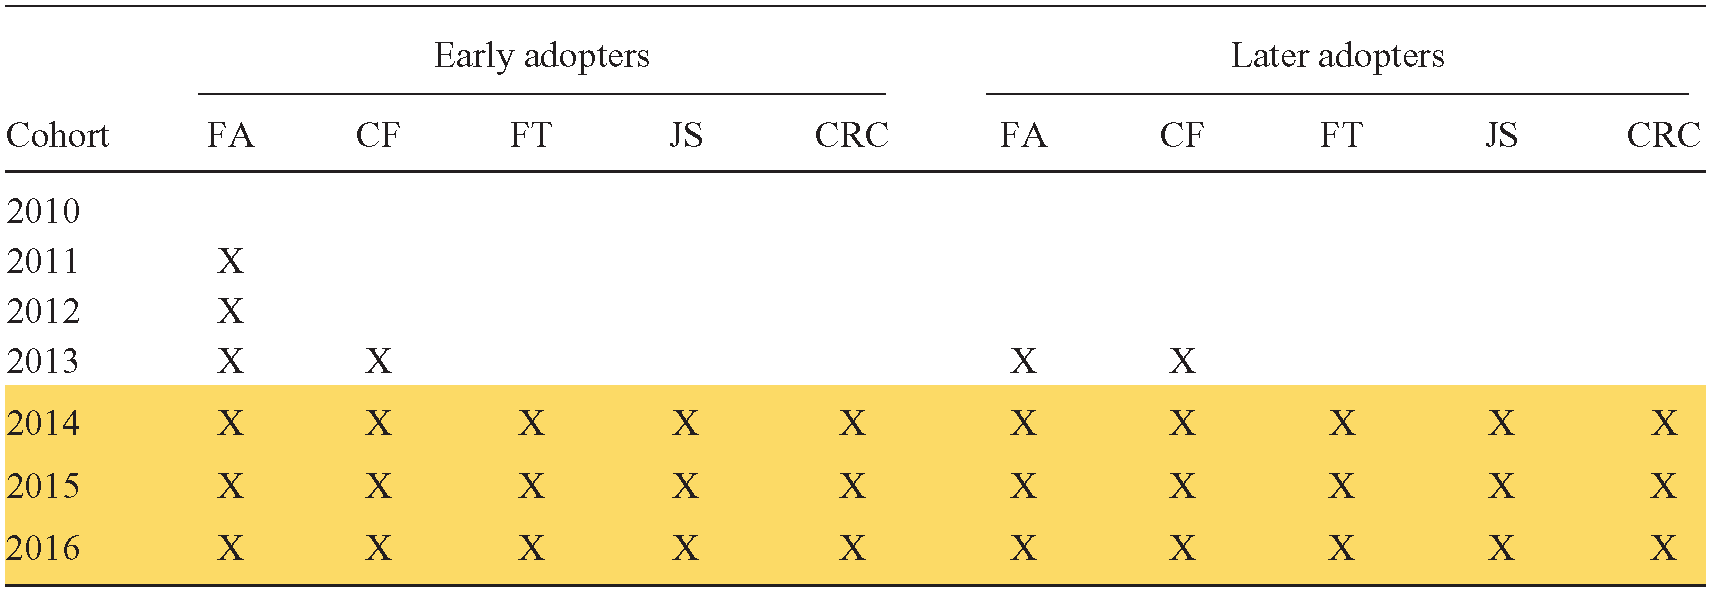
Note. The above table describes the Career Academies rollout for early and later adopters: FA, CF, FT, JS, and CRC. Early adopters are the eight high schools in the treated district who adopted FAs in school year 2007 to 2008, while the later adopters adopted the model in school year 2009 to 2010. In this table, cohort refers to the graduating class year. FA = freshman academies; CF = career fair; FT = field trip; JS = job shadowing; CRC = capstone research classes. Shading represents the first three cohorts to be exposed to all aspects of the academy model.
In practice, this rollout means that at the early adopting schools, the graduating cohorts of 2011 and 2012 participated in FAs, but not necessarily in the full CA model with the four central activities and in later adopting schools, the graduating cohort of 2013 participated in FAs without the full CA model. In both early and late adopting schools, the first graduating cohort to participate in all four CA activities as well as FAs is the class of 2014. We consider these four central activities to be the eventual standard of what constitutes the full CA treatment, and so we focus on dynamic treatment effects to account for the gradual rollout (described in more detail below).
Over the last 10 years, the district has retained the CA model in these 12 high schools and continued to build partnerships with the local business community. Currently, of the 20,000 high school students in the treatment district, roughly 16,000 participate in CAs. Four high schools in the district did not adopt CAs, and they differ in important ways from the rest of the schools in the district in that two of them are academic magnets with exam-based entrance requirements that consistently have graduation and attendance rates above 95% and were therefore not the focus of the school turnaround mandate from the state.
The rollout of CAs in the district, in which a majority of the high schools in the district implemented CAs while the rest of the state did not, presents an opportunity to perform an evaluation using methods that support causal inference for a schooling model that has grown, but has limited evidentiary basis. Most other forms of turnaround were imposed, top-down, and punitive. This context provides an example where, while operating under threat of takeover, the district and schools retained autonomy to develop their own turnaround model, in a context that was connected to prior theory.
Research Design
We aim to address three research questions in this study. First, we ask, did CA implementation increase graduation rates in the treated district, relative to other schools in the same state that did not implement CAs? Second, we ask, did treated schools with lower pre-treatment graduation rates experience differential impacts in graduation rates relative to schools with higher pre-treatment graduation rates? Finally, we ask, what characterizes the participation rates in activities across the different academy themes that might shed any light on potential differences in the implementation and context of the treatment that might relate to any impacts of the CA model?
To answer our research questions, we use a nonparametric event study as well as a parametric difference-in-differences design with school and cohort fixed effects to compare treated schools to the untreated schools in the rest of the state. To attempt to address differences between the treated schools and the comparison schools in the rest of the state, we construct an additional comparison group using nearest-neighbor propensity-score matching without replacement (Rosenbaum & Rubin, 1983) based on school size, student characteristics, and pre-treatment outcomes. The propensity-score matching approach as a modification to the standard two-way fixed effects specification improves the similarity of treated and comparison schools and aims to reduce threats to the internal validity of our inferences, offering evidence of robustness of estimates to different specifications. However, we note that this approach is still imperfect because the schools in the treated district differ so notably from the rest of the state and thus makes using propensity-score matching as a means to improve comparisons more difficult. Taken together, we consider the extent to which the results using these two approaches compare and tend to suggest a consistent story. As we discuss below, we also address other requirements for valid causal inference when using a difference-in-differences research design.
Data
School-Level Data
Our study uses a dataset that includes aggregate school-level information from school year 2008 to 2009 through 2015 to 2016. We exclude more recent years of data from our analyses because of changes to the data system and the related reporting of these figures. The dataset includes demographic, test score, attendance, and graduation data at the school level, meaning that we have by-cohort measures of our outcomes (4-year graduation rates, ninth grade attendance rates, and average standardized test scores), as well as cohort demographic characteristics. Our dataset includes control variables for cohort size and school enrollment, and achievement data as well as proportion of Black, White, and Hispanic/Latino, economically disadvantaged, special education students, and immigrant students.
The state sample includes 211 high schools in the state serving students in grades 9 to 12, excluding schools that opened or closed during the panel, alternative/special schools, small schools (those with fewer than 75 students per cohort), and schools that were subject to state turnaround. We exclude schools in the comparison district that were subject to other state turnaround efforts because we do not think they represent a reasonable counterfactual to the treatment, given the additional supports and pressures they received. 1 Two schools in the district that were treated are excluded from this analysis; one school opened after the study period began, and one school was subject to other turnaround efforts.
Program Data and Institutional Details
To capture the treatment schools’ implementation and to add texture to the descriptive trends, we also use information from district annual reports, available on the district website. We code information by year to capture the subject focus of the academies, and participation rates in the key academy activities in school year 2014 to 2015 (the first year in which this information was available).
Descriptive Statistics
The treated schools in the sample differ from the schools in the rest of the state. In Table 2, we compare descriptive statistics for school-level student demographics, enrollment, and pre-treatment outcomes of the 10 treated schools to propensity score-matched schools (described in greater detail below) and to the rest of the state. Treated schools are larger, on average, and enroll more students of color and immigrant, economically disadvantaged, and special education students. They also have lower pre-treatment graduation rates and average standardized test scores than the comparison groups.
Descriptive Statistics of Sample, Pre-Treatment

Note. The table describes average enrollment, proportion of students in the school of each of the above characteristics, and average 4-year graduation rate in 2009 and average standardized end-of-course exam scores and ninth grade attendance rates in 2010. Treated schools in Column 1 include the 10 schools in the sample who adopted career academies. Column 2 includes the 10 propensity score-matched schools, selected using nearest-neighbor matching without replacement. Column 3 includes all high schools in the rest of the state in untreated districts.
Empirical Framework
Measures
The primary outcome of interest is school-level 4-year graduation rates. We define groups by their graduation cohort, so that students that were ninth graders in SY 2006 to 2007 are part of the 2010 cohort. We model the outcome as a function of a binary Treat variable (equal to 1 for all schools within the treated district that adopt CAs, and 0 otherwise) and a binary variable Post for the observation occurring within the post period, once all four components of the CA model had been rolled out (equal to 1 for cohorts post-2013 and equal to 0 otherwise). We also include ninth grade attendance and average standardized Algebra I and English achievement scores (exams typically taken in ninth grade, standardized within year to have a mean of 0 and standard deviation of 1) as outcomes.
Timing of exposure to the academies differs for schools that were early or later adopters, and we explore differences by timing of exposure in later heterogeneity analyses. Because early and late adopters rolled out the FAs differently and the test scores and attendance outcomes pertain to ninth graders, the first treated cohort for early adopters for these outcomes is 2011 and the first treated cohort for later adopters for these outcomes is 2013. Consequently, the post period is different for the ninth grade outcomes for early versus later adopters, and we model these outcomes separately for the two groups. For ninth grade outcome models concerning later adopters, Post is equal to 1 for cohorts 2013 and later. For the ninth grade outcome models concerning early adopters, Post is equal to 1 for cohorts 2011 and later, and equal to 0 otherwise.
In our preferred specification, we include controls for school enrollment as well as proportion of Black, White, and Latino, economically disadvantaged, special education students, and immigrant students.
Analytic Approach
Our identification strategy compares changes within treated schools over time to other non-treated schools in districts that did not adopt CAs. Our identification relies on the assumption of parallel trends in outcomes across treated and control units in the absence of the treatment. In this setting, this suggests that schools that adopted the CA model would have followed similar trends in outcomes as schools that did not adopt this model, conditional on the covariates. This assumption is not directly testable, but we test it indirectly by (a) observing parallel trends in the pre-policy change period, (b) testing for parallel trends in the covariates in the pre-period, and (c) verifying whether our results are sensitive to the inclusion of the covariates. Identification also relies on the absence of other simultaneous changes in the treated or comparison setting that might otherwise explain the presence or absence of effects. Our knowledge of the state context, and extensive conversations with district officials suggest that there are no such concerns.
Propensity Score Matching
To account for the fact that treated and non-treated schools might be quite different, we take two approaches to mitigating these differences. In our first approach, we generate propensity scores using pretreatment school-level demographic information across several dimensions (proportion White, Black, Hispanic, and other race, proportion immigrant, proportion economically disadvantaged, proportion special education, pre-treatment cohort size, and pre-treatment graduation rates, ninth grade attendance rates, and English I test scores), using nearest-neighbor matching without replacement. All schools in the statewide comparison sample are included in the pool of potential comparison schools. As shown in the Supplemental Appendix Table A1 in the online version of the journal, propensity-score matching results in more similar samples where the only suggestively significant difference in school characteristics between the matched samples is in the proportion of immigrant students (p = .08). We note that there is limited overlap between the propensity to experience treatment among treated and comparison schools. This is because of the big differences in the district settings for the treated schools and the other high schools in the state (see Supplemental Appendix Figure A1 [available in the online version of this article] for a figure presenting the area of common support). This challenge is one reason we prefer the approach that uses the full state sample. 2 We present results from both comparison groups, but prefer the approach that uses the full state sample because it allows us to statistically adjust for the systematic differences between treated and comparison schools in terms of level differences pre-treatment, but while also retaining statistical power from using all observations, an improvement over the matched sample.
Event Study Specification
To allow for potentially dynamic impacts of treatment, we first estimate effects on graduation rates using an event study specification in which the reference year is the year prior to the first treated cohort’s graduation year (2013). This approach allows us to model anticipatory effects as well as variation in the treatment effects across time without making parametric assumptions about the treatment effects. We specify our event study model as follows:

We model graduation rates for school s in cohort t. We model the outcome as a function of a series of year indicators (
We do not model the ninth grade outcomes in the event study framework because we do not have enough years pre-treatment for the early adopting schools.
Difference-in-Differences
We also model the relationship between the treatment and the outcome using a difference-in-differences design with school and year fixed effects as follows:

where Y is a generic outcome to stand in for the several outcomes we address (graduation rates, attendance rates, and test scores),
Our model specification is the same for all outcomes; however, for the full CA treatment, we fit models with only the graduation rates as an outcome because the ninth grade outcomes (test scores and attendance rates) are measured before students have experienced the full CA model. We include these ninth grade outcomes only in the models where we capture the effects of FAs among early and later adopters (as we describe below).
Mechanisms: Heterogeneous Effects
We explore heterogeneous effects by pre-treatment graduation rates, as we anticipate schools’ capacity to implement the treatment and for growth may be related to pre-treatment graduation rates. We identify the treatment schools with below-average pre-treatment graduation rates as well as the treatment schools with above-average rates, relative to the district average, and then fit the regressions separately for these two groups.
We also model the ninth grade outcomes (test scores and attendance) separately for early and later adopters to account for differences in the initial implementation year. Taking this approach, we aim to address the differences in the demographic makeup of these two groups of schools, as well as the ways that rollout in later adopting schools may have benefited from lessons that the district learned from the eight early-adopting schools.
Results
Across specifications and comparison groups, our estimates suggest positive treatment effects on graduation rates that may have increased over time. Using both an event study specification as well as a difference-in-differences model with two comparison groups, we find that the estimates are similar in magnitude and direction across the specifications, though we note that some estimates are less precise and so should be interpreted with that in mind.
In Figure 1, we present event study estimates for high school graduation. These estimates suggest that in the first treated year, schools that adopted CAs had graduation rates that were three percentage points higher than the comparison, relative to the base year and that effects appear to have increased over time (Figure 1).
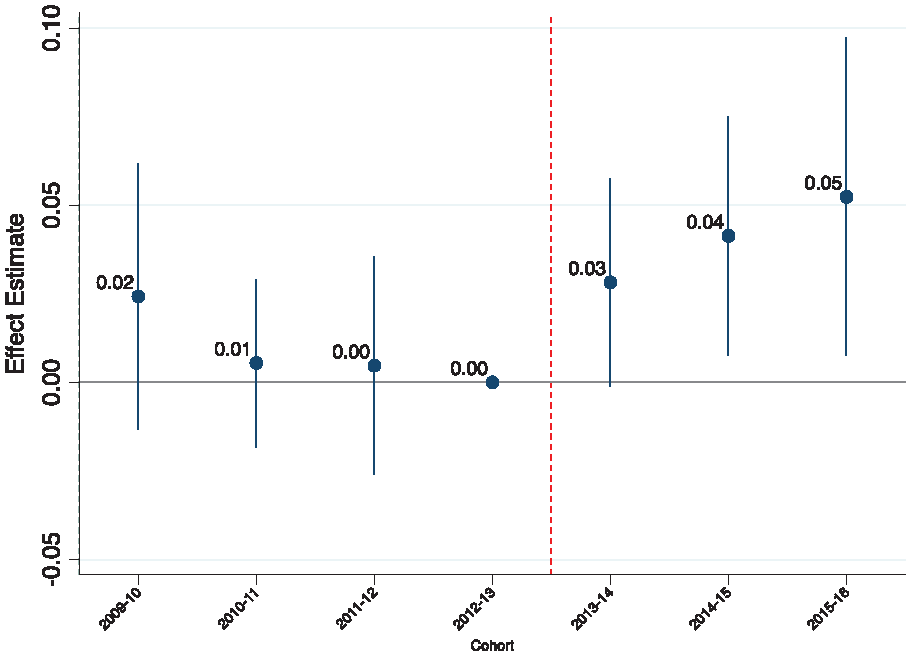
Event study depicting effect of CAs on graduation rates.
The parametric two-way fixed effects models yield similar estimates across multiple specifications. Specifically, the estimates we report in Table 3 suggest that the adoption of CAs resulted in a 3 percentage-point increase in graduation rates. Our preferred specification, which uses the full state sample and includes covariates (Column 2), yields almost identical point estimates as the approaches presented in Columns 1, 3, and 4, which include the propensity-matched sample and present estimates from models with and without covariates. The propensity-matched sample is smaller than the full state sample by a factor of 10 and, therefore, is less precise given the reduced statistical power. However, even in this smaller sample, the point estimate is consistent with the other specifications.
Effect of Career Academies on Graduation Rates
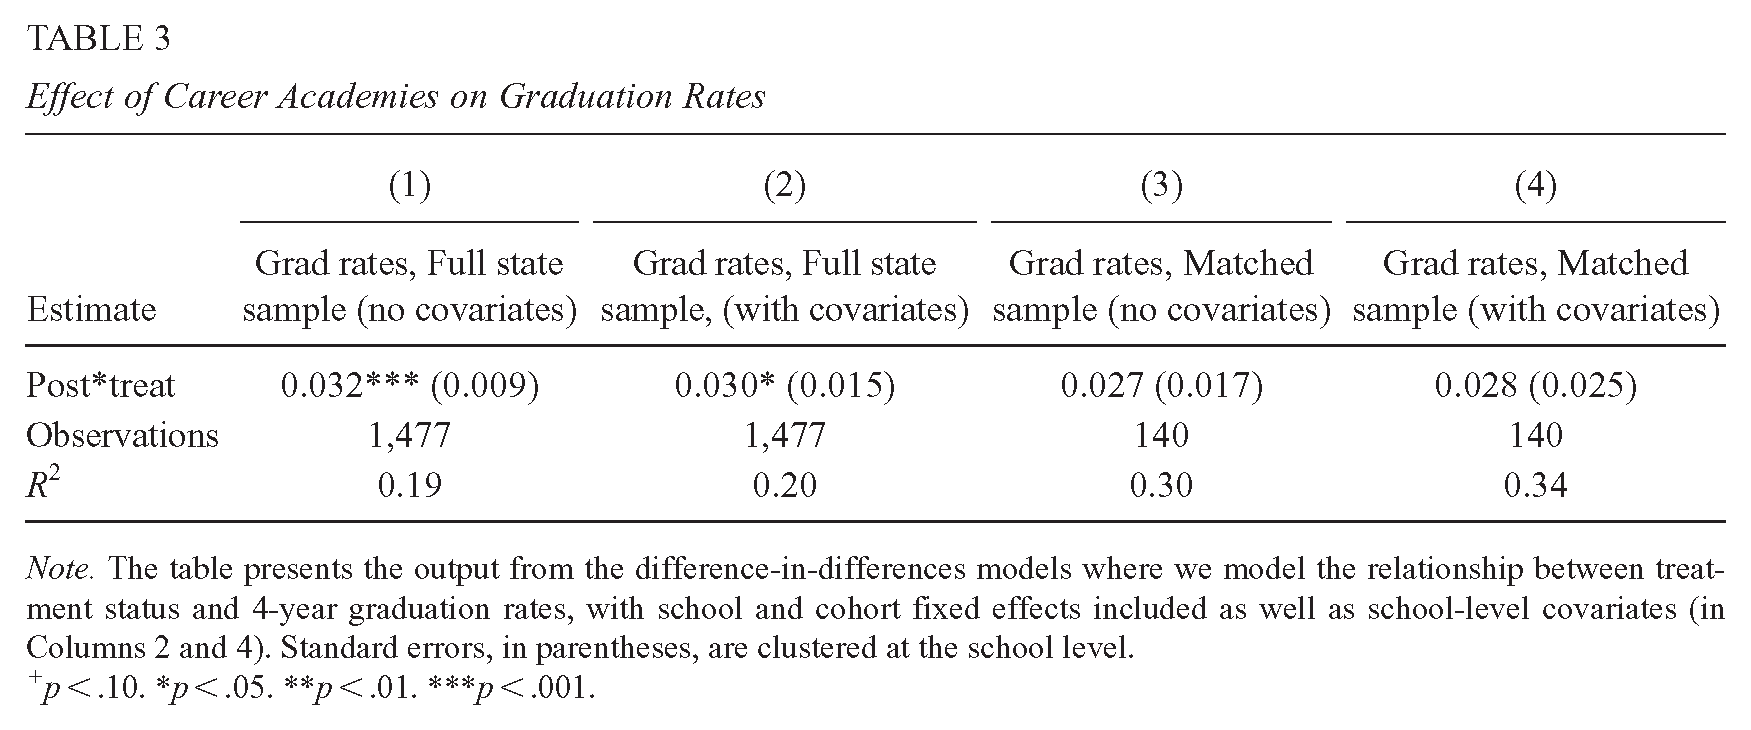
Note. The table presents the output from the difference-in-differences models where we model the relationship between treatment status and 4-year graduation rates, with school and cohort fixed effects included as well as school-level covariates (in Columns 2 and 4). Standard errors, in parentheses, are clustered at the school level.
p < .10. *p < .05. **p < .01. ***p < .001.
Threats to Internal Validity
Two alternative explanations could explain our results and, therefore, represent potential threats to the inference we would like to make. First, changes in student demographics that coincided with CA implementation might have altered the sample of students leading us to attribute changes in outcomes to the schools, rather than the population of students attending them. Second, if increased district spending coincided with the implementation of CAs, we might erroneously attribute changes in outcomes to the CA. Below, we check the extent to which the inclusion of these factors changes the interpretation or validity of our results.
Falsification Check: Changes in School Characteristics
One potential threat to the internal validity of our study is that changes in student demographics could drive results, if for example more affluent families moved into the treated district in response to the intervention or if the district composition changed in significant ways in the post period at the same time that the intervention was implemented. To check for this potential source of bias, we fit models where we include each of the student demographic variables (proportion Black, Hispanic, White, other race/ethnicity, immigrant, economic disadvantage, special education, and cohort size) as the outcome.
As shown in the Appendix (">Supplemental Appendix Table A2 in the online version of the journal), our results suggest that the proportion of Hispanic students, immigrant students, special education students, and economically disadvantaged students increased in the post period in treated schools in ways that it did not in the untreated schools and that at the same time the proportion of Black students decreased. We are not aware of any reason to think that these changes are in response to the treatment. One concern might be that changes in student population explain the positive effects of treatment. We note that the results in fact largely suggest that the proportions of marginalized and historically disadvantaged students, who face more barriers to academic success, increased in ways that run counter to the hypothesis that more advantaged students enrolled in the district during this period. While there is some evidence of demographic change that leads to a smaller share of Black students, the contemporaneous changes are increases in Hispanic students, immigrant students, and lower-income students. This compositional change does not seem to be of the form that would suggest positive selection that might undermine the treatment effects. Furthermore, these increases are reflective of broad demographic trends in this focal district that are not fully representative of the state and therefore the comparison schools. Thus, it seems unlikely that this is differential sorting in response to the establishment of the academies.
Increased District Spending
A second alternative explanation for our findings could be increased district spending that coincided with the implementation of CAs. We are not aware of increased district spending from our conversations with district administrators, but to further test for the presence of increased spending, we downloaded district-level F-33 fiscal data from the National Center for Education Statistics from 2005 to 2015 and graphed average elementary and secondary expenditures for the treated versus comparison districts (divided by total enrollment, to get the values on the same scale). In Supplemental Appendix Figure A2 (available in the online version of this article), we show annual elementary and secondary expenditures, with vertical lines indicating when FAs and CAs were first implemented.
In the panel in the top left, we show overall elementary and secondary expenditures. These data are also available at greater levels of detail (instruction, support services, and other expenditures), which we display in the three subsequent panels. We do not see visual evidence to suggest that the treated district increased their spending during the implementation period in ways that are different from the rest of the state. We note that there are limitations to this approach, including the fact that the relative share of enrollment is always larger in elementary versus secondary schools, but we still think that these data provide important context around changes in budget over time.
Mechanisms
We next explore mechanisms to understand heterogeneity in policy impact by school characteristics and to understand how policy rollout and implementation might facilitate this improvement in graduation rates. To better understand these effects on attainment and for whom this policy was most impactful, we fit our models separately based on schools’ pre-treatment graduation rates and rollout timelines. We find that schools that had lower graduation rates at baseline appear to have experienced larger impacts. Because we anticipate that the CA model may also influence the shorter term based on experiences in FAs, which were rolled out differently for early and late adopters, we also model the ninth grade outcomes (ninth grade attendance and test scores) as well as graduation rates separately for the two adopter groups and find suggestive evidence on test scores for both groups.
To try to understand the source of the overall impacts of the adoption of CAs, we use information on elements of the academy experience and engagement with these elements to present a few possible mechanisms that could plausibly explain these effects. Though we cannot make causal attributions between these factors and the causal impacts, they provide more context for understanding the effects we uncover.
Rollout Timeline and the Contribution of FAs
We test the influence of the introduction of FAs (at the start of the CA model adoption process) on our four outcomes, as shown in Table 4. Overall, our results suggest that the estimates are positive for the English test score outcome, but that there is some heterogeneity by rollout timing. We note that early adopting schools had lower graduation rates pre-treatment, and so heterogeneity by rollout timing may also be due to differences at baseline (See Supplemental Appendix Table A4 in the online version of the journal). For both early and later adopters, the estimates are positive and statistically different from zero for the English test score outcome and the Algebra I score outcome is also statistically different from zero among early adopters. We see no effect on graduation rates for either group, perhaps suggesting that FAs alone were not enough to move graduation rates. In Supplemental Appendix Table A3 (available in the online version of this article), we combine the early and late adopters and demonstrate that across all schools, the FA on their own may have moved ELA scores, but show fairly precise zeros for graduation rates. We interpret these results with caution because we only have 1 year of outcomes pre-treatment for the early adopters, so our dependence on 1 year as representative is heightened.
Effect of Freshmen Academies on Outcomes, Modeling Early and Late Adopters Separately

Note. The table above presents the output from the difference-in-differences models where we model the relationship between treatment status and the graduation rate, average attendance, and test score outcomes, with school and cohort fixed effects included. We model the relationships separately for early and later adopters, relative to untreated schools in the rest of the state. Early adopters are the eight high schools in the treated district who adopted freshman academies in school year 2007 to 2008, while the later adopters adopted the model in school year 2009 to 2010. Standard errors, in parentheses, are clustered at the school level.
p < .10. *p < .05. **p < .01. ***p < .001.
Heterogeneity in Effects by Pre-Treatment Graduation Rates
Our evidence suggests that the effects of CAs on graduation rates may have been largest in schools that initially had the lowest graduation rates. As presented in Table 5, our estimates from the difference in differences models reveal larger point estimates for treated schools that had lower pre-treatment graduation rates (nearly 4 percentage points) relative to treated schools with higher graduation rates pre-adoption (between 0 and 2 percentage points). The standard errors on each estimate are such that we cannot strictly rule out that they are not statistically different from one another.
Effect of Career Academies on Graduation Rates, by Pre-Treatment Graduation Rates

Note. The table above presents the output from the difference-in-differences models where we model the relationship between treatment status and the graduation rate, with school and cohort fixed effects included. We model the relationships separately schools with higher and lower pre-treatment graduation rates, relative to untreated schools in the rest of the state. Standard errors, in parentheses, are clustered at the school level.
p < .10. *p < .05. **p < .01. ***p < .001.
We note that further splitting the sample results in elevated noise in the event study, but that the results from the event study echo those from the parametric specification and suggest that early adopters saw pronounced, immediate, impacts, whereas the later adopters (of which there were only a few and initially higher performing) did not see effects (see Supplemental Appendix Figure A3 [available in the online version of this article], where we use the full sample, and Supplemental Appendix Figure A4 [available in the online version of this article], where we show the results with only the matched sample).
We also fit models where we include pre-treatment graduation rates as a continuous variable in a three-way interaction with the treatment effect (see Supplemental Appendix Table A5 in the online version of the journal). These results, though imprecise, do not provide any evidence that undercuts the emerging story: that the relationship between the treatment effect and graduation rates appears to be negative, in that schools with higher graduation rates pre-treatment may have realized smaller gains in graduation rates as a result of the intervention than those with lower graduation rates pre-treatment.
Academy Focus and Participation Rates
We also report implementation measures and the substantive focus of the academies to provide some context and answer to our third research question. In Table 6, we summarize average school-level rates of participation in academy activities, weighted by school size, and note that participation rates are high overall and highest for the CF (86%), which is an element offered at the end of grade 9 and is focused on broadening student familiarity with different potential future employment and occupational options. Job-shadowing, which is typically onsite and a more detailed exposure to job tasks and settings were less common. We also note that all schools implemented at least one high-growth academy focused on IT, STEM, or health sciences, whereas IB/Research is much less common (3 out of 10 schools had at least one IB/Research-themed academy in 2014–2015). The finding around high-growth academies is particularly salient given research suggesting that coursework in applied STEM is associated with positive outcomes for students (Gottfried, 2015). In comparison schools, we cannot observe whether similar elements might also be present, however, each of the elements reported here are part of the implementation of the CA model and so can be thought of as providing context for how to understand the treatment-control contrast in this setting.
Participation Rates and Academy Themes, 2014 to 2015

Note. The table above describes the average participation rate in each of the four CA activities in school year 2014 to 2015, weighted by enrollment, as well as the percentage of schools who implement at least one academy in each of the six focus areas we created in our coding process. This information comes from district annual reports on the district website. CA = career academy.
Discussion and Conclusion
Using school-level panel data, we estimate the impact of CAs adoption on student outcomes in high school in a context subject to accountability pressure. Our estimates are among the first to capture the effects of CAs as a strategy for school turnaround in the context of a large district, as well as some of the first to show a larger-scale implementation of CAs that can provide plausibly causal estimates of the impact of adopting this model. Similar to Hemelt et al. (2019), our estimates are suggestive of positive impacts of CAs on graduation and test score outcomes. Our findings contrast with the Hemelt et al. (2019) study, however, insofar as they are representative of a large district implementing a new educational model in response to accountability pressures. Importantly, adoption of the CA model as a type of school reform or improvement is focused on the student experience across multiple dimensions (not solely on test score improvement). Because the CA model spelled out the need to implement smaller themed educational settings, to incorporate employers and work-based learning, and used local employment needs as a driver of academy them choice, there are some clear ways that we might expect the adoption of this model to improve student engagement and attainment. This stands in contrast to some other educational turnaround or reform strategies where the hypothesized mechanism behind the presence or absence of effects might be more of a black box (Dougherty & Weiner, 2019).
We complement our impact estimates with descriptive evidence that student participation in central elements of the CA experience was reported to be high, even in the early days of adoption and that, unlike the vocational programs of the past, virtually all students participate and they have opportunity to participate in academies in high-growth areas, which research suggests may be especially beneficial for students (Bonilla, 2020).
An important element of our findings is that our event study estimates suggest potential dynamic effects of the adoption of CAs on high school graduation, with estimates getting larger over the first several treated cohorts. Thus, while the parametric difference in differences lead to similar conclusions, our two-pronged approach to laying out the effects provides suggestive evidence that impacts become stronger over time as schools have more opportunity to fully implement the elements of the CAs.
Whereas the previously available causal evidence on CAs was generated in more advantaged contexts, the current study suggests that the CA model may also be effective in settings where both career readiness and overall attainment and performance growth is the goal, and where baseline performance was low (Kemple, 2004). Importantly, the suggestive CA effects in our study appear to be stronger for students in schools with lower achievement at baseline, suggesting that the CA model may be a compelling policy solution for schools that policymakers would most like to target and support.
We note that our estimates represent the effect of the CA model as a school turnaround strategy, and that the treatment is implemented in a context with school turnaround pressures where, especially for schools with low performance pre-treatment, pressure to improve may be particularly intense. The comparison group that we use as a counterfactual did not necessarily face the same pressures because they were not subject to the specific threat of school turnaround (though all schools were operating in a state context where turnaround was an option for schools with substandard outcomes), and so our estimates reflect the combined effect of both the CA model and school turnaround pressures.
Though we use several comparison groups, our analyses are constrained by the availability of school-level rather than student-level data. Similarly, because the complex rollout is not perfectly observed, we cannot disentangle the full range of mechanisms or separately evaluate CAs or FAs. We also do not have more granular data on spending to understand the extent to which increased spending on elements that could be central to the CA or FA helps to explain our results, though we can rule out big changes in district-level spending, relative to districts that did not implement CAs at scale. Still, the robustness of our findings across model specifications, including the fact that the parametric and nonparametric approaches produce convergent estimates and reveal no evidence of treatment effects in the pre-period give us more confidence that the effects we observe are not simply related to the sample or to modeling choices. Our findings support Hackmann et al. (2018) key elements for CA structures that include cross-sector collaborations, the need for interdisciplinary curriculum, strong leadership, and an iterative system of collecting and analyzing data. Moving forward, states and districts hoping to improve outcomes for their students may want to consider implementing the CA model, especially in line with the key elements highlighted above. Future prospective studies of the implementation of this model should build in evaluation elements that could allow for the disentangling of mechanisms from overall effects. Such work would provide key evidence to both policymakers and practitioners for implementing or improving CA models.
Supplemental Material
sj-pdf-1-epa-10.3102_01623737241289152 – Supplemental material for Can Career Academies Work as a School Turnaround Strategy?
Supplemental material, sj-pdf-1-epa-10.3102_01623737241289152 for Can Career Academies Work as a School Turnaround Strategy? by Hannah C. Kistler, Joshua Childs and Shaun M. Dougherty in Educational Evaluation and Policy Analysis
Footnotes
Declaration of Conflicting Interests
The author(s) declared no potential conflicts of interest with respect to the research, authorship, and/or publication of this article.
Funding
The author(s) disclosed receipt of the following financial support for the research, authorship, and/or publication of this article: This work was supported, in part, by a grant from the Institute of Education Sciences (#R305N180005) through the Career and Technical Education Research Network.
Notes
Authors
HANNAH C. KISTLER, PhD, is a postdoctoral research associate at the Annenberg Institute for School Reform at Brown University. Her research focuses on how educational policies impact teacher supply and student outcomes, with an emphasis on schools in historically underserved communities.
JOSHUA CHILDS, PhD, is an associate professor of education at the University of Texas at Austin. His research examines cross-sector collaborations, scaling interventions for educational improvement, and expanding educational opportunities through concentrated policy design and implementation.
SHAUN M. DOUGHERTY, EdD, is a professor of education and policy at Boston College. His research focuses on the use of quantitative research methods to evaluate the impact of educational policies and programs. He emphasizes understanding how the requirements, incentives, and behaviors that those policies produce develop human capital.
References
Supplementary Material
Please find the following supplemental material available below.
For Open Access articles published under a Creative Commons License, all supplemental material carries the same license as the article it is associated with.
For non-Open Access articles published, all supplemental material carries a non-exclusive license, and permission requests for re-use of supplemental material or any part of supplemental material shall be sent directly to the copyright owner as specified in the copyright notice associated with the article.