
Abstract
This study draws on a comprehensive performance-based funding (PBF) dataset and up-to-date difference-in-differences econometrics to examine the impacts of specific policy features (e.g., share of institutional revenue at stake and equity metrics) on college access and selectivity. We find suggestive evidence that increases in the share of revenue at stake are associated with decreases in racially minoritized student enrollment. Meanwhile, equity metrics may not be enough to boost enrollment among underserved students. Ultimately, however, our conclusions are limited due to various potential sources of bias, unconvincing pre-trends, and wide confidence intervals. While findings offer limited insight into the impacts of specific design features, they point to limitations of PBF—regardless of design—in expanding access and reducing inequities at 4-year colleges.
Keywords
Historically, states have allocated funds for public higher education as a way to promote upward mobility, subsidizing colleges and universities in an effort to encourage enrollment by maintaining relatively low tuition levels for students. State funding for public colleges and universities is associated with increased college enrollment, particularly among Black and Latinx students (Monarrez et al., 2021). However, with rising tuition levels, increasing student debt burdens, and stagnant graduation rates, one popular state policy response has been performance-based funding (PBF). PBF links a portion of state appropriations for public colleges and universities to metrics that focus on student progression toward a degree, degree completion, or other student outcomes (Dougherty et al., 2016). In 2020, 32 states had PBF, and 41 states had PBF for the community college sector, 4-year sector, or both at some point over the last two decades (Rosinger et al., 2022).
Research that examines the impacts of PBF generally concludes that PBF does not consistently improve degree completion (see Bell et al., 2018; Li, 2021; Ortagus et al., 2020, for recent literature reviews). A much smaller body of research examines the unintended consequences of PBF policies, such as rising admissions standards and restricted access among historically underserved students at 4-year institutions. For instance, prior studies in Indiana and nationwide have found that PBF policies led to increased selectivity at 4-year universities and decreased enrollment among some student populations (e.g., Birdsall, 2018; Gándara & Rutherford, 2020; Umbricht et al., 2017). However, there is far less evidence regarding the impacts of PBF on college access than there is on college completion (Ortagus et al., 2020) despite evidence that college enrollment by race and income has become more unequal over time (Astin & Oseguera, 2004; Baker et al., 2018; Ford et al., 2021). In fact, we are aware of just two studies that examine the impact of PBF on enrollment in 4-year colleges nationwide (Gándara & Rutherford, 2020; Kelchen, 2018), despite the widespread use of performance metrics to allocate funds for public colleges and universities. Therefore, this study offers critical information to state policy-makers regarding the extent to which PBF policies can be designed to reduce inequities in college enrollment.
This study further extends prior research on the consequences—both intended and unintended—of PBF policies in several key ways. First, prior research has often used a binary treatment variable—whether a PBF policy exists or not—to investigate the effects of PBF (e.g., Hillman & Corral, 2017; Kelchen & Stedrak, 2016; Larocca & Carr, 2020; Tandberg & Hillman, 2014). This approach estimates a single overall effect for a heterogeneous set of policies whose features change over time and vary across states. For instance, PBF policies vary considerably across states and within states over time in the share of funds tied to performance (ranging from less than 1% to 100%). Figure 1 shows the 33 states that have had PBF for the 4-year sector and the share of funds at stake in each from 1997 to 2019.
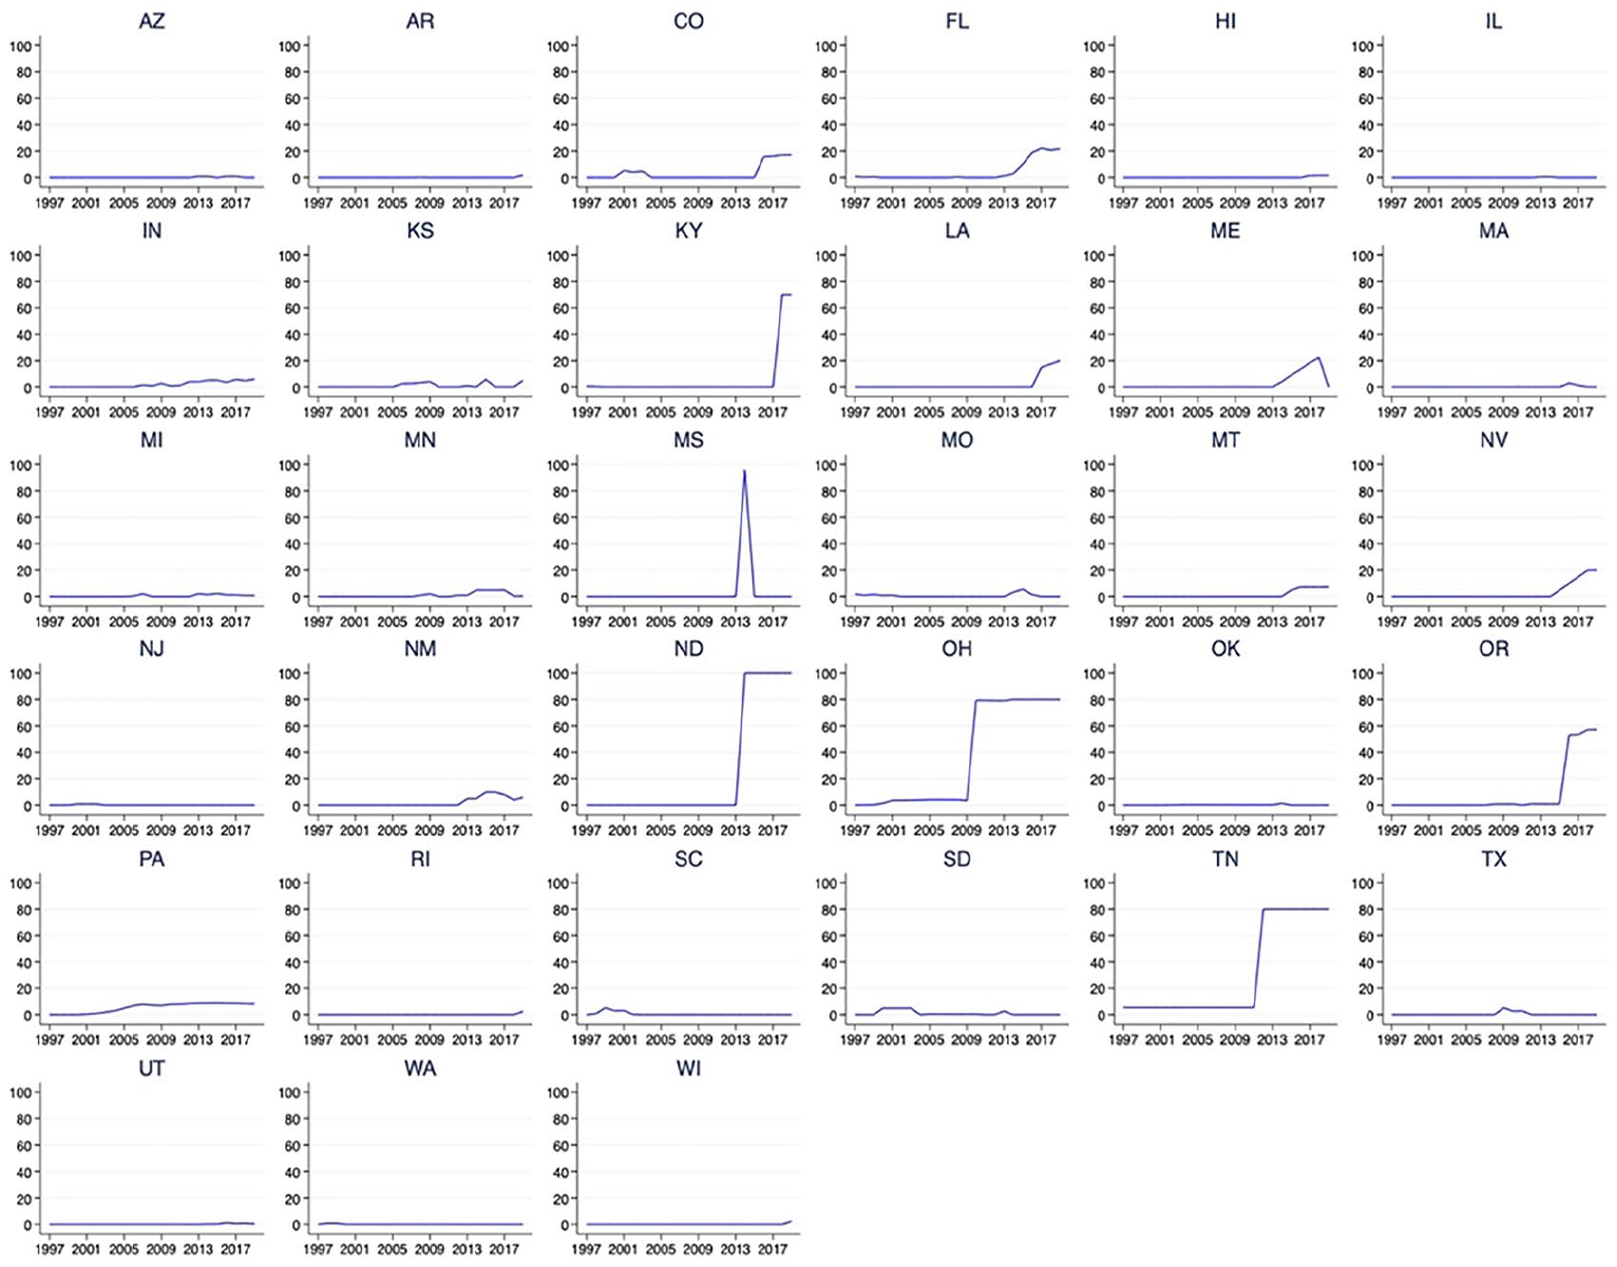
Percent of funds at stake under state PBF policies for the 4-year sector.
Prior research has attempted to account for the share of funds at stake by distinguishing between PBF 1.0 and 2.0 policies. PBF 1.0, the first wave of policy adoption in the 1990s, was generally characterized by states tying any available bonus funds to performance metrics while PBF 2.0, a second wave of adoptions in the mid-2000s, tied base state appropriations to performance metrics (Dougherty & Natow, 2015). The latter set of policies is typically understood to tie a larger share of funds to performance metrics. Some studies have categorized PBF as 1.0 or 2.0 based on whether the policy was adopted before or after the mid-2000s (e.g., Boland, 2020; Hagood, 2019). But as Figure 1 shows, many states had low-dosage policies in place after this (and, as a result, look more like 1.0 policies), and some states moved from low- to high-dosage policies in recent years, so timing of adoption is a rough indicator of the strength of a particular policy. Other studies define PBF 1.0 and 2.0 by states linking bonus versus base funding to performance, respectively (e.g., Favero & Rutherford, 2020; Gándara & Rutherford, 2020; Serna, 2020). However, Figure 1 shows that many states have low-dosage policies, regardless of whether bonus or base funds are linked to performance. In addition, several states with high-dosage policies, such as Nevada and Maine, included transition years during which a growing share of funds was tied to performance. As a result, simply classifying policies as 1.0 or 2.0 masks important distinctions in the actual share of funds at stake across states.
While Figure 1 shows the extent to which PBF dosage varies across states, PBF dosage also varies across 4-year institutions within a state in a given year due to differences in institutions’ reliance on state funding. This highlights the need to consider institution-level variation in PBF dosage among institutions in PBF-adopting states. For example, in Kentucky, around 5% of the University of Kentucky’s revenue is tied to performance while 27% of revenue at Kentucky State University, a public historically Black institution, is tied to performance. In Ohio, around 5% of revenue at Ohio State University’s main campus is tied to performance while more than 20% of revenue at the University of Akron, Wright State University, and Shawnee State University is tied to performance. To more closely examine the impact of PBF, we created an institution-specific measure of PBF dosage or the share of an institution’s total revenue at stake under PBF in a given year. This is important because an institution’s response to a statewide PBF policy is likely shaped by how reliant the institution is on state funding. In particular, institutions that are more reliant on state funding or receive a larger amount of state appropriations may be more responsive to PBF policies to maintain a critical revenue source. To create an institution-level PBF dosage measure, we multiplied the share of state general funds budgeted based on performance (a statewide PBF dosage measure) by an institution’s state appropriations to calculate the amount of an institution’s revenue allocated through performance funding and then divided this by the institution’s total revenue. To our knowledge, this is the first study to examine the extent to which the share of institutional revenue at stake under PBF, which varies substantially across and within states, shapes enrollment and selectivity.
In addition, states differ in whether they include equity-oriented metrics and the specific populations of students (e.g., racially minoritized, low-income, and/or adult students) they include in these metrics in an effort to incentivize colleges to enroll and/or graduate underserved students. To date, relatively few studies have examined the impact of PBF equity metrics, coming to somewhat different conclusions about their effects on various student populations (Gándara & Rutherford, 2020; Kelchen, 2018a), and just one has considered the specific populations included in equity metrics (Gándara & Rutherford, 2018).
To advance PBF research more broadly, we draw on the most comprehensive and systematic data to date on PBF to examine how specific policy features, including the share of an institution’s revenue at stake and the populations included in equity metrics, shape college access and selectivity. To gather these detailed data, our research team reviewed thousands of state policy documents related to performance funding over a 4-year period. This comprehensive data collection effort included direct correspondence with state higher education agency officials and allowed us to reconcile discrepancies in prior studies regarding the years a particular state had PBF and even whether a state had PBF at all (Rosinger et al., 2022). Table 1 lists states with PBF for the 4-year sector, the years the policy was funded, and key policy features.
PBF Policies for 4-Year Sector by State and Policy Features, 1997–2019
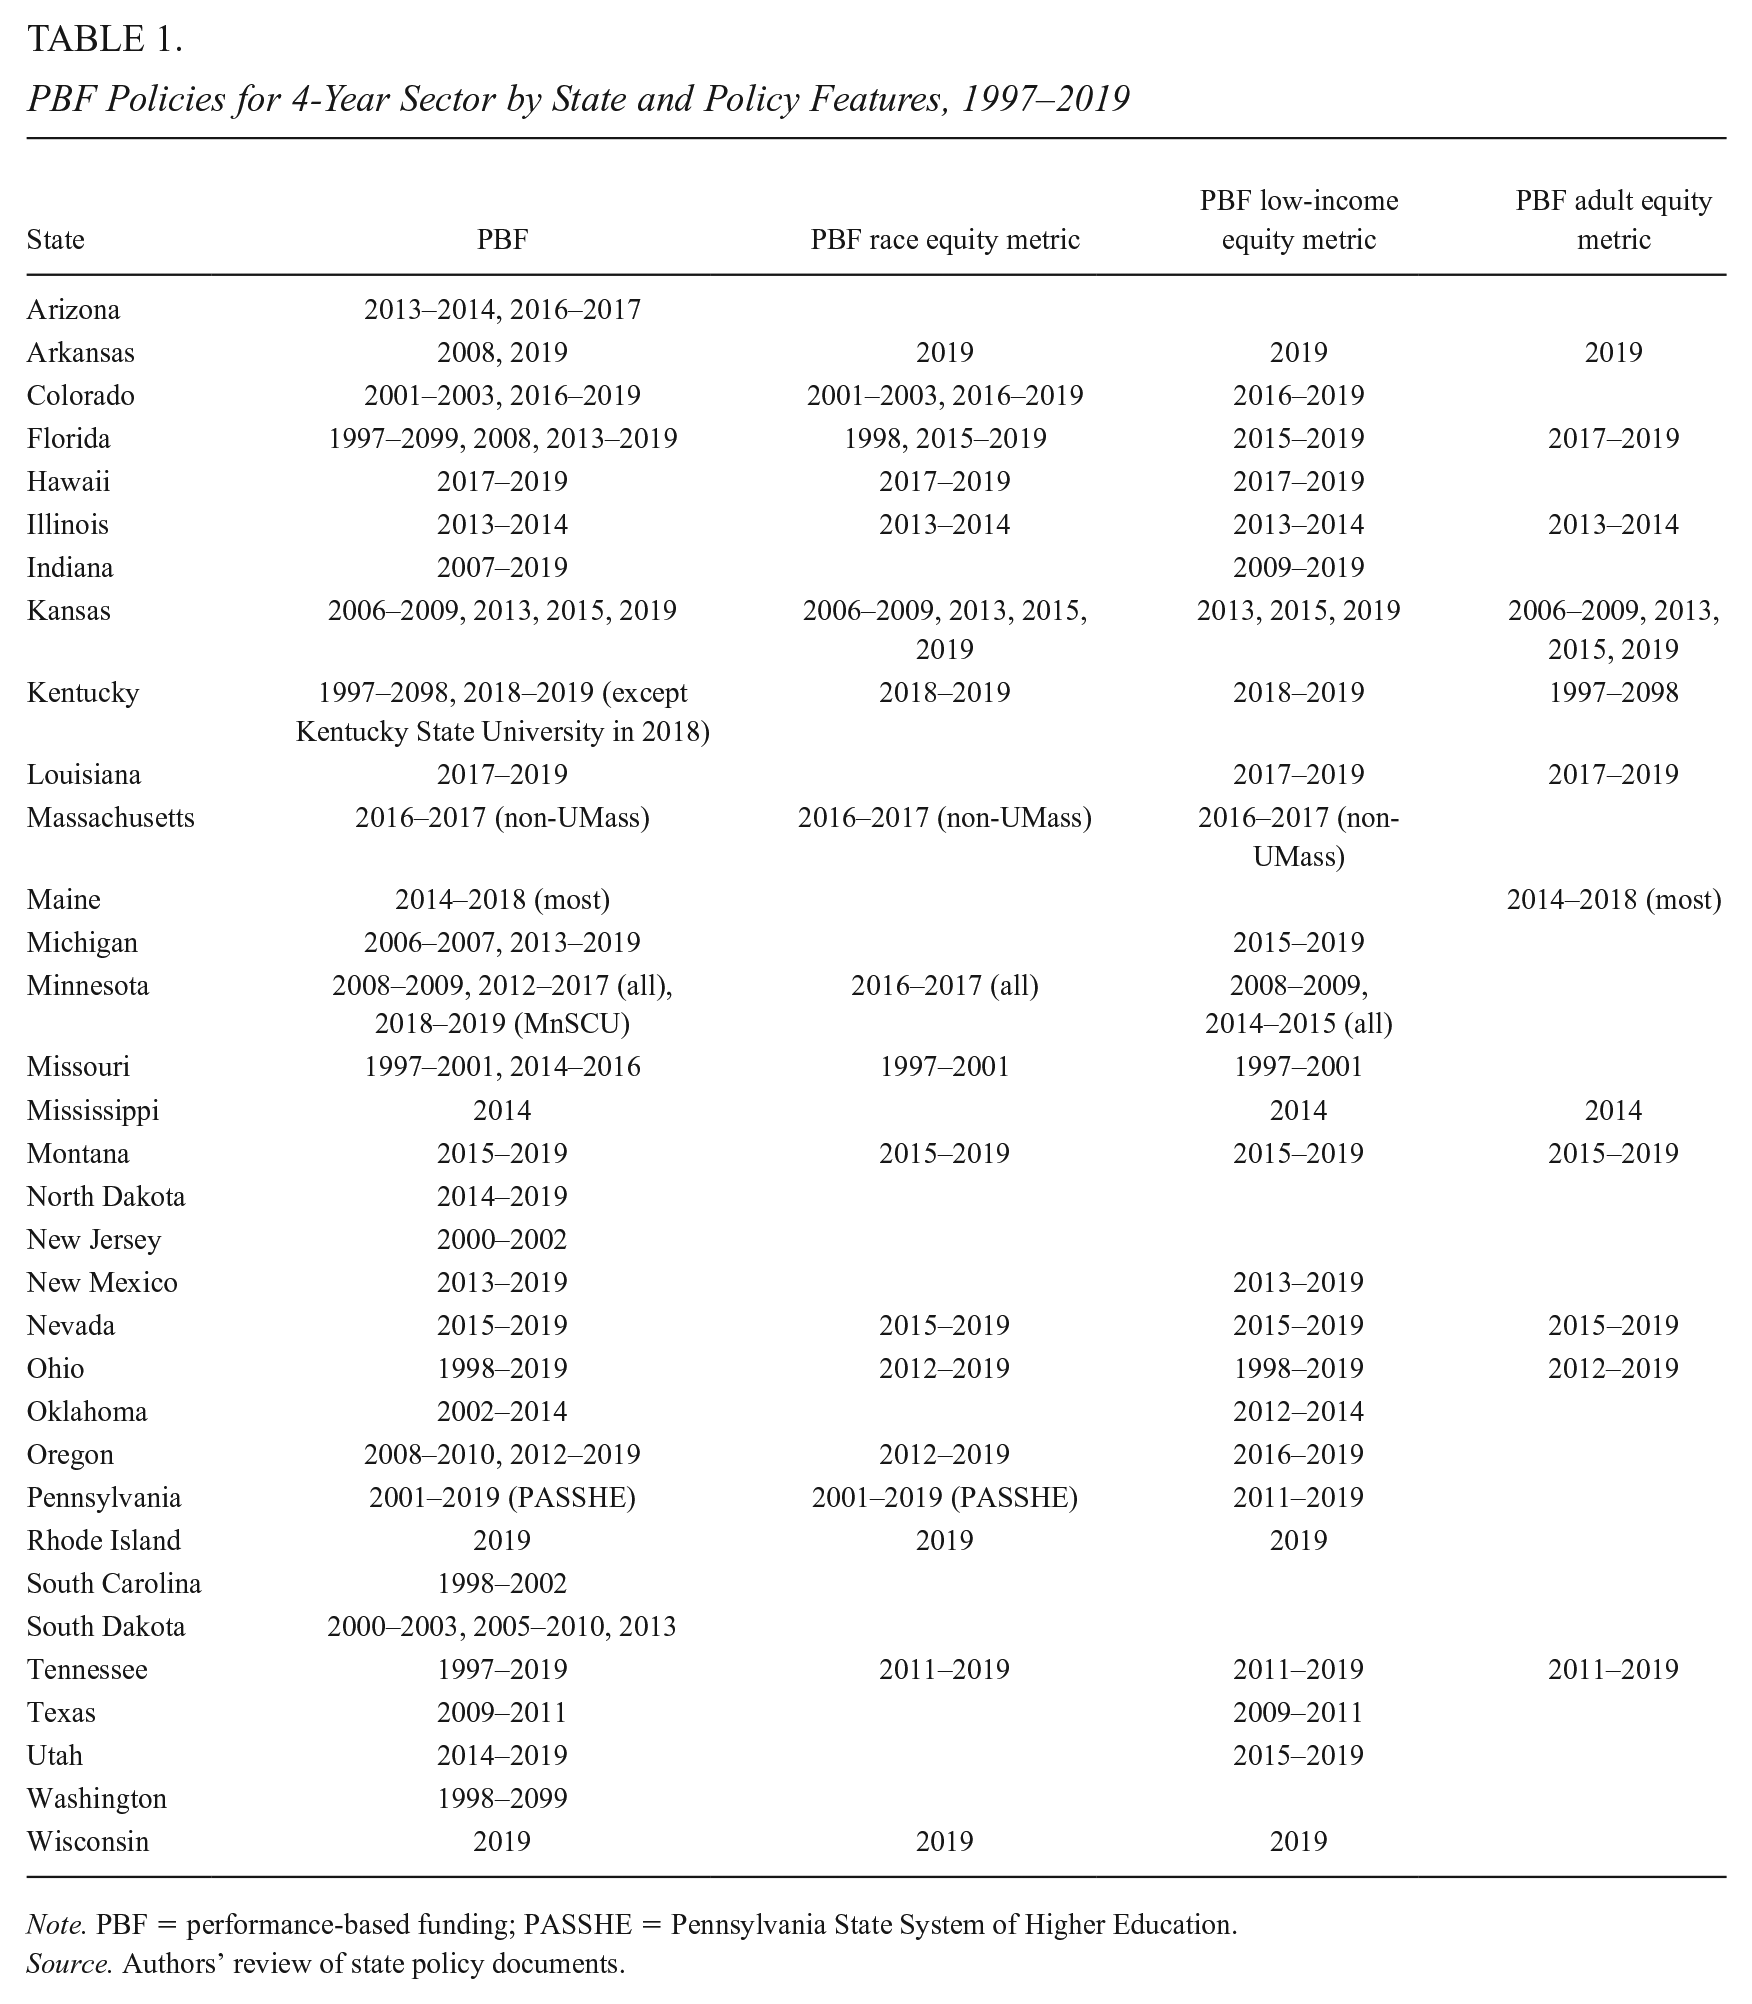
Note. PBF = performance-based funding; PASSHE = Pennsylvania State System of Higher Education.
Source. Authors’ review of state policy documents.
We also draw on recent advances in econometrics to account for biases introduced into two-way fixed effects (TWFE), or generalized difference-in-differences (DiD), approaches when policy adoption timing and treatment effects vary over time. We leverage these new data and methodologies to answer the following questions:
For each research question, we also examine whether results vary by institutional selectivity as more selective versus less selective institutions may respond differently to PBF policies. We find some evidence that as the share of revenue at stake under PBF increased, enrollment among racially minoritized students decreased while 25th percentile SAT scores increased at moderately selective institutions. Ultimately, however, potential biases, different trends in outcomes prior to policy adoption, and wide confidence intervals lead us to conclude few definitive effects of PBF. Findings do consistently show that across institution types, the presence of equity metrics was not enough to boost enrollment among the specific populations they targeted. We discuss the implications of our findings for how state policymakers can design higher education funding policies to promote more equitable college enrollment outcomes, particularly as they make tough decisions about how to allocate funds following the pandemic.
PBF in Higher Education
Previous studies have typically indicated that PBF does not consistently lead to increases in associate or bachelor’s degree completion (Ortagus et al., 2020), but a growing body of evidence has shown that community colleges, in particular, may face incentives to seek shorter term, quicker ways to improve outcomes by increasing certificate production (Hillman et al., 2015; Li & Ortagus, 2019). Ward and Ost (2021) employed DiD and synthetic control approaches, finding PBF adoption had no effect on bachelor’s degree completions or total degree completions in Ohio and Tennessee. Additional studies focused on the community college sector reported that PBF had no effect on associate degree completion in Ohio (Hillman et al., 2018), Washington (Hillman et al., 2015), and Tennessee (Hillman et al., 2018; Li & Ortagus, 2019).
A series of qualitative studies have explored institutional responses to PBF adoption by interviewing practitioners and administrators working on college campuses. This research suggests institutions have responded to PBF by undertaking targeted efforts to improve academic support services (see Ortagus et al., 2020). More specifically, Dougherty et al. (2016) found that institutions subject to PBF implemented efforts to improve tutoring and advising services, whereas Harbour and Nagy (2005) interviewed senior administrators in North Carolina and reported that institutions made targeted adjustments in programs and staffing to improve performance on the metrics incentivized under their PBF system. However, administrators at numerous public colleges and universities have noted that PBF has the potential to limit their capacity to serve individuals who are more expensive to educate, such as academically underprepared students and students from low-income backgrounds (Jones et al., 2017).
In recent years, the PBF literature has shifted from focusing on intended outcomes, such as retention and degree completion, to considering the unintended outcomes of PBF adoption, such as restricting access to more selective institutions (see Ortagus et al., 2020). Prior research on the impact of PBF in the state of Indiana has revealed that public 4-year universities decreased acceptance rates and restricted access for racially minoritized and low-income students following the adoption of PBF (Birdsall, 2018; Umbricht et al., 2017). In a national study, Kelchen and Stedrak (2016) found that PBF was negatively associated with federal Pell Grant revenue, suggesting institutions may be responding to PBF adoption by enrolling fewer low-income students.
Additional national studies have explored the impact of equity metrics in PBF policies, such as financial bonuses for enrolling racially minoritized, low-income, or adult students, as a way to counteract incentives for public 4-year institutions to enroll a larger share of already-advantaged students deemed more likely to graduate (Gándara & Rutherford, 2018; Kelchen, 2018a). This limited body of evidence finds inconsistent results across student populations. Gándara and Rutherford (2018) reported that PBF equity metrics had a positive impact on the share of Latinx and low-income students but a negative impact on the share of Black students relative to PBF without equity metrics. Conversely, Kelchen (2018a) found that equity-oriented PBF metrics had a positive impact on the proportion of Black students but no impact on enrollment among other racially minoritized populations and Pell Grant recipients.
Another recent national study used institution-level data from 2001 to 2014 to explore whether public 4-year institutions increased their selectivity or enrolled fewer underserved students under a PBF policy (Gándara & Rutherford, 2020). The authors reported that public 4-year institutions become more selective when they were subject to PBF, indicating institutions decrease acceptance rates, increase 25th percentile SAT scores, and enroll fewer first-generation students in response to PBF. In addition, the authors explored the role of PBF policy design by considering whether PBF was linked to an institution’s base funding (PBF 2.0) or tied to bonus funds (PBF 1.0), finding that decreases in admission rates and the proportion of low-income or first-generation students are concentrated primarily within 2.0 policies.
The present study extends prior literature by leveraging a novel, comprehensive dataset that captures more nuanced policy design features, including the specific share of institutional revenue at stake under PBF, than have previously been available to researchers. Table 2 lists policy features examined in prior national studies of PBF in the 4-year sector. Six of the 13 studies we identified used a binary variable indicating the presence or absence of PBF in a given year. Studies that have taken a more detailed view of PBF have primarily considered the impacts of PBF 1.0 versus 2.0 policies to understand whether effects vary depending on the amount of funds at stake. To classify programs, researchers have relied on whether bonus versus base funding was linked to performance (e.g., Favero & Rutherford, 2020; Gándara & Rutherford, 2020; Serna, 2020) or whether a policy was adopted before or after the mid-2000s (e.g., Boland, 2020; Hagood, 2019). However, recent research has complicated the 1.0 versus 2.0 distinction and highlighted a need for a more specific consideration of the strength of particular policies (Rosinger et al., 2022).
Policy Features Examined in Prior National Studies of the Impact of PBF in the 4-Year Sector
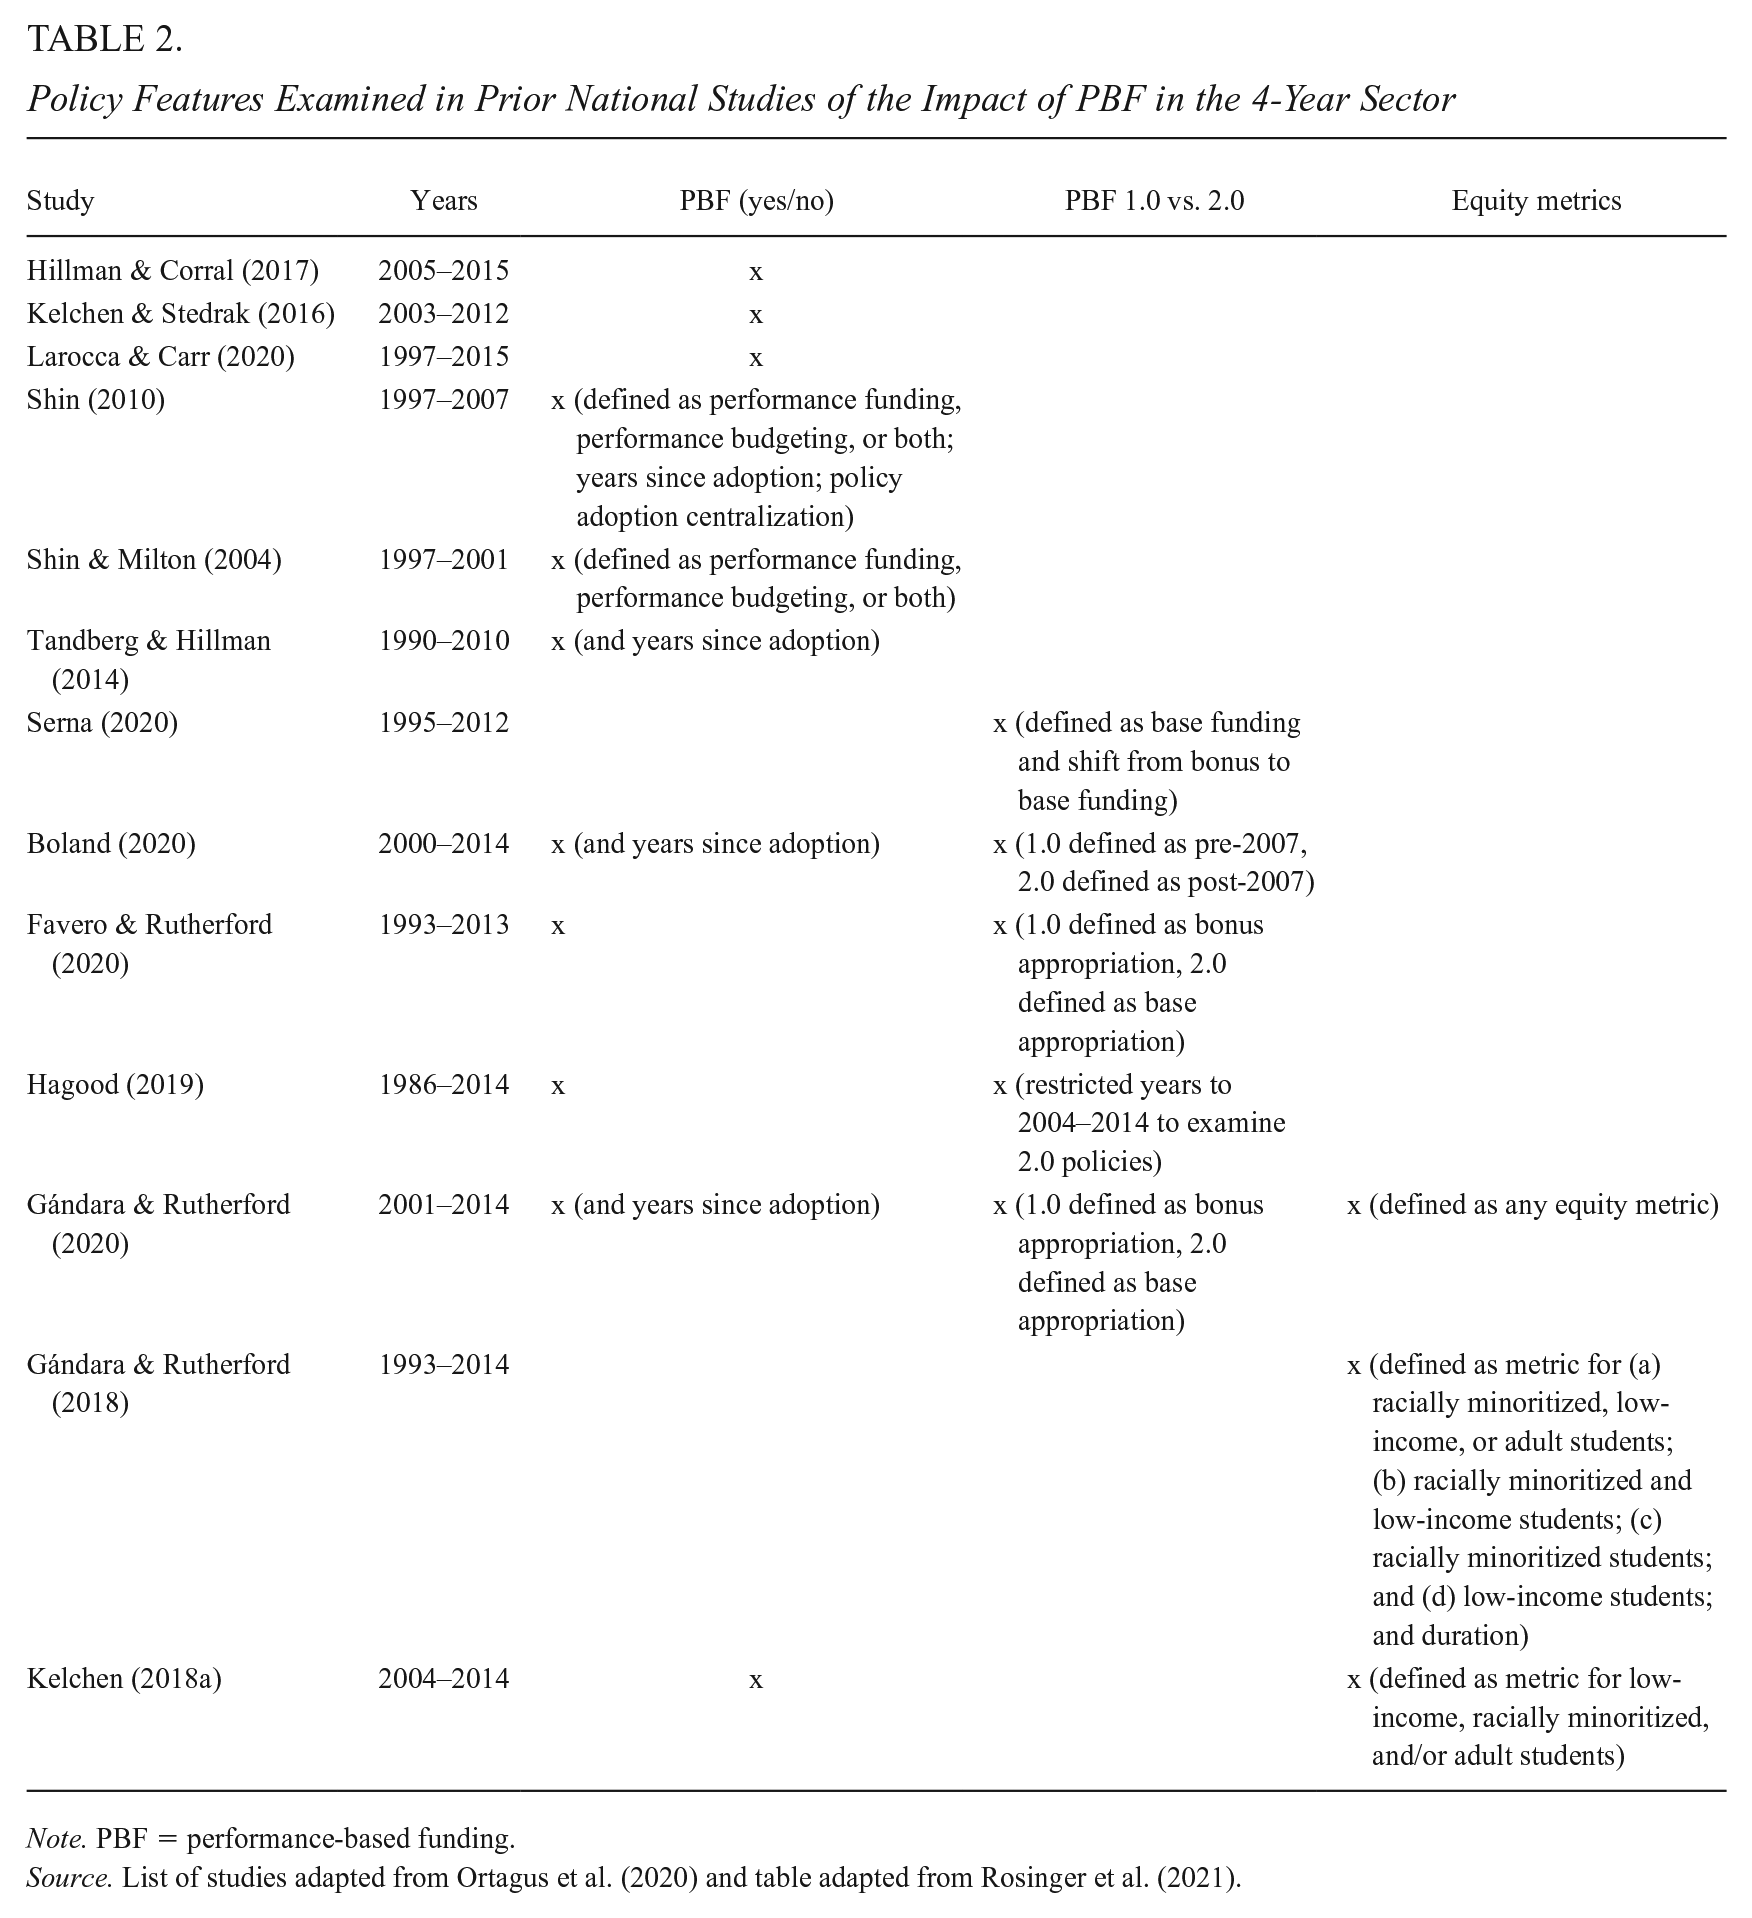
Note. PBF = performance-based funding.
Source. List of studies adapted from Ortagus et al. (2020) and table adapted from Rosinger et al. (2021).
In addition, while we have evidence regarding some relatively high-dosage PBF policies, such as those in Ohio and Tennessee (e.g., Hillman et al., 2018; Ward & Ost, 2021), there are a number of other high-dosage PBF states such as Kentucky, Mississippi, North Dakota, and Oregon that have been studied less frequently, leading to results that could reflect local contexts in these two well-studied states rather than high-dosage PBF policies more specifically. Finally, institutions’ responses to PBF are likely different depending on how reliant they are on state appropriations as a share of their total revenue. In this study, we are able to consider the exact percentage of funds at stake under PBF at an institution in a given year rather than relying on dated conceptualizations of PBF adoption waves or even state-level measures of PBF dosage.
In addition, just one study we identified has considered the impact of equity metrics that focus on specific populations of students (Gándara & Rutherford, 2018); however, the comparison group was institutions subject to PBF without equity metrics, omitting all non-PBF institutions. Furthermore, we are not aware of another study that examines PBF dosage and equity metrics side-by-side. This highlights the need for more evidence regarding how specific policy design features affect enrollment to inform policy.
Our study offers insight for research and policy by drawing on the best data available, considering specific features of PBF policies, and incorporating recent methodological advances that allow for more rigorous examinations of causal inference in the presence of differential treatment timing and treatment effect heterogeneity (Goodman-Bacon, 2021; Sun & Abraham, 2020).
Conceptual Framework
Similar to many prior studies examining accountability policies in higher education (Kelchen, 2018b), we use a combination of principal–agent theory (Jensen & Meckling, 1976; Spence & Zeckhauser, 1971) and resource dependence theory (Pfeffer & Salancik, 1978) as the framework for our analyses. The need for less selective institutions to receive state funding has the potential to give state policymakers the power and ability to shape the behavior of these institutions more than wealthier institutions that may not be as reliant on state funds. In addition, resource dependence theory suggests that institutions with a larger share of their total revenue at stake may be more responsive to PBF than institutions with smaller shares of their total revenue tied to student outcomes.
PBF for higher education is part of a broader policy reform effort to hold public agencies more accountable for their outcomes (Moynihan, 2006). K12 education has seen accountability efforts in the form of No Child Left Behind, which linked federal funding for schools to students’ performance on standardized tests, and other reforms (Heinrich, 2015; Ladd, 2011). However, performance-based reforms can lead to unintended consequences if educational systems improve performance on specific metrics without making overall improvements to the quality of educational offerings (Kelchen, 2018b). Public agencies, for example, have previously responded to performance incentives by restricting service to some groups or focusing services on individuals who are close to performance metric thresholds (Koning & Heinrich, 2013; Lauen & Gaddis, 2016). These responses can exacerbate inequities by limiting access to services to individuals who are more likely to succeed rather than focusing on improving outcomes more broadly.
In the case of PBF, linking a portion of state funding to student outcomes may incentivize colleges to raise admission standards and restrict enrollment among historically underserved students (Hillman, 2016). Raising admissions standards is just one of many possible unintended responses to PBF. For instance, institutions may simplify degree requirements, lower standards for graduation, or emphasize shorter term outcomes such as certificates over degree completion in an effort to improve outcomes (Hillman, 2016; Hillman et al., 2015, 2018; Li & Kennedy, 2018; Li & Ortagus, 2019). Each of these responses allows institutions to try to improve performance on particular metrics without actually improving the quality of services students receive. By raising admissions standards and restricting enrollment, institutions may improve their performance on outcome metrics by enrolling students who are more likely to graduate. However, this response may come at the expense of providing more equitable access to underserved student populations. Increased admissions standards and restricted access may be particularly pronounced at colleges with selective admissions processes that are more able to craft admissions and financial aid decisions to enroll a desired group of students.
Based on our conceptual framework and prior research, we offer the following hypotheses:
Data and Methods
Sample and Data
To examine how PBF policy features affect college access and selectivity, we leveraged the most comprehensive longitudinal dataset to date on the existence and features of PBF policies. We merged these data with publicly available data on our outcomes of interest along with other institutional and state characteristics to create an analytic dataset spanning more than two decades from Fiscal Years 1997 to 2019, a period during which 33 states operated PBF for the 4-year sector. Our sample consisted of public 4-year degree-granting colleges in the United States, defined as doctoral, master’s, and baccalaureate institutions using 2018 Carnegie classifications. We excluded special focus institutions, military institutions, and tribal colleges from our sample. The final sample included 581 public 4-year universities.
Our research team collected data on PBF features from policy documents, including state budgets and legislation, and higher education agency documents relating to PBF over the last two decades. Over 4 years, our research team reviewed more than 2,000 documents, meeting regularly to ensure consistent interpretation and coding of documents across research team members. We used the Internet Archive: Wayback Machine to locate historical versions of websites that contained relevant documents relating to PBF policies in earlier years. We reached out to state higher education agency officials for clarification if we could not locate relevant information or when information about particular aspects of PBF policies was unclear. See Kelchen et al. (2019) for a description of our data collection process.
The final dataset contains information regarding the years states allocated funds for performance, the share of state general funds budgeted based on performance, and whether states included equity metrics for specific populations of students (racially minoritized, low-income, and/or adult students) in a given year for 4-year colleges (Ortagus et al., 2021). In some cases, not all 4-year colleges in a state were subject to PBF. For instance, Pennsylvania’s state-related 4-year universities were not subject to PBF but Pennsylvania State System of Higher Education institutions were. In these cases, we coded only institutions subject to PBF as having particular policy features.
Figure 2 shows a map of states with PBF in 2019 shaded according to state-level PBF dosage (indicating the share of state general funds tied to performance and indicated by dosage quartiles). States in the bottom quartile of PBF dosage (shaded in light gray) allocated between 0.01% and 2.41% of funds based on performance; the second quartile (shaded light-medium gray) allocated between 2.42% and 7.29%; the third quartile (shaded dark-medium gray) allocated between 7.3% and 21.78%; and the top quartile (shaded black) allocated more than 21.79%.
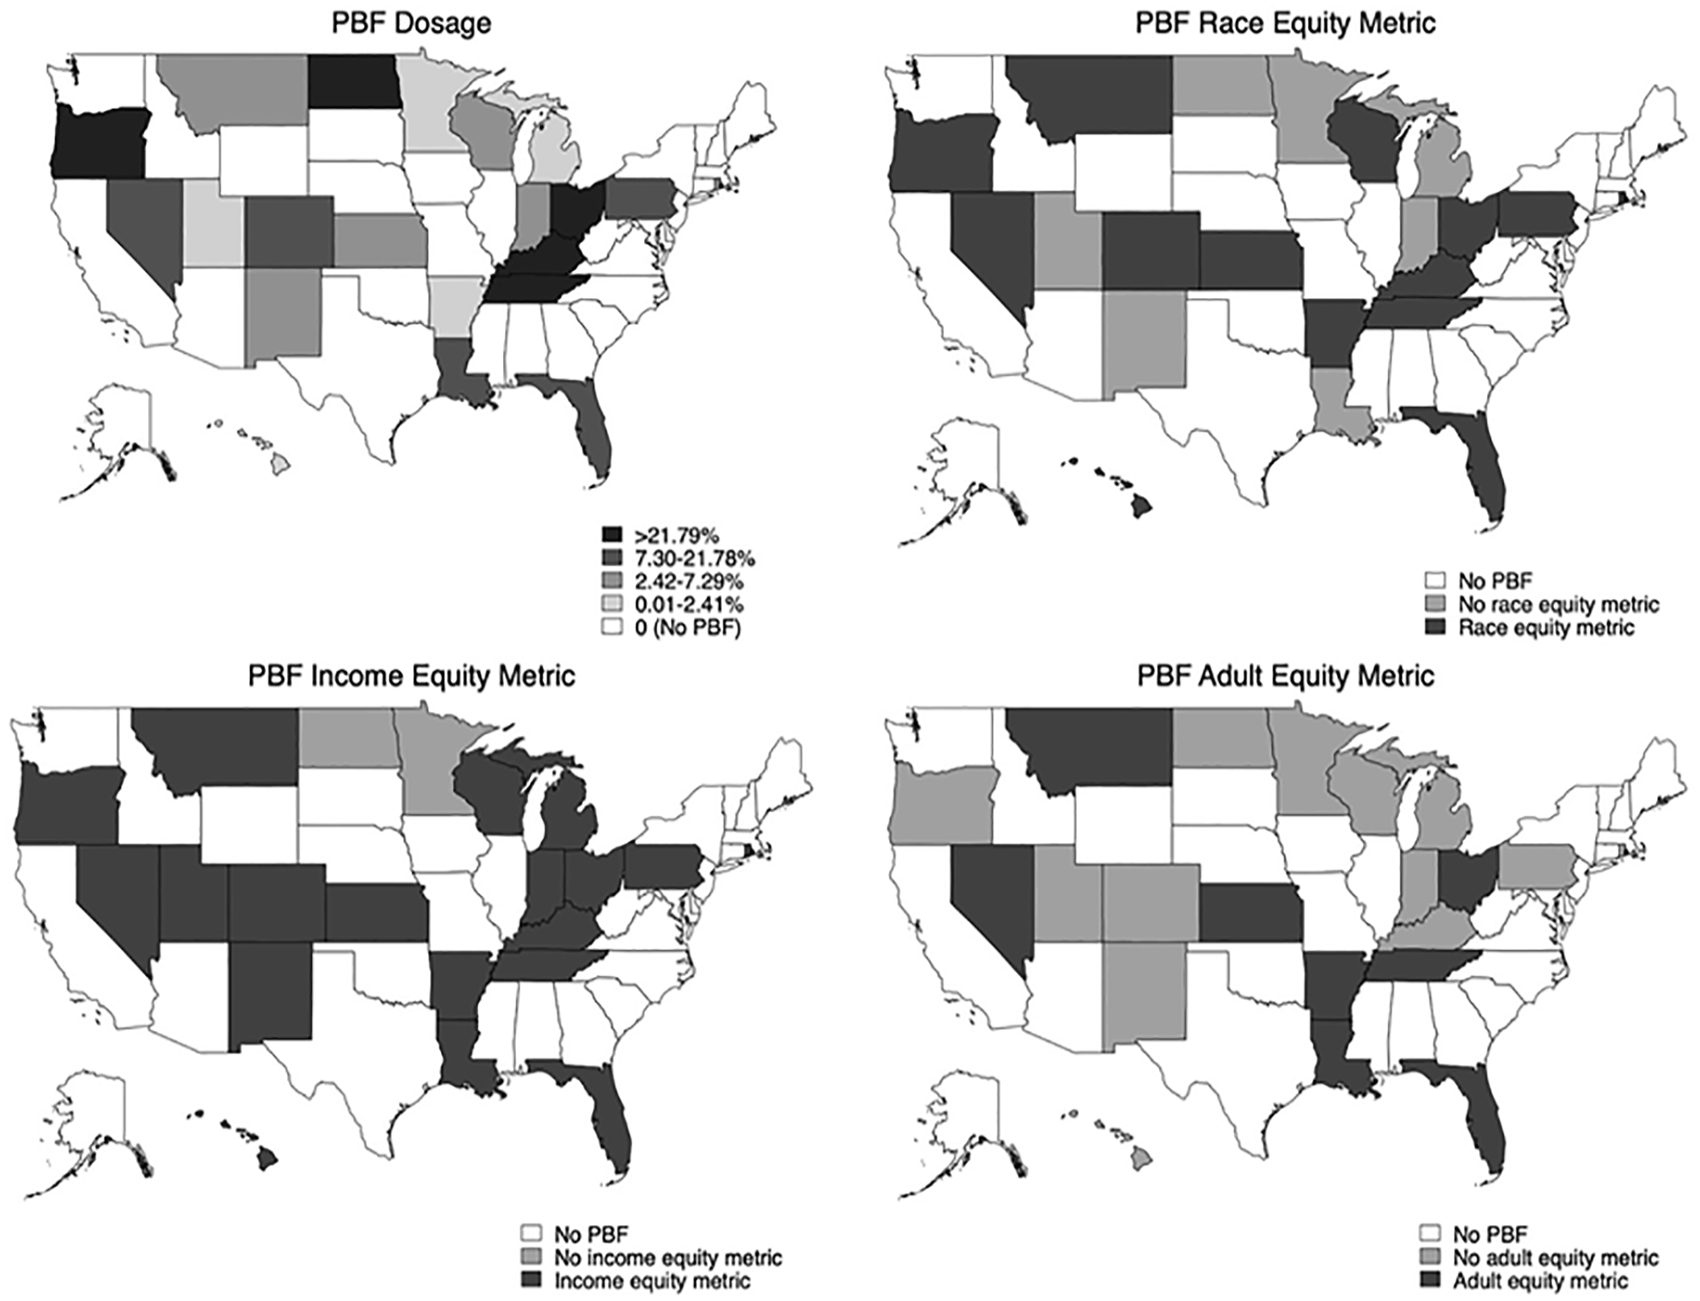
Map of states with PBF policy design features in 2019.
Our dataset contained information regarding the presence of three specific equity-oriented metrics in statewide PBF policies: racially minoritized student metrics, low-income student metrics, and adult student metrics. The maps in Figure 2 show states shaded based on the classification as no PBF (shaded white), PBF without each equity metric (shaded light gray), and PBF with each equity metric (shaded dark gray) in 2019. Of the 21 states with PBF policies in 2019, 14 included a metric for racially minoritized students, 19 included a metric for low-income students, and 8 included a metric for adult students.
Because our unit of analysis is the institution level, and institutional responses to PBF may vary depending on their reliance on state appropriations, we used state-level measures of PBF policy design features to create an institution-level dataset. To answer RQ1 and RQ2, which consider how the share of funds at stake shape college enrollment and selectivity, we created a treatment variable that was a continuous variable indicating the share of an institution’s revenue tied to performance, or institution-level PBF “dosage,” in a given year. To do this, we multiplied the share of state general funds budgeted based on performance (state-level PBF dosage) by the amount of state appropriations for each institution in a given year and then divided by the institution’s total revenue in that year.
To answer RQ3 regarding the extent to which equity metrics affect enrollment among the populations they target, our treatment variables were categorical variables indicating whether a college was in a state that did not adopt PBF (no PBF), whether a college was in a state that had PBF but did not include the specific equity-oriented metric (PBF without equity metric), or whether a college was in a state that had PBF that included the specific equity-oriented metric (PBF with equity metric). We used this categorical variable to examine the impact of equity metrics on the specific populations they target. For example, we examined the impact of low-income student metrics on low-income student enrollment.
Figure 3 shows trends in the institution-level PBF policy features we examine from 1997 to 2019. Until 2009, the average PBF policy tied less than 1% of institutional revenue to performance. Beginning in 2009, average institution-level PBF dosage began to increase, ranging from 1.1% to 6.7% over the last decade. While some institutions were located in states that included equity metrics in their early PBF policies, these metrics are mainly a feature of more recent policies, with fairly steady growth in the number of institutions in states with equity metrics for each student population, corresponding to around when average institution-level PBF dosage began to increase. In 2019, low-income student metrics were the most, racially minoritized student metrics were the second most, and adult student metrics were the least common of the three metrics we considered.
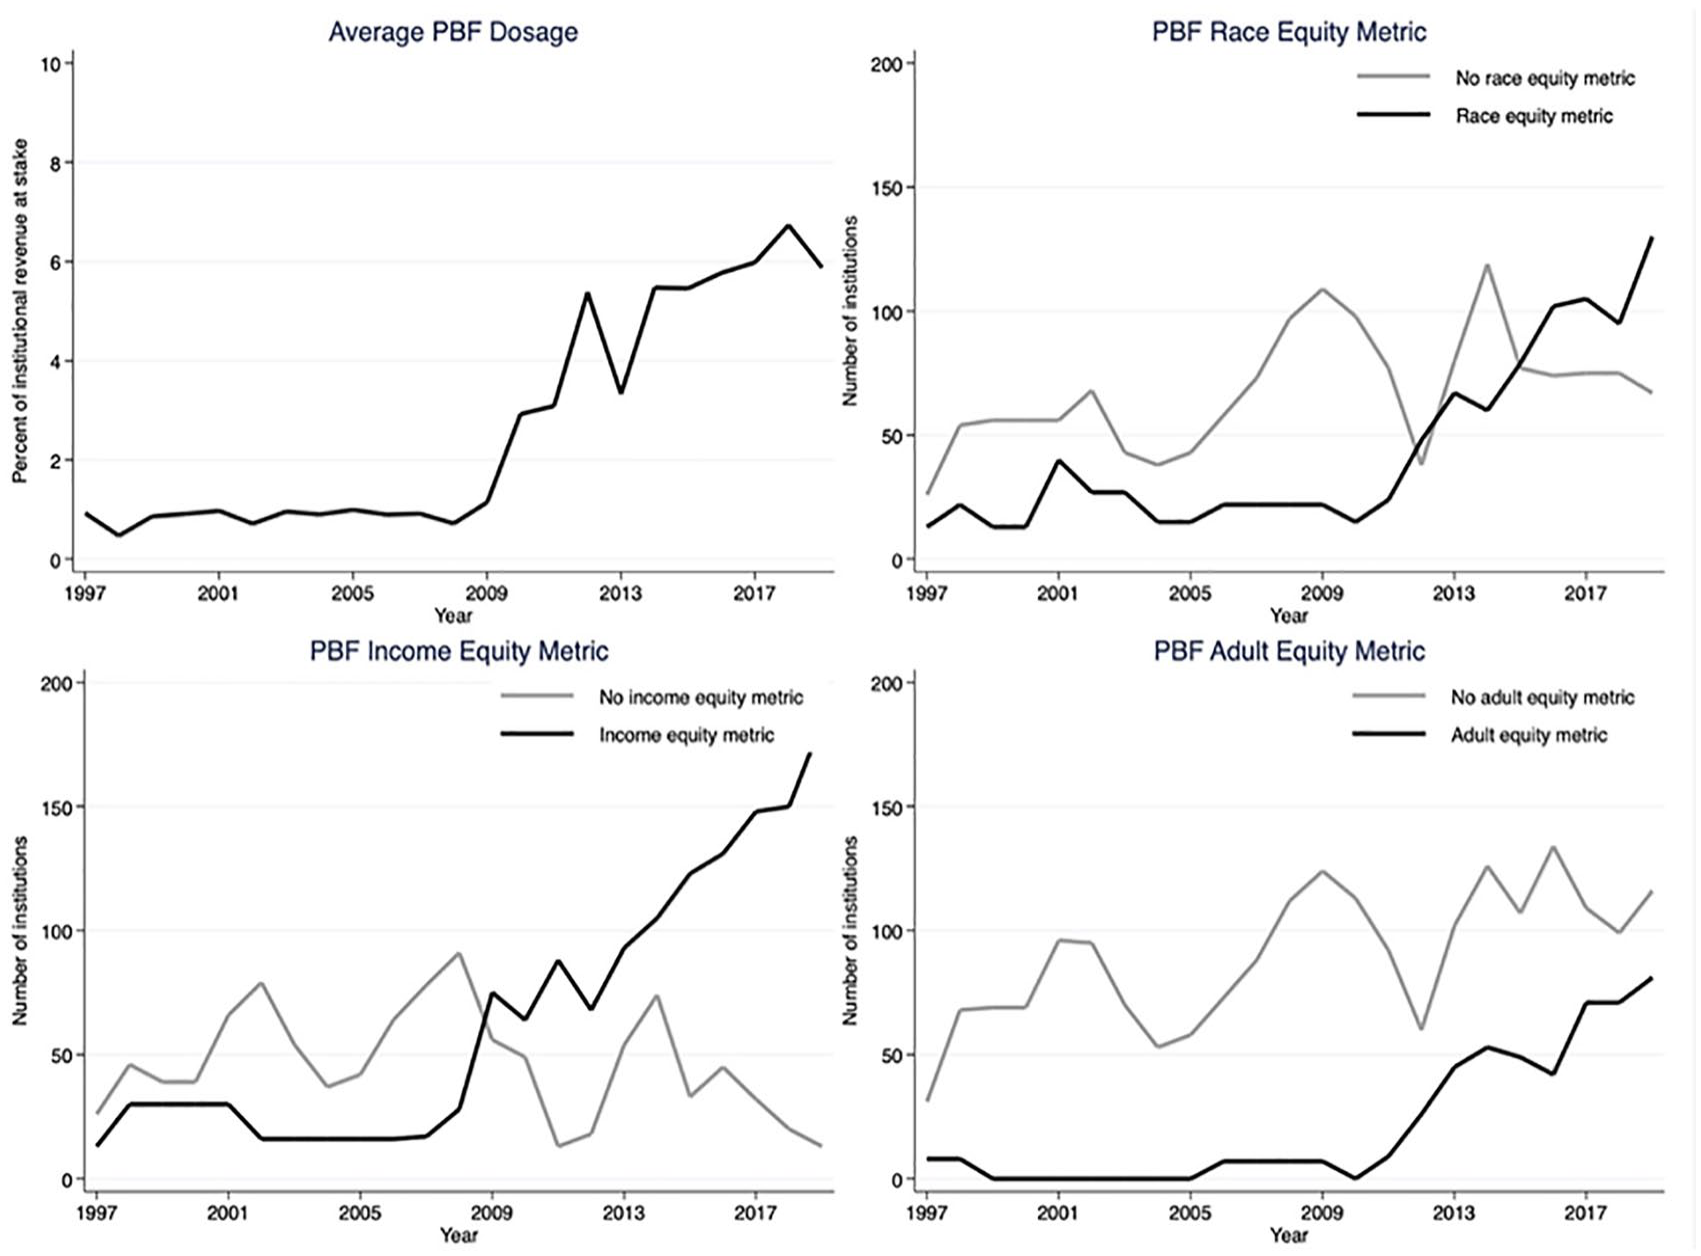
PBF policy design features, 1997–2019.
We merged PBF data with publicly available data on college access and selectivity outcomes from the Integrated Postsecondary Education Data System (IPEDS) and the College Scorecard. To examine the impact of PBF policy design features on college access, our outcomes included enrollment among four historically underserved subpopulations of students: the number of first-time, first-year degree-seeking underrepresented minoritized students (defined as Black, Latinx, and Indigenous) (logged; source: IPEDS); the number of full-time, first-time degree-seeking federal grant aid recipients (logged; source: IPEDS); number of adult students aged 25 or older (logged; source: IPEDS) 1 ; and the percent of first-generation college students (source: College Scorecard). Our selectivity outcomes were 25th and 75th percentile SAT scores and acceptance rate (source: IPEDS). We converted ACT scores to their SAT equivalent using concordance tables (College Board, 2009; College Board and ACT, 2018). We then converted older SAT scores to new SAT equivalents using the appropriate concordance table (College Board, 2016). We lagged outcomes by 1 year to match enrollment and selectivity for a given year with PBF policy features from the prior year (e.g., policies put into effect to fund institutions in Fiscal Year 2002, covering July 2001 to June 2002, were matched to enrollment the following 2002–2003 academic year).
Data for each outcome were not always available for the entire panel: analyses for federal grant aid recipients include 1999 to 2018, analyses for first-generation college students include 1997 to 2016, and analyses for selectivity outcomes include 2001 to 2019. Analyses for underrepresented minoritized student enrollment and adult student enrollment include the entire panel from 1997 to 2019.
To answer the second part of each research question, we estimated models with each treatment variable (continuous variable indicating institution-level PBF dosage; categorical variables indicating no PBF, PBF without a specific equity metric, or PBF with a specific equity metric) by institutional selectivity to examine whether the impacts of PBF policy features vary across institution types. We used Barron’s (2017) competitiveness classifications to code colleges as highly selective, moderately selective, or less selective and open access. 2 Highly selective colleges had a 75th percentile SAT score around 1,400 and an acceptance rate around 50% on average; moderately selective colleges had a 75th percentile SAT score around 1,200 and an acceptance rate around 70% on average; and less selective and open access colleges had a 75th percentile SAT score around 1,100 and an acceptance rate around 70% on average. In using one year of Barron’s classifications to code selectivity level for the duration of the panel, we assumed institutions did not switch broad competitiveness categories over time. Between 2001 and 2017, approximately two thirds of colleges stayed in the same Barron’s category, with most of the other colleges becoming slightly more selective over time (authors’ calculations using Barron’s data).
We controlled for a number of college characteristics that are likely to relate to enrollment and selectivity outcomes. These variables include full-time equivalent (FTE) undergraduate enrollment (logged), percent of students for whom racial identity information is unknown, percent part-time enrollment, in-state tuition and fees (logged), per-FTE instructional expenditures (logged), and per-FTE state appropriations (logged). 3 We also controlled for several demographic and economic features of states that could shape outcomes using data from the Bureau of Labor Statistics and the U.S. Census Bureau. These covariates include per-capita income (logged), unemployment rate, percent of adults with a bachelor’s degree or higher, size of the state’s college-aged population (logged), and share of college-aged population by race. We adjusted financial figures to 2018 dollars using the Consumer Price Index.
Table 3 shows descriptive statistics with separate columns for each treatment status: no PBF, PBF (any dosage), PBF without a race equity metric, PBF with a race equity metric, PBF without a low-income equity metric, PBF with a low-income equity metric, PBF without an adult equity metric, and PBF with an adult equity metric. Enrollment among federal grant recipient, adult, and first-generation students was slightly higher, on average, at institutions in states that would eventually adopt PBF than at institutions in states that never adopted PBF (average total enrollment was also larger at institutions in PBF-adopting states). The average number of racially minoritized students was lower at institutions in PBF-adopting states; state-level covariates indicate the college-aged population as well as the share of Black and Latinx college-aged adults were lower in PBF-adopting states, perhaps contributing to lower numbers of racially minoritized students at the average institution in those states. Tuition was slightly higher and state appropriations per student were lower at institutions in PBF-adopting states, but instructional spending per student was similar at institutions in adopting and nonadopting states. Average 25th and 75th percentile SAT scores were similar (around 1,000 and 1,200, respectively), but acceptance rates were slightly higher at institutions in PBF-adopting states (perhaps reflective of larger average enrollment). There did not seem to be a clear pattern between the number of racially minoritized, federal grant recipient, and adult students and whether a state eventually adopted an equity metric focused on that particular population: sometimes enrollments were higher (e.g., low-income students) and sometimes lower (e.g., racially minoritized students) at institutions in states where the equity metric was eventually introduced.
Descriptive Statistics by PBF Policy Features
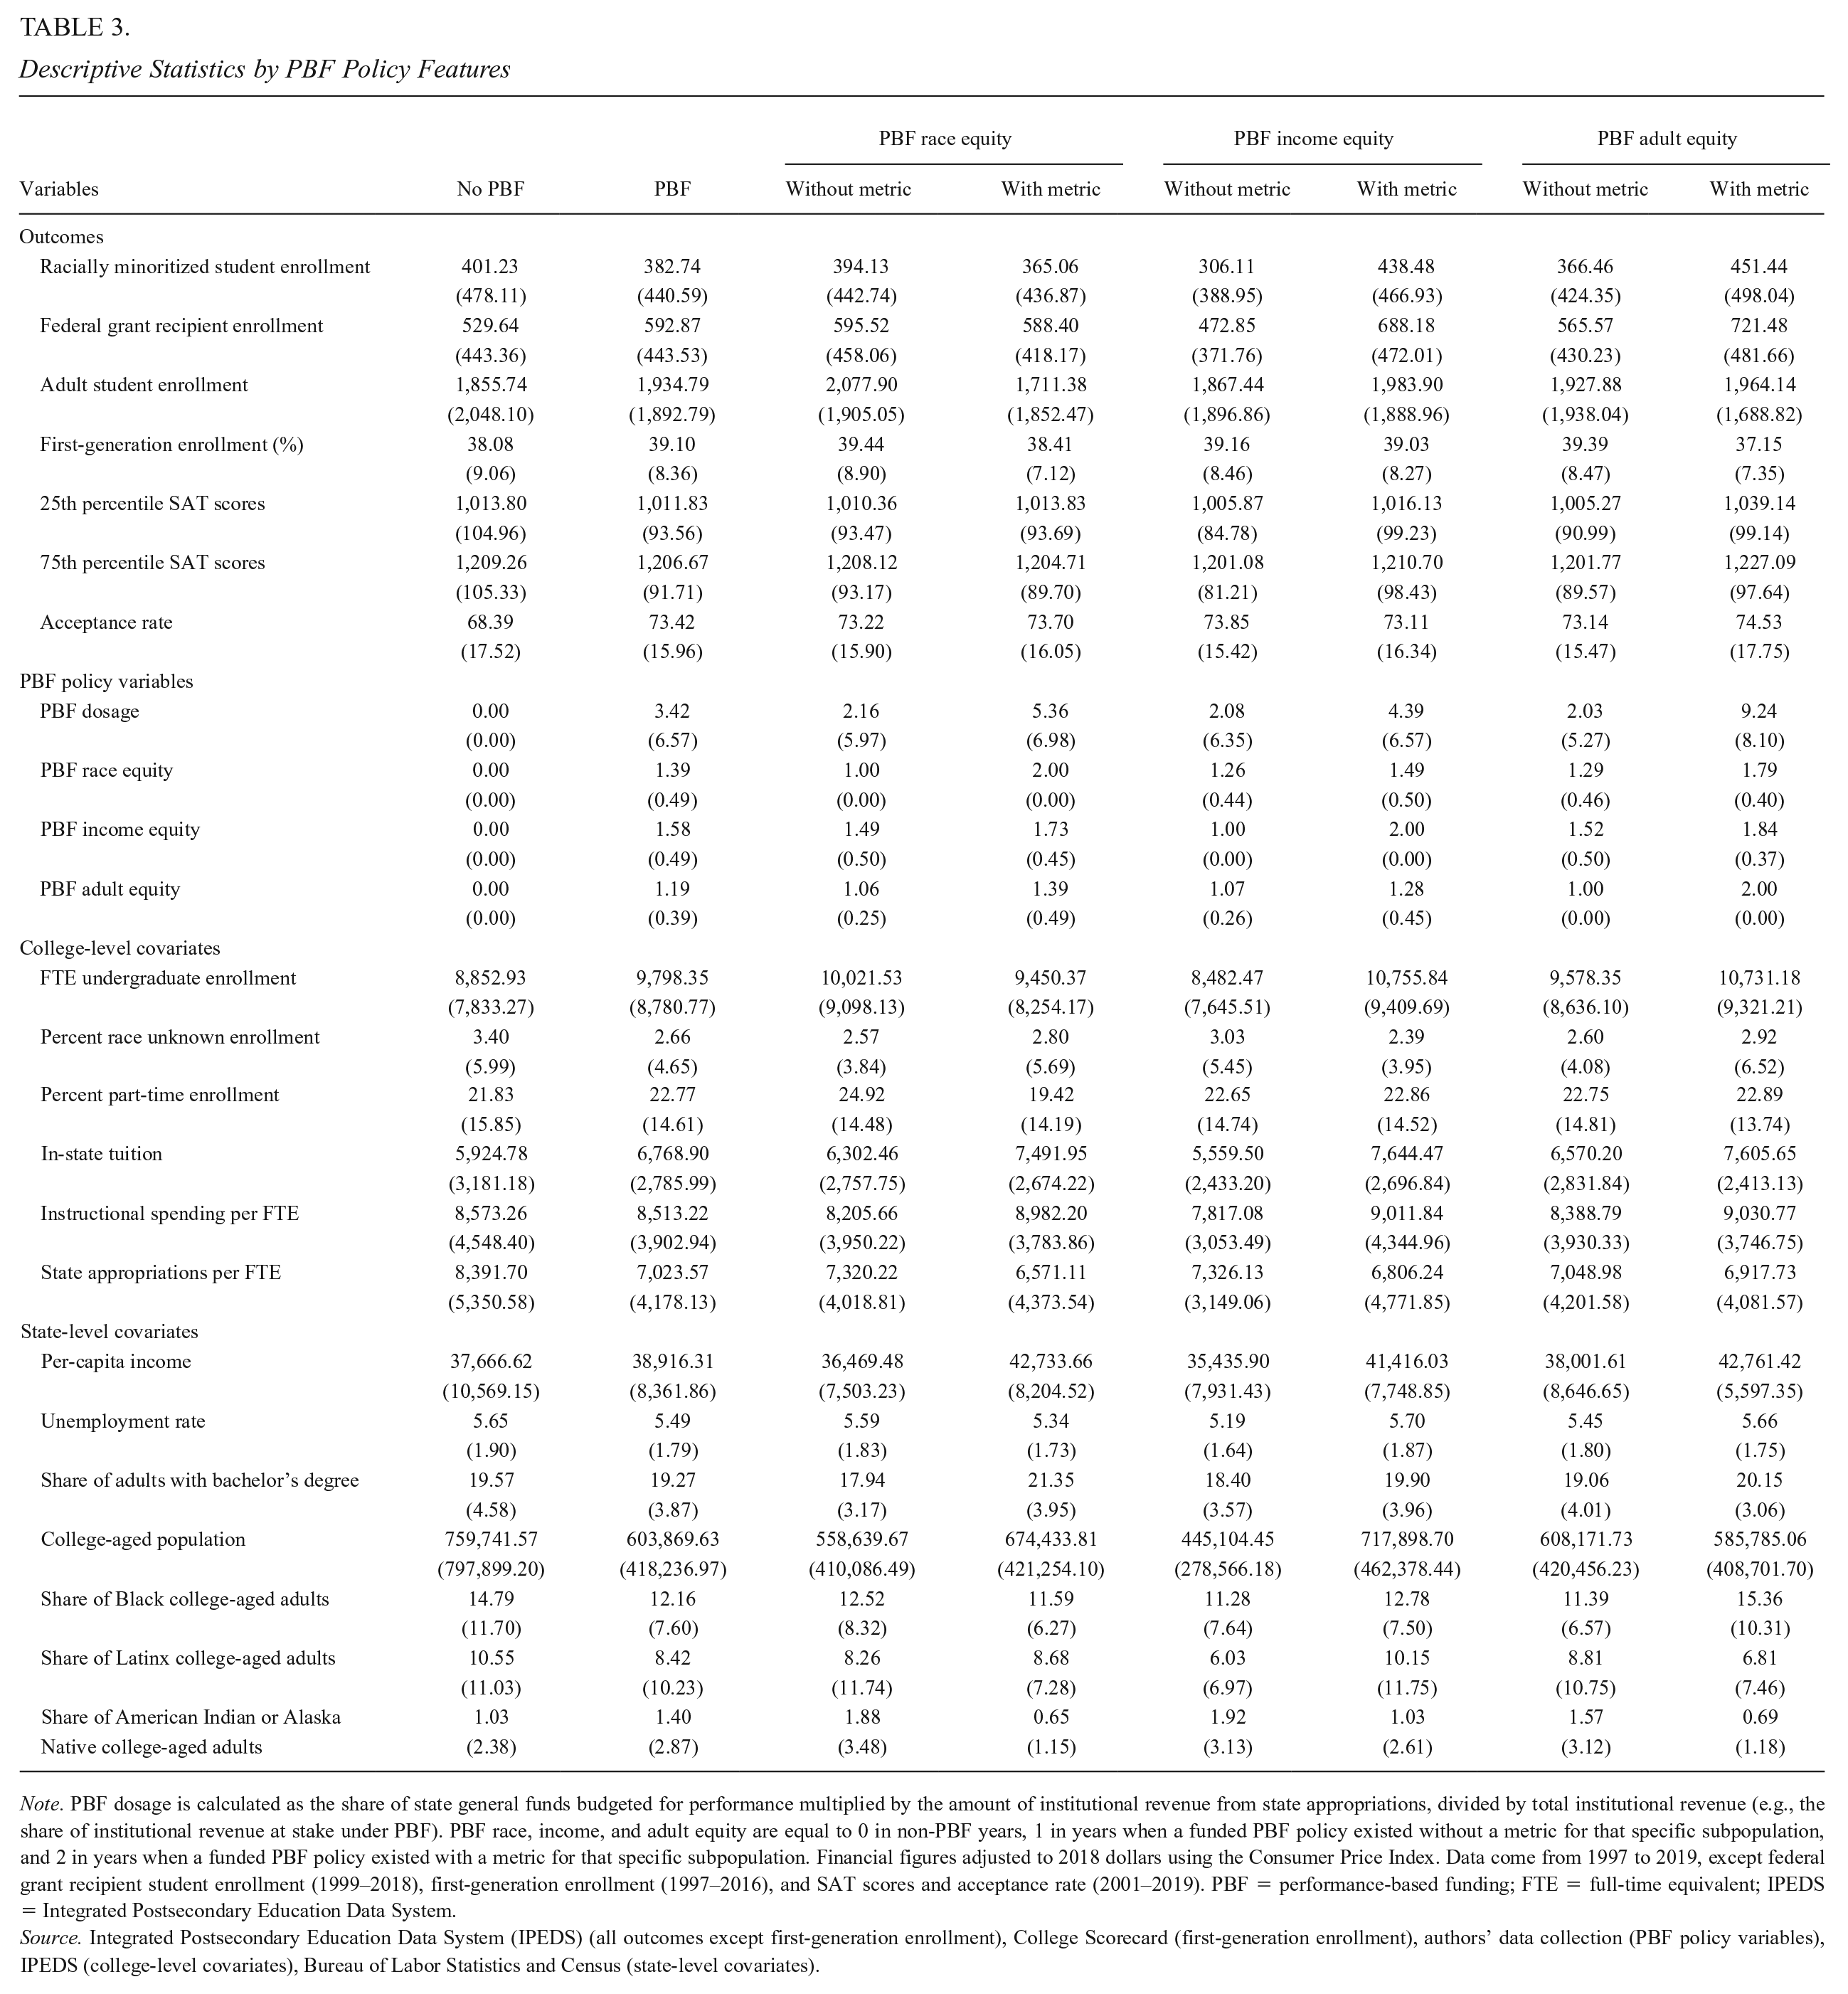
Note. PBF dosage is calculated as the share of state general funds budgeted for performance multiplied by the amount of institutional revenue from state appropriations, divided by total institutional revenue (e.g., the share of institutional revenue at stake under PBF). PBF race, income, and adult equity are equal to 0 in non-PBF years, 1 in years when a funded PBF policy existed without a metric for that specific subpopulation, and 2 in years when a funded PBF policy existed with a metric for that specific subpopulation. Financial figures adjusted to 2018 dollars using the Consumer Price Index. Data come from 1997 to 2019, except federal grant recipient student enrollment (1999–2018), first-generation enrollment (1997–2016), and SAT scores and acceptance rate (2001–2019). PBF = performance-based funding; FTE = full-time equivalent; IPEDS = Integrated Postsecondary Education Data System.
Source. Integrated Postsecondary Education Data System (IPEDS) (all outcomes except first-generation enrollment), College Scorecard (first-generation enrollment), authors’ data collection (PBF policy variables), IPEDS (college-level covariates), Bureau of Labor Statistics and Census (state-level covariates).
Analytic Method
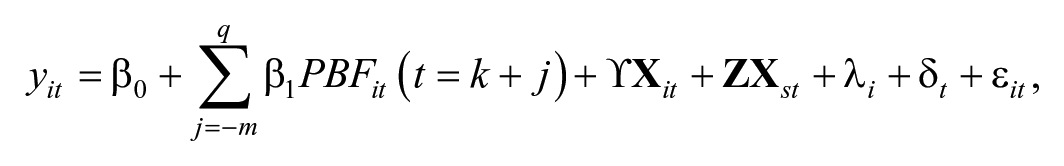
As institutions are located in states that enact and revise PBF policies at different times, we used a TWFE approach to estimate the impact of variations in PBF policy features on college access and selectivity. TWFE is an extension of the 2 × 2 DiD design with two groups (treated and untreated) and two time periods (before and after treatment) that allows treatment timing to vary (Dague & Lahey, 2018) and that can be used when treatment is categorical or continuous. The TWFE model can be expressed as follows:

where yit is the outcome for institution i in time t; PBFit is the PBF policy variable in a given year (e.g., continuous institution-level PBF dosage; categorical variables indicating no PBF, PBF without a specific equity metric, or PBF with a specific equity metric); and β1 is the estimated impact of a particular PBF policy type on the outcome;
We then incorporated recent advances in the econometrics literature to attempt to account for potential bias in the TWFE approach (Goodman-Bacon, 2021; Sun & Abraham, 2020). When treatment timing varies across states, TWFE estimates come from a series of 2 × 2 comparisons between early adopters and never adopters, late adopters and never adopters, early adopters and late adopters prior to the late group actually adopting the policy, and late adopters and early adopters after the late group adopts the policy (S. Cunningham, 2020; Goodman-Bacon, 2021). These comparisons complicate the traditional common trends assumption required for causal inference in DiD designs. First, in the TWFE model, the common trends assumption needs to hold for each 2 × 2 comparison. Second, the final group of 2 × 2s that compare late adopters with states that have already adopted PBF can yield biased estimates in the presence of treatment effect heterogeneity. An additional concern with TWFE estimates is that ordinary least squares (OLS) attach a different weight to each 2 × 2 estimate, which leads to observations in the middle of the panel being weighted more heavily in TWFE estimates than other observations (see S. Cunningham, 2020, and Goodman-Bacon, 2019, for helpful overviews of these issues).
Gardner (2021) proposes a two-stage DiD approach that produces robust estimates in the presence of treatment effect heterogeneity and differential timing and that can be used with continuous and categorical policy variables. The first-stage estimator regresses the outcome on college and year fixed effects (and time-varying covariates) for non-PBF observations (institutions in states that never adopt PBF and institutions in states that eventually adopt PBF). The second-stage estimator regresses the residualized outcome (what is not explained by the first-stage estimator) on the policy variable. Rather than biasing estimates, heterogeneous treatment effects are captured by unit and year fixed effects (Gardner, 2021). We used the did2s package in Stata (Butts & Gardner, 2022) to estimate the Gardner approach as a robustness check to our main TWFE estimates. Results are generally similar in direction and significance across the two approaches, and Gardner estimates are presented in the online supplementary materials (see Supplementary Table A2 for PBF dosage and Supplementary Table A3 for PBF equity metrics in the online version of the journal). For some outcomes (25th and 75th percentile SAT scores, in particular), the Gardner approach produces estimates and standard errors that are much larger than TWFE models; as a result, we focus on TWFE results and note where Gardner and TWFE results are consistent in sign and significance.
To address concerns that differential treatment timing and treatment effect heterogeneity can bias TWFE estimates, we also implemented the Sun and Abraham (2020) event study approach using the eventstudyinteract command in Stata. We used the event_plot command to plot estimates and 95% confidence intervals from these analyses (Borusyak, 2021). The approach currently supports only binary treatments, so we used a binary variable indicating whether a college was subject to PBF in a given year to estimate event study models. The estimating equation for the event studies is the same as the TWFE equation with binary indicators for each year prior to and following PBF adoption replacing the PBF variable in the main model (with the year prior to PBF adoption serving as the referent year). The equation can be expressed as follows:
where j indicates the timing relative to PBF adoption (which occurs at time k), –m indicates the number of leads to treatment, q indicates the number of lags to treatment, and PBFit(t = k + j) are a series of indicator variables for each time period relative to treatment (e.g., 2 years prior, 1 year post), with the year prior to policy adoption serving as the reference group (Furquim et al., 2020).
Across event study results, we looked for consistency in trends in postpolicy years to see how closely they aligned with TWFE estimates. As an additional check, we restricted the sample to exclude all institutions that adopted PBF prior to the start of the analytic period (1997) and any institutions that abandoned PBF prior to the end of the analytic period (2019). This additional check yielded similar overall results.
Limitations
Before presenting results, we first note several limitations associated with data on students’ racial, economic, and parents’ educational backgrounds. IPEDS follows federal race data reporting standards, which includes nine race/ethnicity categories. These broad groupings obscure differences in students’ experiences and outcomes within and across racial-ethnic categories (Teranishi et al., 2020) and make it difficult for researchers to identify who is “underrepresented” in higher education. Our study focuses on students identified as Black, Latinx, and Indigenous; however, we acknowledge that the way race and ethnicity data are reported may not reflect students’ identities and that our conceptualization is an imperfect measure of racially minoritized students (see Gándara & Li, 2020, for additional discussion of these limitations). In addition, the share of students for whom race is unknown varies by institutional type with larger shares of “race unknown” enrollment at more selective colleges, which may affect the composition of other racial-ethnic groups (Ford et al., 2020). We adjusted for the percent of students categorized as “race unknown,” but this potential source of measurement error is an important limitation.
Enrollment among federal grant recipient students is also an imperfect measure of low-income background. While the majority of federal grant recipients are Pell Grant recipients, which is the largest federal grant program for students, this count also includes recipients of smaller federal education assistance programs and training funds. Receipt of the federal Pell Grant, which focuses on lower income students, is also not a perfect indicator for low-income status. Many low-income students do not receive the Pell Grant, commonly reporting that they did not apply for aid because they thought they were not eligible, did not want to take on debt, or did not know how to apply (Rosinger & Ford, 2019). However, this is the best measure in publicly available data regarding the enrollment of low-income students over time.
Finally, how colleges and the federal government define first-generation college students (e.g., neither parent attended college, neither parent completed a college degree) alters who is included in the group and the results of empirical analyses (Toutkoushian et al., 2018, 2021). These data limitations may introduce measurement error into our estimates and also may serve to marginalize underserved students if their identities are not reflected in data collection processes. Despite these data limitations, the definitions that we use in this analysis generally align with how states often constitute underserved populations of students in their PBF policies.
Results
We begin by presenting results from TWFE analyses for each research question and noting where results align with or differ from estimates using the Gardner (2021) two-stage DiD approach. We then present event study results using the Sun and Abraham (2020) approach.
TWFE Results
Table 4 presents TWFE results for our first two research questions regarding the impact of PBF dosage, or the share of an institution’s revenue tied to performance, on college access and selectivity. Results in the first column for each outcome come from a model that includes only treatment and college and year fixed effects, and results in the second column for each outcome come from a model that also adjusts for time-varying college- and state-level covariates. Panel A presents results for the full analytic sample and Panels B through D present results for highly selective, moderately selective, and less selective and open access colleges, respectively.
Two-Way Fixed Effects Results for PBF Dosage
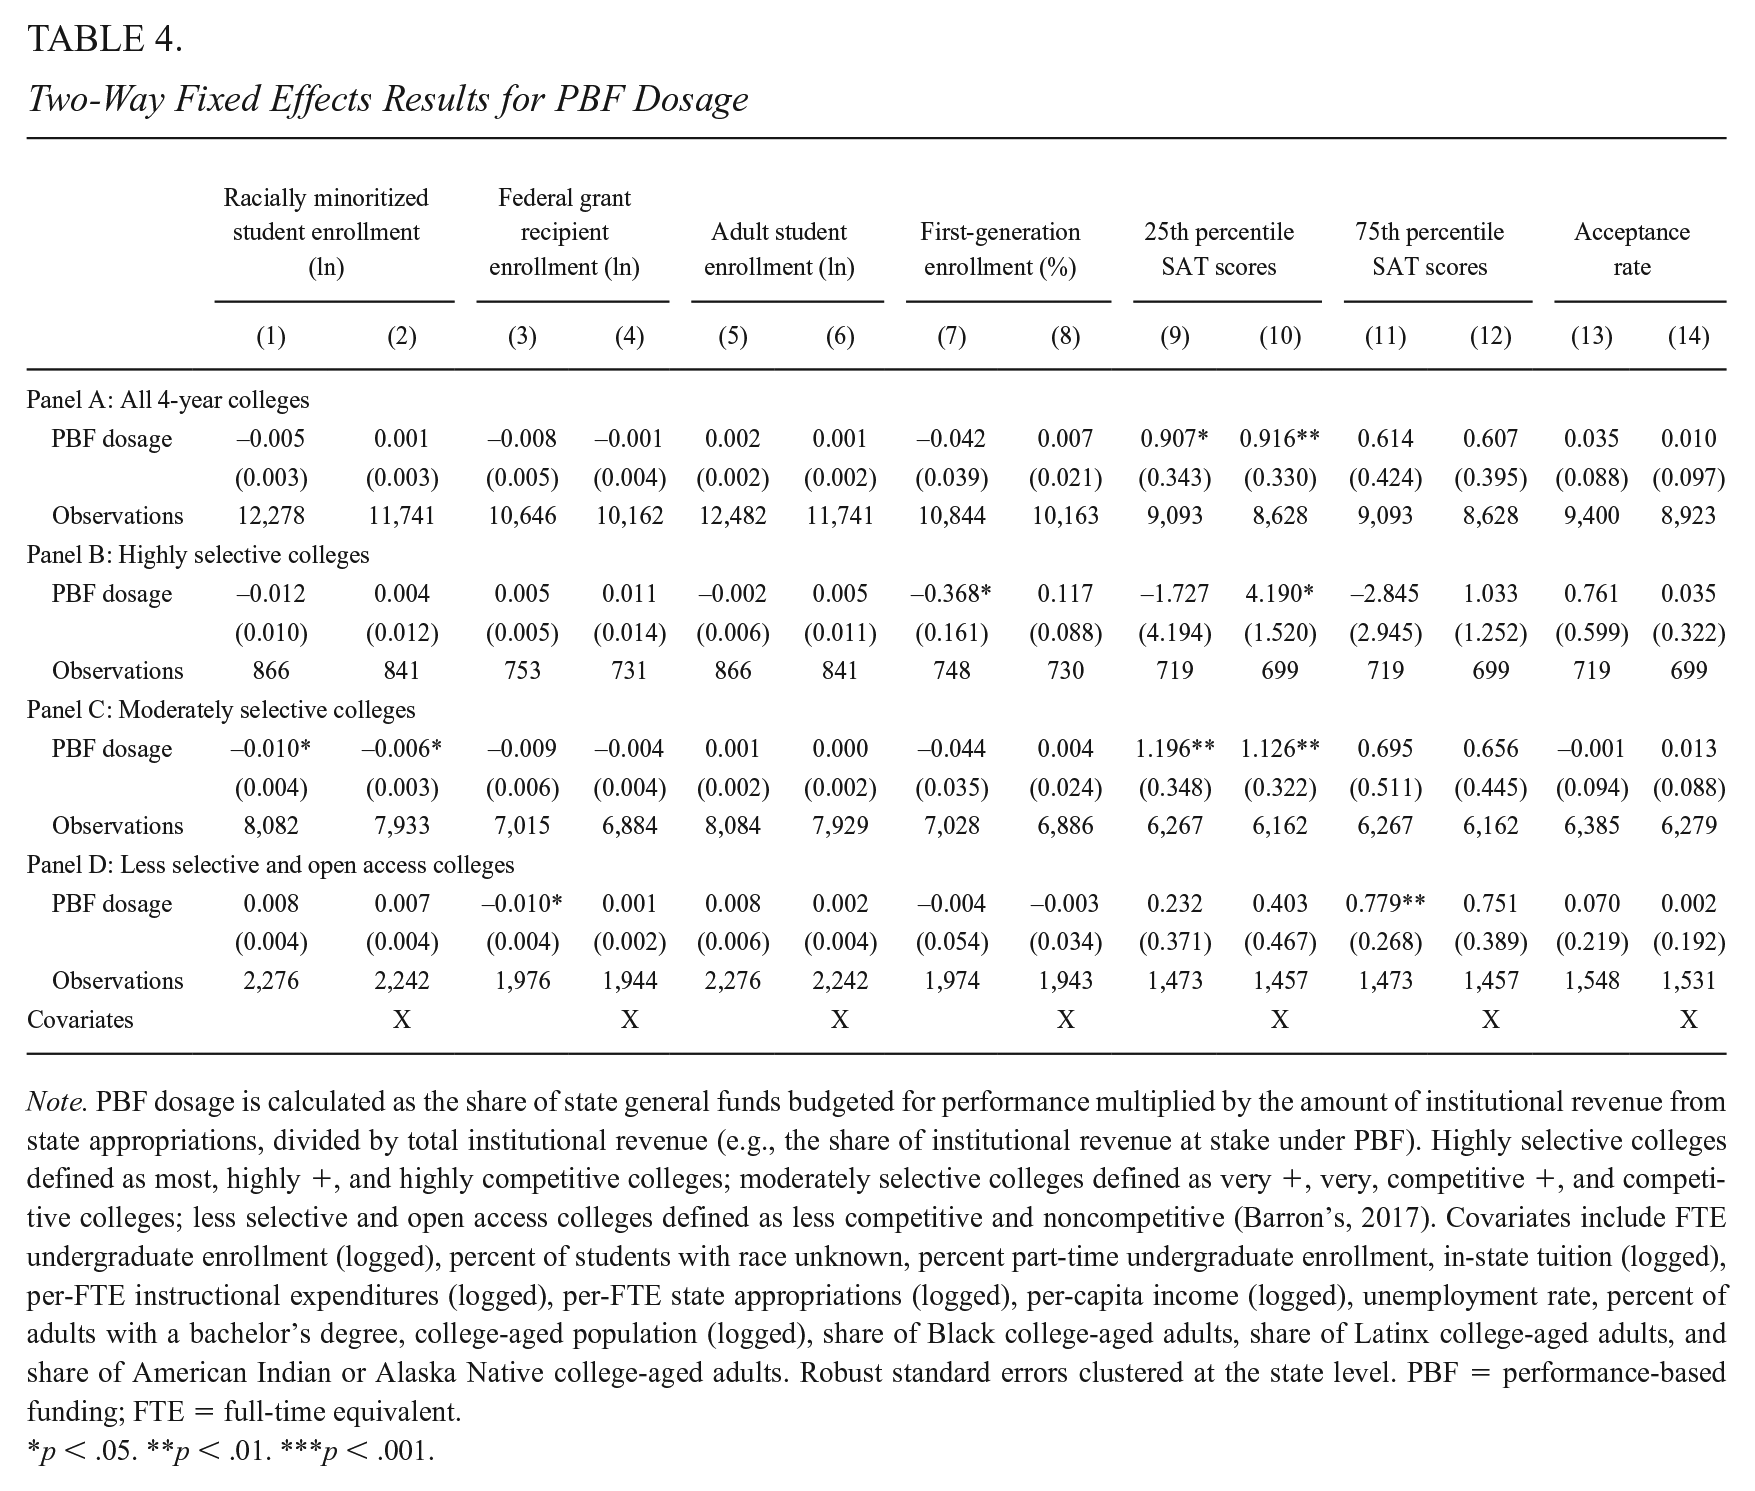
Note. PBF dosage is calculated as the share of state general funds budgeted for performance multiplied by the amount of institutional revenue from state appropriations, divided by total institutional revenue (e.g., the share of institutional revenue at stake under PBF). Highly selective colleges defined as most, highly +, and highly competitive colleges; moderately selective colleges defined as very +, very, competitive +, and competitive colleges; less selective and open access colleges defined as less competitive and noncompetitive (Barron’s, 2017). Covariates include FTE undergraduate enrollment (logged), percent of students with race unknown, percent part-time undergraduate enrollment, in-state tuition (logged), per-FTE instructional expenditures (logged), per-FTE state appropriations (logged), per-capita income (logged), unemployment rate, percent of adults with a bachelor’s degree, college-aged population (logged), share of Black college-aged adults, share of Latinx college-aged adults, and share of American Indian or Alaska Native college-aged adults. Robust standard errors clustered at the state level. PBF = performance-based funding; FTE = full-time equivalent.
p < .05. **p < .01. ***p < .001.
We did not find evidence that PBF dosage relates to changes in enrollment among racially minoritized, federal grant recipient, adult, and first-generation college students for the full sample of 4-year colleges (H1). We found evidence that as the share of an institution’s revenue tied to performance increased, 25th percentile SAT scores also increased (H2). Results indicated that each percentage point increase in PBF dosage was associated with around a 0.9 point increase in 25th percentile SAT scores in models that both adjust and do not adjust for time-varying covariates. We did not find evidence of a statistically significant relationship between PBF dosage and 75th percentile SAT scores or acceptance rate for the full sample of 4-year colleges.
When we examined the relationship between PBF dosage and enrollment and selectivity by institution type, we found some evidence that increases in the share of institutional revenue tied to performance were associated with decreases in enrollment among racially minoritized students at moderately selective colleges. These findings were significant at the .05 level across both model specifications. We also found that increases in PBF dosage were associated with increases in 25th percentile SAT scores at moderately selective colleges. Each percentage point increase in PBF dosage was associated with just over a 1 point increase in 25th percentile SAT scores. This finding was significant at the .01 level across both model specifications.
Gardner results (shown in Supplementary Table A2 in the online version of the journal) offered additional evidence that increases in PBF dosage were associated with a statistically significant increase in 25th percentile SAT scores across model specifications in both the full sample of 4-year colleges and moderately selective colleges. Gardner results did not show a similar decline in racially minoritized student enrollment at moderately selective colleges that we found in the TWFE analysis and also indicated that PBF dosage was associated with an increase in 75th (and 25th) percentile SAT scores in the full sample and moderately selective colleges. We did not find consistent evidence of changes in enrollment or selectivity at highly selective or less selective and open access colleges in response to changes in PBF dosage in either TWFE or Gardner analyses.
Taken together, TWFE and Gardner results indicate that increases in the share of institutional revenue tied to performance were associated with increases in 25th percentile SAT scores in the full sample of 4-year colleges, and particularly, in moderately selective colleges. We found suggestive evidence, in TWFE model specifications only, that increases in PBF dosage were associated with decreases in enrollment among racially minoritized students at moderately selective colleges.
We next examined whether the inclusion of equity metrics in PBF policies resulted in changes in enrollment among the specific populations of students targeted in the metrics (H3). Table 5 presents results from these analyses for all sample institutions in Panel A and by institutional selectivity in Panels B to D. No PBF was the referent category, and we report estimates for whether or not PBF included an equity metric for the specific population of students included in the enrollment outcome. At the full sample of public 4-year colleges, we did not find evidence of changes in enrollment among racially minoritized, federal grant recipient, and adult students after PBF adoption, regardless of whether states included an equity metric for the population.
Two-Way Fixed Effects Results for PBF Equity Metrics
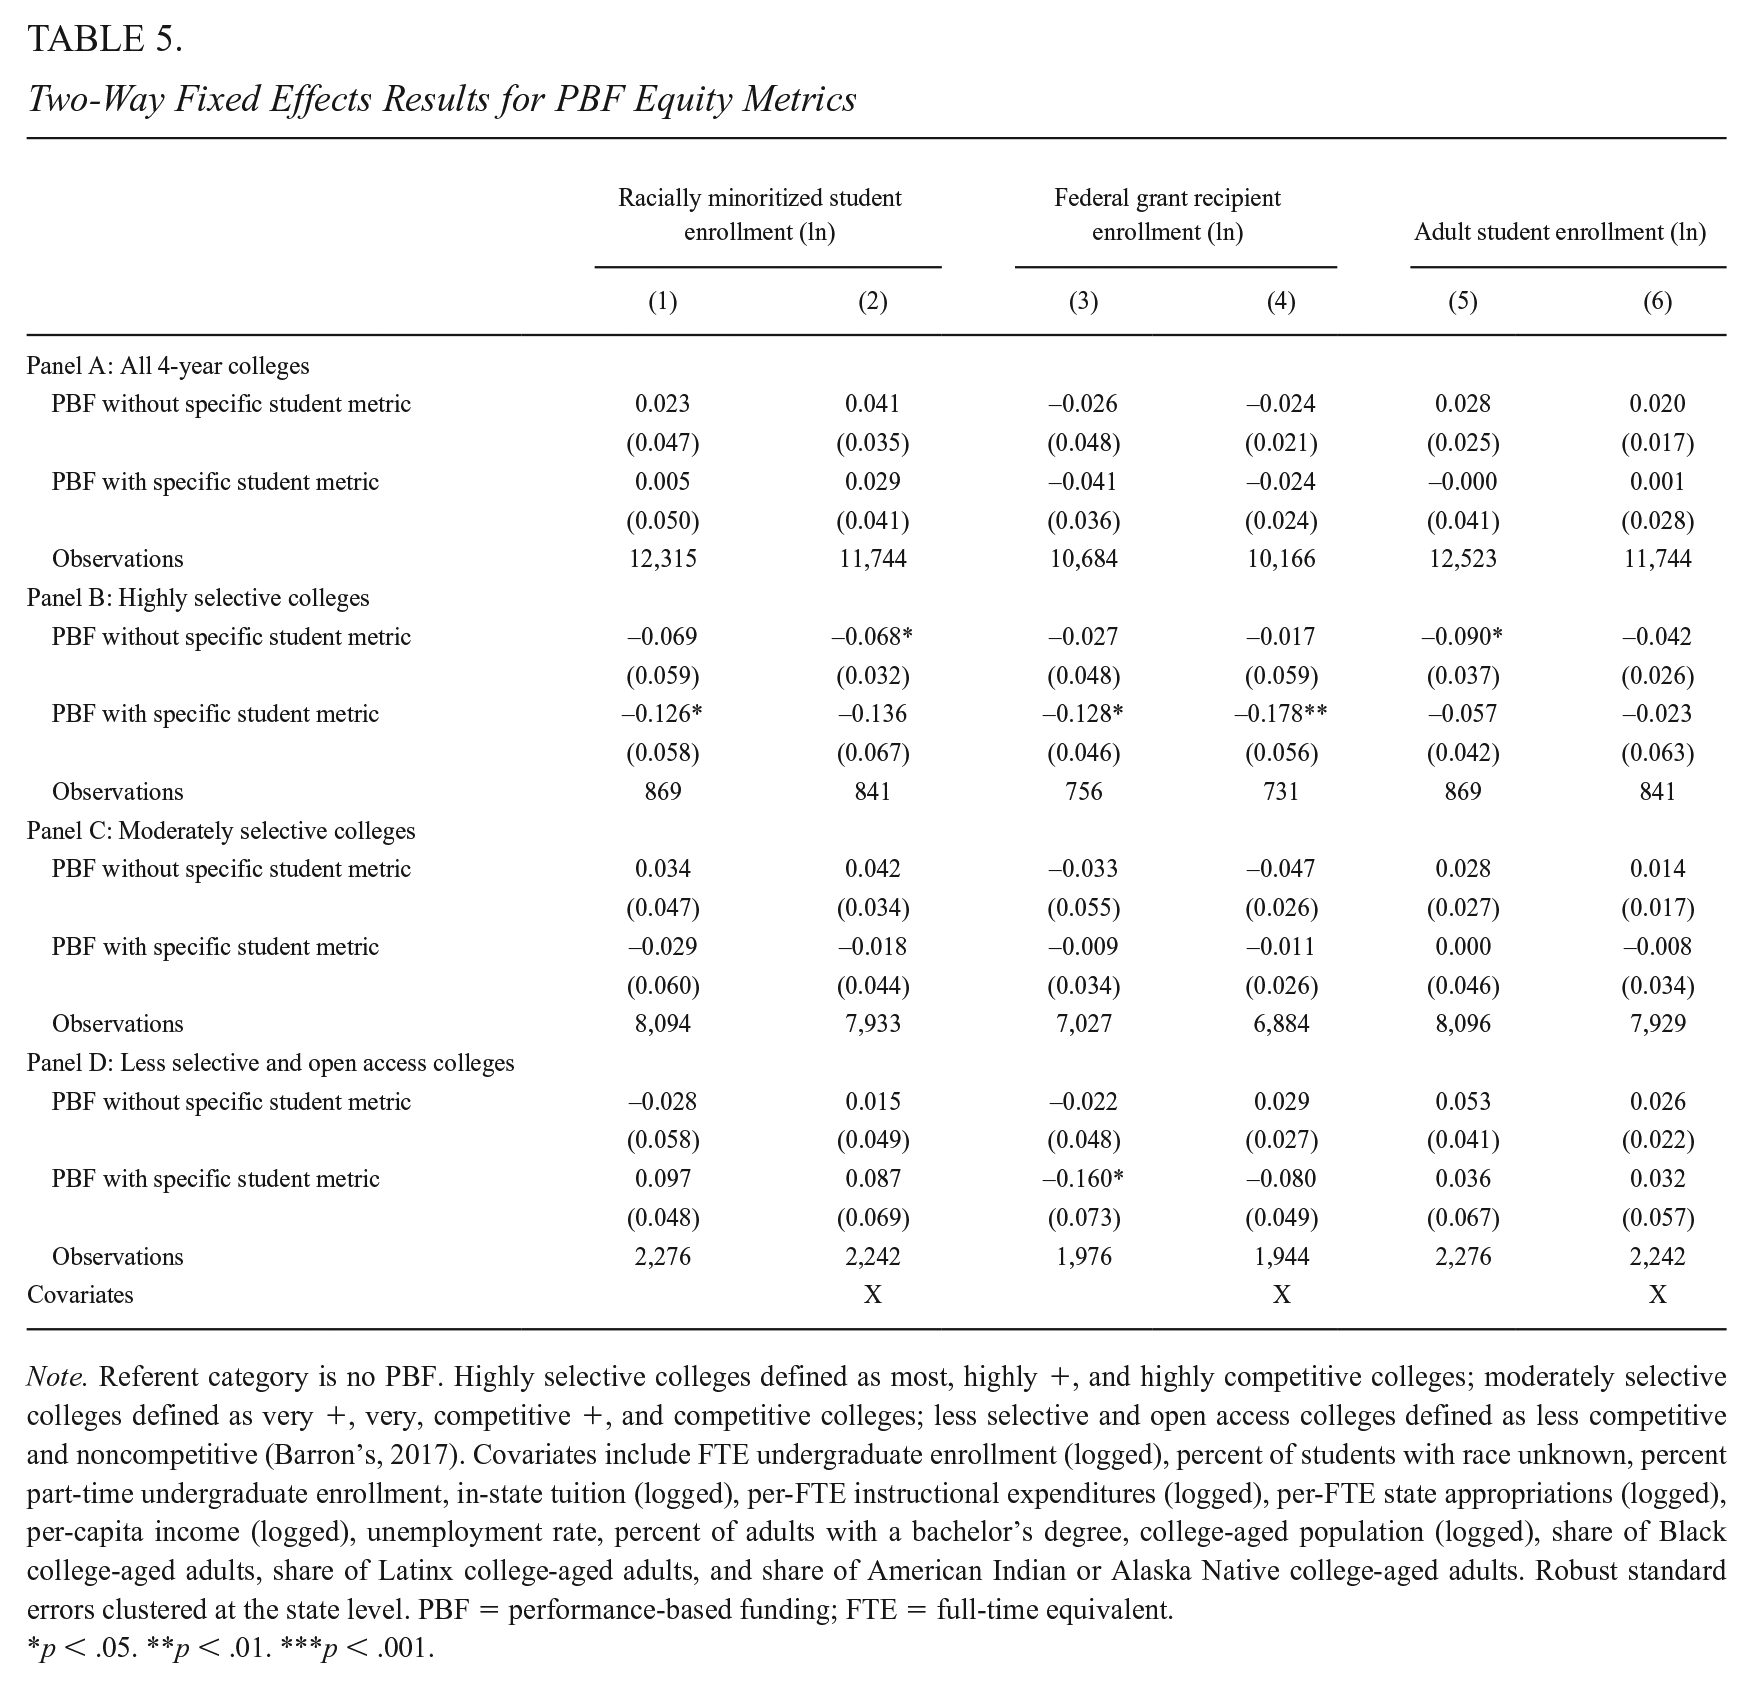
Note. Referent category is no PBF. Highly selective colleges defined as most, highly +, and highly competitive colleges; moderately selective colleges defined as very +, very, competitive +, and competitive colleges; less selective and open access colleges defined as less competitive and noncompetitive (Barron’s, 2017). Covariates include FTE undergraduate enrollment (logged), percent of students with race unknown, percent part-time undergraduate enrollment, in-state tuition (logged), per-FTE instructional expenditures (logged), per-FTE state appropriations (logged), per-capita income (logged), unemployment rate, percent of adults with a bachelor’s degree, college-aged population (logged), share of Black college-aged adults, share of Latinx college-aged adults, and share of American Indian or Alaska Native college-aged adults. Robust standard errors clustered at the state level. PBF = performance-based funding; FTE = full-time equivalent.
p < .05. **p < .01. ***p < .001.
At highly selective institutions, we found evidence of a decrease in enrollment among racially minoritized students and federal grant recipients, even in the presence of an equity metric focused on each specific population. Results for racially minoritized student enrollment were significant at the .05 level but were not statistically significant when adjusting for time-varying covariates, so we interpret this with caution. Results for federal grant recipients, however, were significant across models (at the .05 level when only adjusting for fixed effects and at the .01 level when adjusting for fixed effects and time-varying covariates). At moderately selective as well as less selective and open access colleges, we did not find consistent evidence of changes in enrollment among underserved student subpopulations after PBF adoption, regardless of whether PBF included equity metrics for those populations. Gardner results (shown in Supplementary Table A3 in the online version of the journal) showed no consistent evidence of enrollment changes, regardless of whether states included equity metrics or not, across institution types. Considering TWFE and Gardner results together, we conclude there is little evidence of changes in enrollment among racially minoritized students, federal grant recipient students, or adult students, regardless of whether states included equity metrics for those specific populations. 4
Event Study Results
We next report results from the Sun and Abraham (2020) event study analysis, which are shown for the full sample of public 4-year colleges in Figure 4 and by institutional selectivity in the online supplemental materials (see Supplementary Figures A1–A3 in the online version of the journal). For these models, we used binary PBF policy variables because, to date, event study approaches that account for differential treatment timing and heterogeneous treatment effects do not support continuous variables. 5 Event studies reveal statistically significant declines in federal grant recipient enrollment and increases in 25th percentile SAT scores following PBF adoption in the full sample of 4-year colleges (Figure 4), and these effects appear to be concentrated in moderately selective colleges (see Supplementary Figure A2 in the online version of the journal). However, there are statistically significant declines in 25th percentile SAT scores in years leading up to PBF adoption, leading us to conclude that TWFE (and Gardner) results for 25th percentile SAT scores may reflect different pre-trends at colleges in PBF-adopting and non-PBF-adopting states, rather than actual effects of PBF.
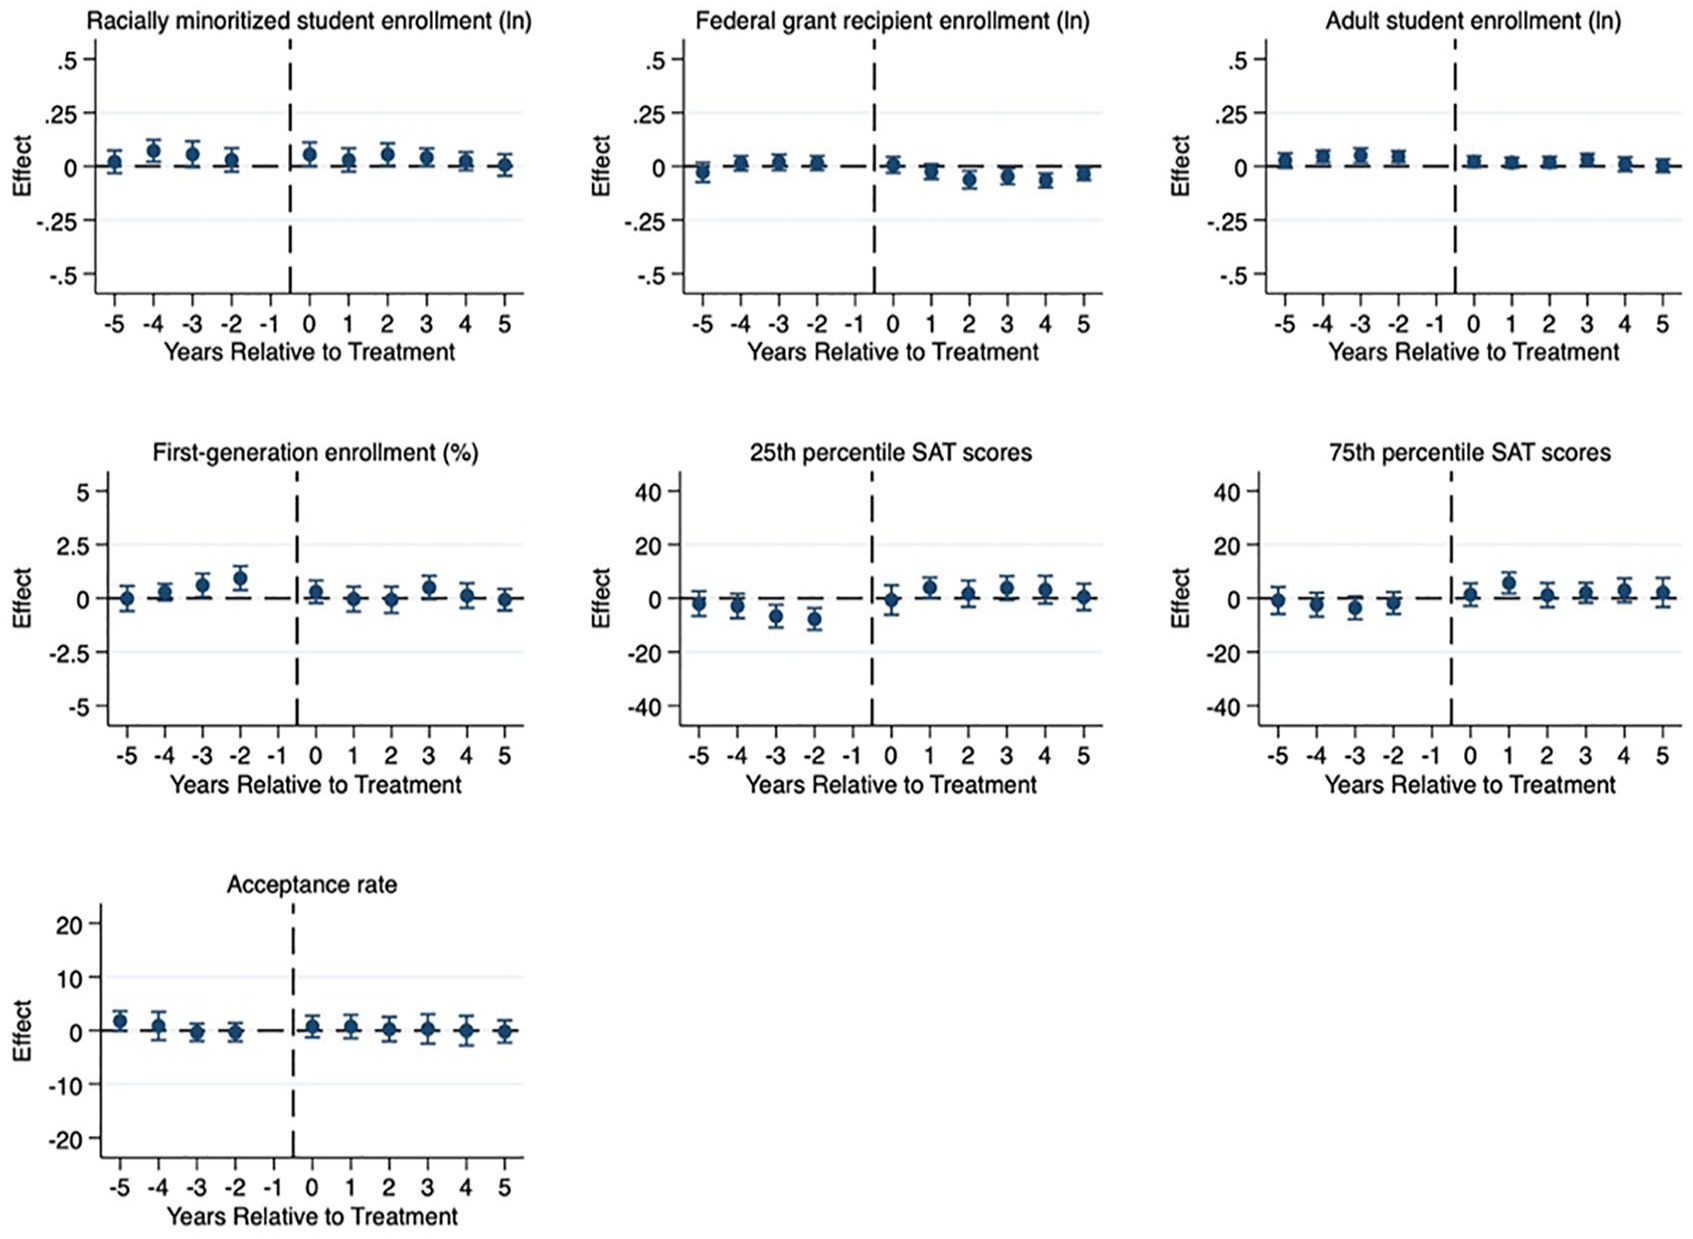
Event study results for 4-year colleges.
Similarly, we see some statistically significant changes in racially minoritized student enrollment at moderately selective colleges in years prior to PBF adoption. While Sun and Abraham (2020) event study results cast doubt upon TWFE results regarding the impact of PBF on 25th percentile SAT scores and enrollment among racially minoritized students, they also offer some evidence indicating PBF may lead to declines in federal grant recipient enrollment at moderately selective colleges. Across event studies, wide confidence intervals prevent us from drawing clear conclusions regarding the impact of a binary PBF policy measure on the outcomes we consider in this study.
Discussion
Performance funding has become a common feature of state higher education funding with its widespread adoption across states. This has led to a rapidly growing body of literature that examines the impacts of PBF. Despite mounting evidence that PBF has not consistently improved degree completion while also resulting in unintended consequences (Ortagus et al., 2020), 21 states allocated funds to public 4-year colleges using performance mechanisms in 2019. However, PBF policies look substantially different from state to state, for instance, in the share of funds at stake and whether states include equity metrics and the specific populations included in these metrics. Even within states, the share of funds at stake vary across institutions given the different levels of state appropriations that institutions in the same state receive. Due to data limitations, prior research has not been able to consider many of these variations, drawing instead on binary indicators for policy adoption or rough measures of PBF dosage or equity metrics. As a result, policymakers have limited evidence regarding the impacts of specific design features of PBF, even as advocacy groups push for specific forms of PBF (Snyder et al., 2020).
This study leverages the most comprehensive data on PBF policies, including the specific share of institutional revenue at stake under PBF in a given year, and recent methodological developments to offer the most specific evidence to date regarding whether and how PBF policies can be designed to reduce inequities in college access. Ultimately, we are not able to conclude much due to various potential sources of bias, unconvincing pre-trends, and wide confidence intervals. We find some evidence that increases in the share of institutional revenue at stake under PBF are associated with decreases in enrollment among racially minoritized students at moderately selective institutions. However, we do not find widespread evidence of decreases in access across institution types, regardless of the share of revenue at stake, while findings indicate that equity metrics are unlikely to lead to enrollment gains among the populations they target.
Prior studies of PBF in Indiana show increased selectivity and decreased access, especially at more selective 4-year institutions (Birdsall, 2018; Umbricht et al., 2017). This aligns with later work showing gains in selectivity or enrollment tended to occur with the implementation of PBF 2.0 (Gándara & Rutherford, 2020). The academic literature on the unintended consequences of PBF adoption does not account for the wide variations in PBF dosage across states or the varying extent to which individual institutions rely on state funding. By considering PBF policy design and institutional reliance on state funding, we advance previous literature on PBF and situate the importance of PBF dosage and policy design when seeking to unpack the unintended consequences of PBF policies.
Prior research has also shown inconsistent effects of equity metrics (Gándara & Rutherford, 2018; Kelchen, 2018a), with enrollment sometimes increasing or decreasing in the presence of these metrics. However, by examining more detailed PBF policy details than were available in prior research, our analysis shows prior inconsistent evidence regarding the effects of PBF may be explained by differences in PBF policy design. That is, once differences in PBF policy design are accounted for, there is not consistent evidence of declines in college access (but also no evidence of gains in access). Thus, our results offer additional insights regarding the extent to which PBF policies, regardless of different design features, can expand access. We turn to this discussion next.
Implications for States, Institutions, and Students
U.S. states have experimented with PBF over more than two decades, adopting, halting, abandoning, and readopting PBF policies as they go (see Rosinger et al., 2022, for an overview of the evolution of PBF). States have also revised PBF polices over time, changing the amount of funds allocated using performance metrics and the metrics on which colleges’ performance are evaluated. However, PBF policies are not a foregone conclusion in state higher education funding. Even in the last 10 to 15 years during which the number of states with PBF policies has steadily grown, a number of states have abandoned PBF (Rosinger et al., 2022). Given the amount of adoption and revision activity around PBF, it is critical for state policymakers to understand whether and how PBF can be designed to reduce inequities in college access. It is also crucial to recognize the potential for heterogeneous effects across institutions and students within a state.
When it comes to how states can design more equitable PBF policies, our findings offer suggestive evidence that higher dosage PBF policies may threaten access to selective colleges for racially minoritized students. Our study also indicates that PBF equity metrics are typically not enough to expand enrollment among specific populations of students, even when those groups are prioritized in PBF policies. In fact, we find suggestive evidence of decreased enrollment among low-income students at highly selective colleges even in the presence of equity metrics. This may be because the amount of funding states link to equity metrics is too small to incentivize institutions to change behavior regarding enrollment, although it is possible that the number of degree completions could increase if institutions focus on providing additional services to students who are enrolled. State policymakers may consider increasing the amount of funding associated with equity metrics to better incentivize colleges to enroll underserved students.
In prioritizing equity, however, it is critical for state policymakers to use race-conscious approaches if they wish to move the needle on reducing racial inequities in college access. One way to do so through PBF is to explicitly include equity metrics that support racially minoritized student enrollment and success, as this would provide support for institutional leaders in developing their own initiatives. However, state policymakers often avoid explicitly addressing race in PBF policies (Gándara, 2020). States are more likely to include equity metrics that focus on income rather than race: just over half of PBF policies include race equity metrics while more than two thirds include low-income equity metrics (Rosinger et al., 2022). However, we emphasize the importance of race-conscious efforts to reduce the potential unintended consequences of PBF. This recommendation aligns with prior work suggesting that higher education policies that do not affirmatively consider race, such as holistic admissions reviews, socioeconomic-based affirmative action, and percent plan admissions policies, are often limited when it comes to expanding college access for racially minoritized students (e.g., Long, 2007; Reardon et al., 2018; Rosinger et al., 2021). Rather, race-neutral policies are likely to reproduce inequitable outcomes along racial lines.
When it comes to whether PBF policies, in any form, can be designed to promote more equitable student outcomes, our findings highlight the limitations of PBF—regardless of policy design—to expand access and reduce racial and economic disparities in selective college enrollment. In this study, we show that the presence of equity metrics are not enough to lead institutions to increase enrollments among the populations they target; however, PBF equity metrics appear to mitigate the unintended consequences of PBF by not exacerbating already-inequitable enrollment patterns in selective 4-year colleges. Simply put, PBF is not an effective strategy for states to increase access among underserved populations of students. If states continue to adopt and expand their commitment to PBF policies, the inclusion of equity-oriented metrics should be a baseline criterion for the design and implementation of any PBF policy.
And promoting more equitable access to 4-year colleges may not be policymakers’ intent: prior research demonstrates that PBF-adopting states discussed PBF in relation to equity less often than states that opted out of implementing PBF (Gándara & Daenekindt, 2022), indicating that policymakers may not implement PBF with explicit expectations around equity. Regardless of policymakers’ desire (or not) to expand access, viewing evidence from the present study alongside a large body of literature that consistently does not show positive effects of PBF across a range of outcomes, leads us to conclude that perhaps PBF, in any form, cannot expand access to public 4-year colleges. As a result, we urge strong caution against enacting policies such as PBF, which regardless of design, do not appear to expand access for underserved students and simply reproduce an already-inequitable higher education system.
Implications for Future Research
This national study demonstrates that policy design is one potential consideration in shaping the outcomes of PBF policies. In doing so, it highlights the importance of future research that considers the state contexts that shape both what these policies look like and the outcomes the policies achieve. Future research, for example, might consider the mechanisms through which states allocate nonperformance funds to public colleges and universities. Despite variation across states, in most states, PBF policies tie a small share of funds to student outcome metrics (Rosinger et al., 2022). The remainder is allocated based on previous years’ appropriations, enrollment levels, or other mechanisms, sometimes adjusting for prior funding inequities or to boost funding levels for smaller schools (Lingo et al., 2021). These funding formulas, in addition to features of PBF policies, are likely to shape colleges’ incentives to enroll particular students or restrict enrollment among others. We are not aware of prior research that examines how the varying funding mechanisms that exist alongside PBF shape enrollment outcomes. This type of research would offer additional insight into how states can develop more equitable, evidence-based funding formulas for higher education more broadly, especially given the concerns our study raises about the ability of PBF policies, regardless of design, to expand access to public 4-year colleges.
To further probe our findings, future studies might examine college enrollment patterns when states abandon PBF. For instance, if enrollment among underserved students expands when states no longer fund PBF, findings would offer further support regarding the unintended impacts of PBF. Alternatively, if there are no enrollment changes after the abandonment of PBF, findings would indicate alternative funding mechanisms are similarly inequitable. As a number of states have suspended or moved away from PBF in recent years (e.g., the Pennsylvania State System of Higher Education has halted its PBF policy during system- and state-level changes), there is an opportunity to consider how enrollment changes in a post-PBF funding environment. Such research would offer additional insight into how institutions respond to changing incentives and how states can design more equitable funding policies.
We focused our consideration of institution type on selectivity given the importance highly selective colleges have played in upward mobility (albeit for the relatively small number of underserved students they enroll; Dale & Krueger, 2002, 2014). Future research might consider the impacts of PBF policy design features on enrollment at other institution types that provide avenues for upward mobility, particularly for larger numbers of students. For instance, minority-serving institutions (MSIs) have served a critical role in providing educational opportunity for many racially minoritized students who have historically been excluded from entering American higher education. To the extent that PBF policy features incentivize these institutions to enroll fewer underserved students, states may undermine their goals of expanding educational attainment and reducing educational disparities. From a theoretical perspective, MSIs may face particular pressures to respond to incentives in place under PBF as they are relatively more dependent on state funding for revenue than other institution types (A. Cunningham et al., 2014).
The presence of additional state policies could also shape the impacts of PBF on college access. At least 20 states have enacted statewide free college programs, many of which have emerged in the last decade and include programs in PBF-adopting states, such as the Tennessee Promise, Hawaii Promise, and Rhode Island Promise (Mishory & Granville, 2019). Many states also operate broad-based merit aid programs intended to keep high-achieving students in state (Zhang & Ness, 2010). In an effort to improve college completion rates, states have also focused policy efforts on helping adults with some college but no degree return to college (Jenkins & Fink, 2020). These efforts that are designed to improve college access and student success coincide with the adoption of PBF, and future research might consider the role these policies play in conjunction with PBF in promoting (or restricting) more equitable student outcomes. While principal–agent theory and resource dependence theory largely consider incentives institutions face that may lead them to restrict access (or the supply of seats in selective higher education), other state policies enacted at the same time may change students’ college enrollment behavior (or the demand for selective higher education). As a result, the impacts of PBF could be confounded by the presence of policies that affect the demand for higher education (and vice versa). Thus, future research could contribute to our understanding of state higher education policy by considering the array of state-level policy changes in recent decades.
Finally, future researchers will benefit from continual advances in TWFE designs that better account for how states implement educational policies in practice. Although recent advances account for biases introduced when states or other units of analysis adopt policies at different times, methodological approaches to date still fail to fully account for the realities of policy implementation in two key ways. First, policies are often not binary in nature. As we demonstrate, PBF policies vary substantially within and across states over time in the share of funds tied to student outcome metrics. While the TWFE model can support continuous and categorical policy treatments and the Gardner (2021) two-stage DiD approach is robust to treatment effect heterogeneity, event study approaches that account for nonbinary treatments are less clear. In addition, current event study approaches do not support discontinuities in policy treatment. Yet states have implemented, halted, and reimplemented PBF over time (Rosinger et al., 2022). As a result, even the most recent methodological advances do not fully account for the realities of state educational policy adoption. In this study, we incorporate new approaches to overcome some limitations, but we hope continued advances will account for continuous and categorical policy variables and the discontinuation and readoption of policies over time.
Supplemental Material
sj-pdf-1-epa-10.3102_01623737221147905 – Supplemental material for The Impact of Performance Funding Policy Design on College Access and Selectivity
Supplemental material, sj-pdf-1-epa-10.3102_01623737221147905 for The Impact of Performance Funding Policy Design on College Access and Selectivity by Kelly Rosinger, Justin Ortagus, Robert Kelchen and Junghee Choi in Educational Evaluation and Policy Analysis
Footnotes
Acknowledgements
We thank Lynneah Brown, Karly Caples, Alexander Cassell, Garam Chu, Sam Riggs, Yahya Shamekhi, and Nicholas Voorhees for their excellent research assistance on this project. We are grateful for the feedback we have received from the advisory board members for this project: Alisa Hicklin Fryar, Tiffany Jones, and David Tandberg.
Declaration of Conflicting Interests
The author(s) declared no potential conflicts of interest with respect to the research, authorship, and/or publication of this article.
Funding
The author(s) disclosed receipt of the following financial support for the research, authorship, and/or publication of this article: The research reported here was supported by funding from the William T. Grant Foundation, Arnold Ventures, and the Joyce Foundation. All opinions presented in this paper and any errors or omissions are our own. The analytic plan for this paper was preregistered with the Center for Open Science (![]() ).
).
Notes
Authors
KELLY ROSINGER, PhD, is an associate professor of education and public policy at Penn State University. Her research focuses on the barriers students face on the way to and through college and how federal, state, and college policies can be designed to promote racial and economic equity.
JUSTIN ORTAGUS, PhD, is an associate professor of Higher Education Administration & Policy and the director of the Institute of Higher Education at the University of Florida. His research examines how online education, community colleges, and various state policies affect the opportunities and outcomes of underserved students.
ROBERT KELCHEN, PhD, is professor and department head at the University of Tennessee. His research focuses on higher education finance and accountability.
JUNGHEE CHOI, PhD, is an assistant professor of higher education at the University of Oklahoma. His research focuses on higher education policy and finance.
References
Supplementary Material
Please find the following supplemental material available below.
For Open Access articles published under a Creative Commons License, all supplemental material carries the same license as the article it is associated with.
For non-Open Access articles published, all supplemental material carries a non-exclusive license, and permission requests for re-use of supplemental material or any part of supplemental material shall be sent directly to the copyright owner as specified in the copyright notice associated with the article.