
Abstract
This article reports on the impacts of a nudge intervention designed to narrow the gender gap in technology education. I randomly assigned approximately 4,000 college freshmen to one of three advising interventions during new student orientation. Students in the treatment group received a brochure containing information about technology courses and were exposed to stereotypical imagery, neutral imagery, or counter-stereotypical imagery. Information provision had a positive impact on both technology course take-up and technology major selection. A stronger response by men led to an overall increase in the gender gap, but this gap is smallest among students exposed to counter-stereotypical imagery.
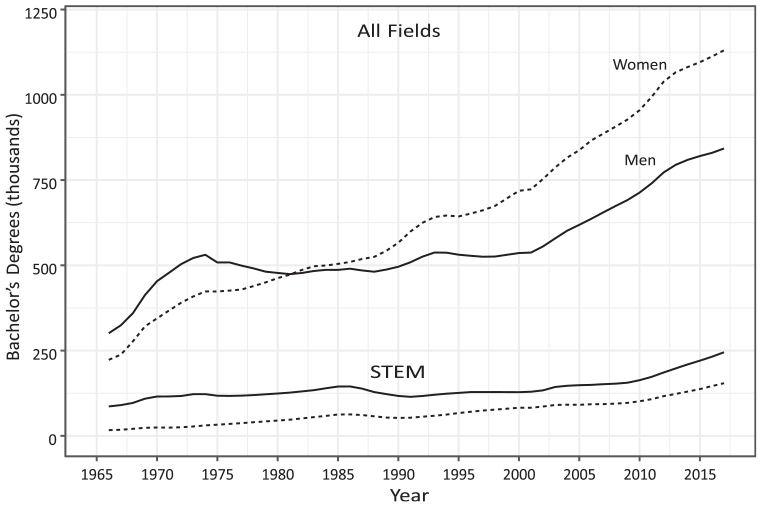
Bachelor’s degrees awarded by sex in all fields and STEM, 1966–2017.
Sorting across college majors is primarily driven by differences in abilities, preparation, and preferences, with preferences for particular majors being most important (Altonji et al., 2012; Arcidiacono, 2004). Men tend to give equal weight to the pecuniary and nonpecuniary aspects of different occupations, whereas women give twice as much weight to the nonpecuniary aspects (Altonji et al., 2012; Zafar, 2013). As a result, lower levels of technology skill investment among women persist even as technology and engineering occupations have become more desirable and in greater demand. Recent estimates of the economic returns to college majors rank engineering as most valuable, followed by computer science, statistics, and mathematics (Carnevale et al., 2015). In 2016, computer and information technology occupations paid a median annual wage of $82,260, more than twice the median of $37,040 for all occupations (Bureau of Labor Statistics, U.S. Department of Labor, 2017). Meanwhile, technology and engineering job openings were projected to grow by 13%, adding more than half a million jobs between 2016 and 2026 (Bureau of Labor Statistics, U.S. Department of Labor, 2017). Controlling for abilities and preparation, women tend to enter female-dominated fields such as education and psychology over computing and engineering.
Research suggests that gender differences in academic choice are the result of a complex array of individual and structural factors. From an early age, girls are less likely than boys to be encouraged to engage with technology and computing as a form of play (Margolis & Fisher, 2002). Schools tend to consider technology skills elective rather than core academic skills; as a result, girls receive little information about how technology education relates to their occupational interests and goals (Margolis, 2008). In adolescence, young women who are exposed to STEM often encounter sexism and resistance from parents (Brown & Leaper, 2010; Rice et al., 2013). Negative experiences diminish their identity and sense of belonging in STEM and contribute to a lowered sense of confidence and ability (Kim et al., 2018). These beliefs persist over time, informing preferences for college majors and career paths (Breen & Garcia-Penalosa, 2002; Cejka & Eagly, 1999).
This article reports on the impacts of a brief, low-cost “nudge” intervention delivered to a large sample of first-time, full-time college students at a midwestern university. During orientation, students attended a workshop where an academic advisor explained the degree attainment process and guided them through the process of selecting courses for their first semester of college. While students in the control group received a generic list of courses suitable for first-year students, students in the treatment group also received an informational brochure as the advisor encouraged them to consider taking a technology course. The brochure provides information about 31 technology courses and includes messaging and imagery designed to counter gendered stereotypes about technology and engineering. I consider three research questions:
I show that making small changes to an individual’s decision-making context—that is, altering the choice architecture via information provision—leads to changes in academic choice. Students in the treatment group were more likely to enroll in a technology course during their first semester, taking 20% more technology credits on average. In addition to these short-term effects on enrollment, the intervention had longer-term effects on major selection: students in the treatment group were more likely to declare a computer science or engineering (“tech”) major at the end of their first or second year. Information provision led to increased technology course enrollment and major selection among women, but it also expanded the gender gap in technology major selection due to men’s stronger response to the intervention. Of women exposed to the treatment, those who received brochures featuring images of women interacting with technology were more likely to select a technology major than those exposed to mixed-gender or male-only imagery.
The Gender Gap in Academic Choice
Human capital theory predicts that students choose a course of study to maximize their lifetime earnings, given the constraints of their innate abilities, degree of preparation, and preferences for certain types of work (Altonji et al., 2012; Arcidiacono, 2004). A related perspective, expectancy-value theory, posits that educational choice and achievement are a function of beliefs about one’s ability to succeed, the extent to which one values particular tasks, and sociocultural factors that influence one’s development over time (Eccles, 2015). Beginning with their earliest experiences, boys and girls develop beliefs and attitudes that lead to preferences for different academic subjects. These beliefs and attitudes are formed through their interactions with socializers (e.g., parents, teachers, and peers), exposure to stereotypes, awareness of their aptitudes, and interpretations of their experiences (Eccles, 2015). During adolescence, young people develop identities linked to particular activities and experiences. Young women are less likely to develop a STEM identity due to experiences with academic sexism (Brown & Leaper, 2010), a lack of parental support for their participation in STEM (Rice et al., 2013), and a range of negative interactions within STEM communities (Carlone & Johnson, 2007; Kim et al., 2018). As a result, gender gaps in academic preferences persist, even when accounting for differences in test scores and grade point average (GPA).
Interventions intended to narrow the gender gap in technology education should take gendered patterns in preferences—based on stereotypes and differences in self-perception, risk tolerance, and experiences—into account. First, women are less likely to enter technology and engineering fields because they are socialized to pursue fields with communal goals, such as healthcare (Corbett & Hill, 2015; Diekman et al., 2015). Despite the ubiquity of technology across nearly all fields of study, including those with communal aspects, occupational stereotypes lead women to view technology and engineering as involving a narrow set of tasks completed in isolation, and as providing few opportunities to help others (Butterfield & Crews, 2012). Researchers surveyed women on their choice of major and found that those who were less likely to major in computing were influenced by stereotypes of computing students as isolated and computer-focused, believing “. . . that computer majors will work as programmers, that successful computer majors have a significant technology background, and that most computer majors are devoted computer hobbyists” (Butterfield & Crews, 2012, p. 4). As technology and engineering are not culturally associated with women’s goals, women are more likely to choose or be steered into alternative educational pathways.
A large body of experimental studies demonstrates that gender stereotypes dampen women’s interest and achievement in STEM. These stereotypes are distinct from the occupational stereotypes discussed earlier. Rather, group stereotypes—generalizations of group characteristics that may or may not be accurate—are held by varied members of society and are derived from many sources, including socialization, experiences, and prejudice. For example, women are stereotyped as less suitable than men for technological careers. In the context of course and major selection, these stereotypes may trigger a social identity threat, any situation where “. . . people recognize they may be devalued in a setting because of one of their social identities” (Murphy et al., 2007, p. 879). Social identity threat has been shown to negatively affect the participation and performance of underrepresented groups, such as women and racial minorities (Steele, 1997; Steele et al., 2002).
A third factor leading to gendered occupational preferences is the gender gap in self-perception. Women report an overall lack of self-confidence, lower self-perception of abilities, and lower tolerance for risk (Butterfield & Crews, 2012; Else-Quest et al., 2013). Surveys of college freshmen conducted over a 40-year period show that women entered college better prepared academically but with lower intellectual self-confidence than men (Sax, 2008; Sax et al., 2017). This gap in self-confidence widened over the course of 4 years. Meanwhile, economists have linked women’s lower tolerance for risk to gender differences in human capital investment (Niederle & Yestrumskas, 2008). Women are more sensitive to academic performance and less likely than men to major in computing when challenging course requirements—such calculus and computer programming—are required early on (Sax, 2008).
Finally, the gender gap in computing and engineering is shaped by limited information. As the number of women attending college has grown in recent years, women attending college are more likely to be from low-income backgrounds and to be first-generation college students (Sax, 2008). The high schools from which these students graduate are less likely to offer computer science (Margolis, 2008). Under pressure to raise overall achievement, schools serving low-income populations tend to emphasize core subjects, and those that intend to offer computing as an elective face a shortage of teachers who are properly trained to teach programming (Margolis, 2008). Even when advanced courses such as AP Computer Science are available, they must compete with popular electives such as music and foreign language. As women are less likely to be exposed to the breadth of technology occupations, they may assign more weight to stereotypes when deciding whether to invest in technology skills (Margolis, 2008). While both women and men face limited formal exposure to computing, men are much more likely to be exposed outside of school through toys, gaming, and extracurricular activities.
This mix of individual and structural factors may explain why women’s participation in science pathways has risen in tandem with their increased attendance in college, while declining or remaining constant in the other STEM fields. Figure 2 shows bachelor’s degrees awarded to women in STEM from 1966 to 2012. During this period, the number of degrees in technology, engineering, and mathematics programs has remained constant, grown slightly, or declined over time.
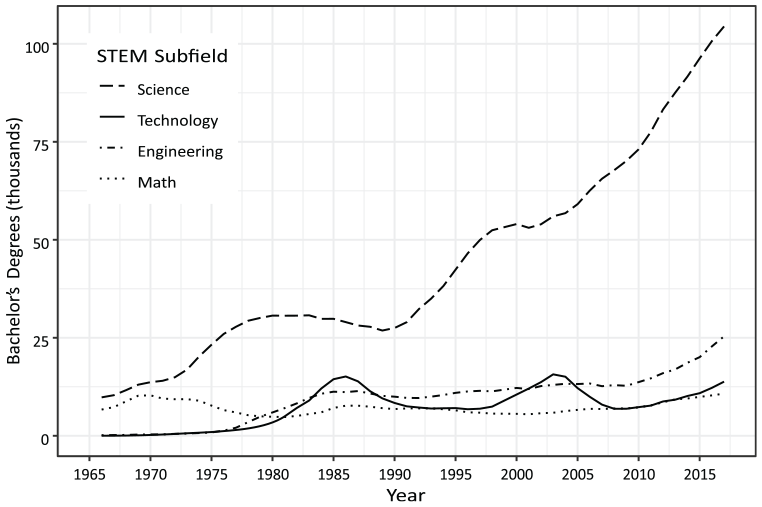
Bachelor’s degrees awarded to women in STEM subfields, 1966–2017.
Intervention Design
A nudge is a type of intervention in which an institution structures a decision-making context with the intent of serving decision-makers’ interests without constraining choice (Thaler & Sunstein, 2008). Nudges are most appropriate when decision-makers face a complex set of options, choose infrequently, or experience a delay before receiving feedback. All of these criteria apply to postsecondary academic choice: students have a limited number of opportunities to choose which courses to take, must choose from hundreds of majors, and will not realize gains or losses from their decisions until years later. The basis for the nudge approach rests on awareness that all decisions are made within some context—the choice architecture—and that changes to the features of that context correspond to predictable changes in behavior (Kahneman, 2013; Thaler & Sunstein, 2008). Because the brain relies on shortcuts to process information quickly, people make systematic errors in judgment and decision-making. Nudges are designed to block or mitigate these errors. They can be used to provide new information, to structure a sequence of decisions, or to prime individuals to act on their intentions (Thaler & Sunstein, 2008).
Nudge interventions have become prevalent in higher education. Most interventions aim to increase college enrollment, financial aid take-up, or persistence over time (Bird et al., 2021). In one example, researchers provided freshmen college students with text message reminders to refile their financial aid applications (Castleman & Page, 2016). Students who received the reminders were much more likely to refile and remain enrolled. In another, Castleman et al. (2014) show that low-income, college-bound students were more likely to immediately enroll in college after being nudged with an offer of academic counseling during the summer after high school graduation. Another study demonstrated that offering loans to community college students led to increased educational attainment (Marx & Turner, 2019).
Nudge interventions in education have encompassed many different designs, including altering defaults, providing new information or framing existing information, triggering social norms through peer group comparisons, reminding students of goals or deadlines, or appealing to a student’s sense of belonging, social identity, or mindset (Damgaard & Nielsen, 2018). Information provision, specifically, has been shown to influence students’ demand for and ranking of particular college majors (Conlon, 2021; Hastings et al., 2018). However, few studies have incorporated nonpecuniary information. One exception is the study by Bayer and colleagues (2019), which paired a welcome email with information about the diversity of research and researchers in the field of economics. Students exposed to this treatment were more likely to complete an economics course during their first semester.
Thaler and Sunstein (2008) define a choice architect as someone “who has the responsibility for organizing the context in which people make decisions” (p. 3). They elaborate further: If you design the form that new employees fill out to enroll in the company health care plan, you are a choice architect. If you are a parent, describing possible educational options to your son or daughter, you are a choice architect.
By this definition, academic advisors are choice architects. The choice architecture for this study is the advising process for first-year, full-time undergraduate students. The intervention modified this default process by (a) altering the script that advisors use during the workshop to highlight academic pathways in technology and (b) providing an alternative list of courses that included a brochure designed to encourage women’s consideration of technology courses. The intervention alters students’ course selection behavior in a predictable way—students are more likely to enroll in technology courses after receiving information and encouragement from advisors—yet it does not forbid students from considering other courses.
I assess whether this brief, low-cost nudge increases the information available to students in a salient way, thereby reducing a reliance on gender and occupational stereotypes, and leading to increased technology course take-up and technology major selection. In addition to structured information provided by academic advisors, the intervention features messaging and imagery intended to target women, who are more likely to be risk-averse and whose decisions are more likely to be shaped by low confidence, stereotypes and identity threats, and negative experiences in STEM (Brown & Leaper, 2010; Butterfield & Crews, 2012; Else-Quest et al., 2013; Kim et al., 2018; Murphy et al., 2007; Niederle & Yestrumskas, 2008; Sax, 2008; Sax et al., 2017). A summary of the key design elements—advisor encouragement, information, imagery, and messaging—is provided in Table 1.
Intervention Design Elements
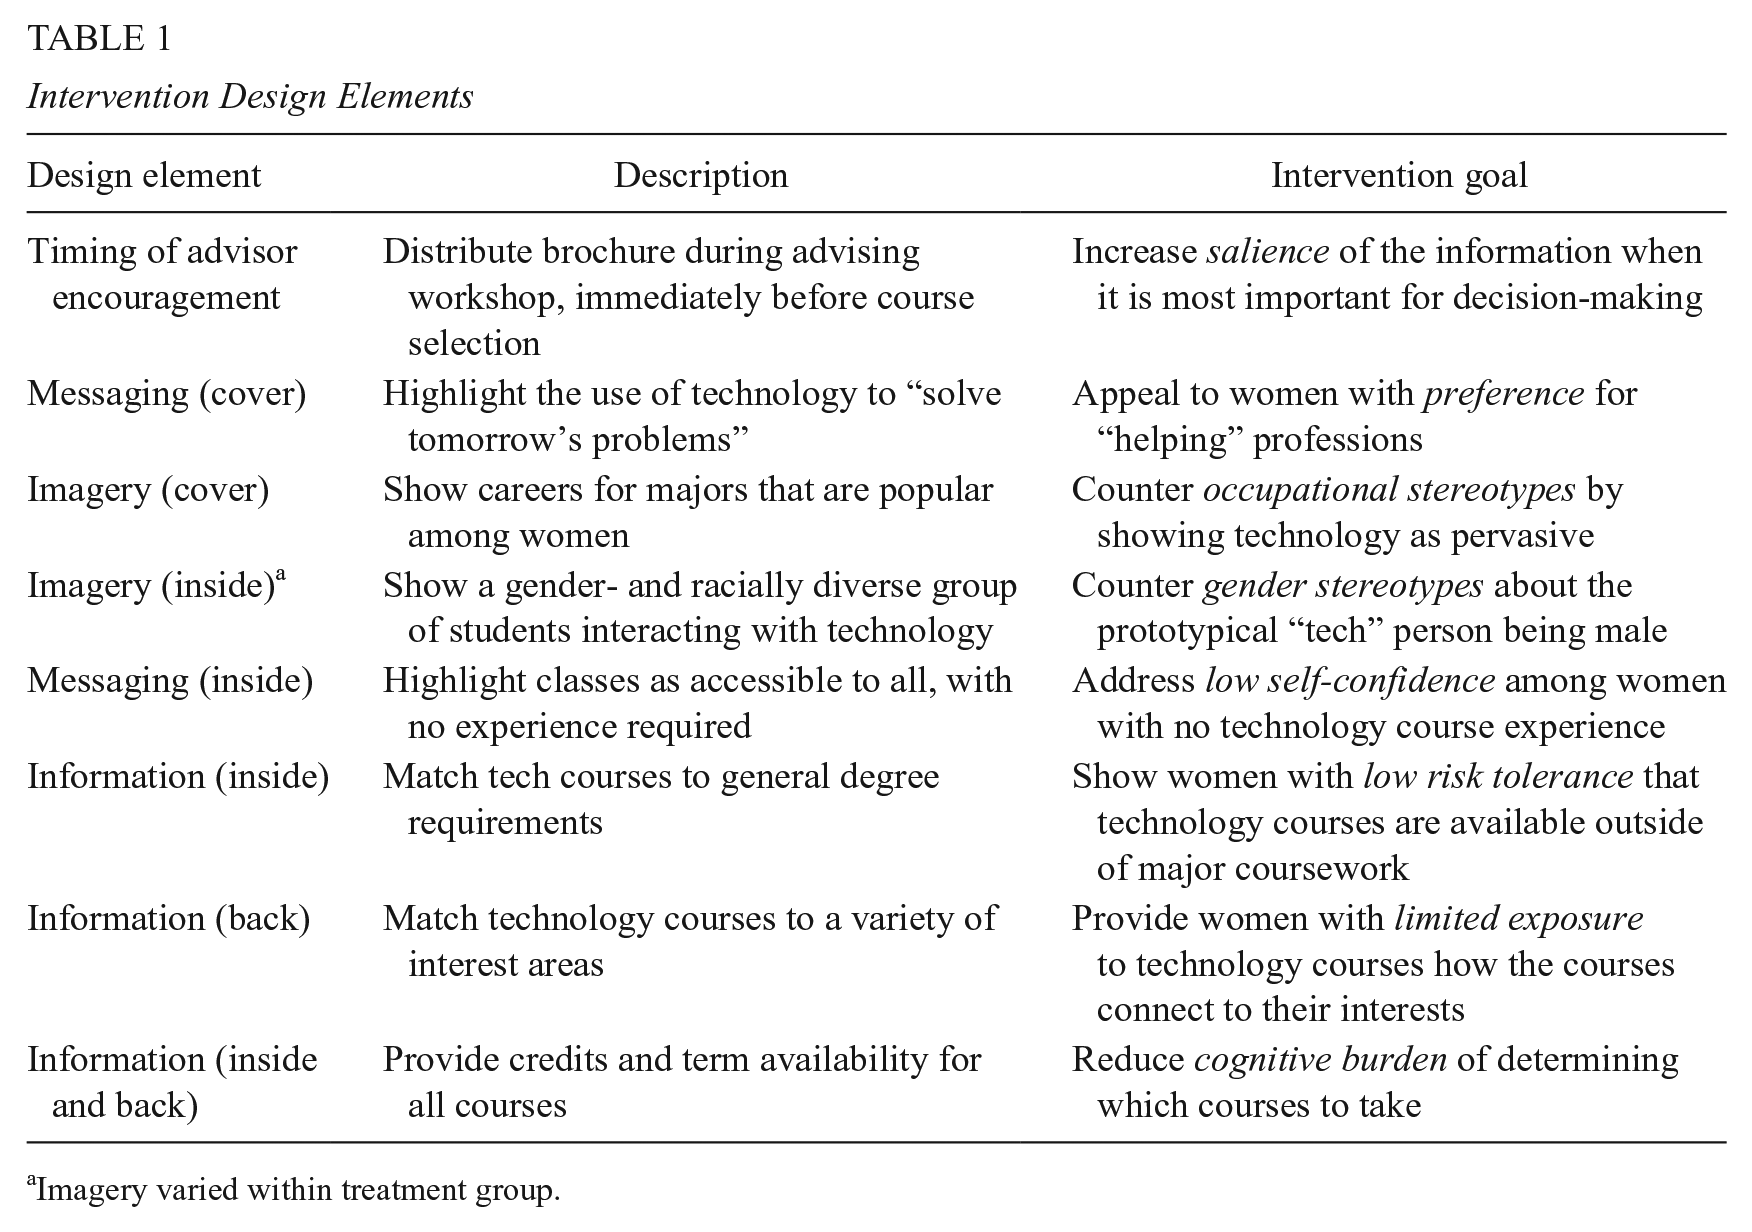
Imagery varied within treatment group.
Increasing Information
The core feature of the intervention is an informational brochure that includes a structured list of technology course offerings. The brochure simplifies technology course selection by mapping students’ course options to both degree requirements and topical interest areas. Each set of courses is organized in a section that corresponds to the general degree requirements. The timing of the intervention is important. In one study, students who were randomly assigned to a course in the same semester as their major selection were more likely to choose a major from the department offering that course (Patterson et al., 2019). The intervention brochure is distributed just prior to students’ course enrollment selections and leverages the ability of academic advisors to make particular topics salient.
The glossy, full-color, four-page brochure includes several features intended to nudge students whose preferences are aligned with technology course offerings. The brochure lists technology courses from across academic fields along with a description, the number of credits, and the semesters that the course is typically offered. Courses were included only if they had no prerequisites and as long as they met one or more of the following criteria: (a) provided training in a particular software or hardware; (b) utilized technological assets as part of course delivery; (c) prominently featured computing, digital assets, or digital skills; (d) surveyed the technologies that are relevant for disciplinary applications; or (e) developed an applied skill that is a stated or implied learning outcome of the course. Courses were further divided into sections that correspond to general education requirements, such as “Arts & Humanities (A&H)” and “Natural and Mathematical Sciences (N&M).” While courses from the A&H section do not always look like traditional technology courses, I included them if they met the criteria described above. This design decision was intentional, to showcase the breadth of technology education beyond stereotypical applications. Courses meeting general requirements were featured inside the brochure while all other technology courses were organized by interest area (business, social sciences, media, etc.) and listed as exploratory courses or electives on the back page of the brochure. 1
Countering Stereotypes
Empirical evidence suggests that counter-stereotypical imagery and messaging may impact particular groups by mitigating social identity threat, with a greater effect on women than on men. For example, researchers measured students’ science comprehension after exposing them to chemistry textbooks with stereotypical (male-dominated) imagery, counter-stereotypical imagery, or mixed-gender imagery (Good et al., 2010). Men and women in the control group, who were exposed to mixed-gender imagery, performed about the same.
In one treatment arm, exposure to a counter-stereotypical textbook had a positive, statistically significant effect on women’s comprehension. In the third treatment arm, exposure to a stereotypical textbook had a positive effect on men’s performance, but the effect was not statistically significant. The intervention, which modified the situational context of a chemistry class, had an overall stronger effect on women than on men.
Incorporating a similar design into the intervention, the front of the brochure features a diverse array of individuals in careers that are popular among women, including business, journalism, nursing, and biology. The inside of the brochure features images of diverse groups of students interacting with technology. To further investigate the impact of gender balance in the imagery, I varied the images on the inside of the brochure using the following three conditions: (a) a nonstereotypical condition with mixed-gender imagery (men and women), (b) a stereotypical condition with images of only men, and (c) a counter-stereotypical condition with images of only women. 2
The intervention included messaging intended not only to promote the value of technology, but also to reassure women of their ability to succeed and reduce their perception of technology courses as risky. The messaging on the cover and inside pages of the brochure positioned technology as aligned with all students’ goals but particularly appealing to students interested in the “helping” professions (e.g., “Build today’s technology, solve tomorrow’s problems”). Statements inside the brochure included “technological skills give you an edge in any major”; “no experience is required”; “no prerequisites”; “everything you need to know, you’ll learn”; “make a difference”; and “studying technology will change the way you think and expand your opportunities.” While imagery varied by treatment arm, all brochures included the same messaging. Images of the intervention brochure are provided in Supplementary Appendix A in the online version of the journal.
Experiment Design
A randomized controlled experiment was conducted with approximately 4,000 first-time, full-time students attending new student orientation at a state flagship university in the Midwest. As part of the typical orientation process, each student chooses one of 23 orientation sessions and attends on campus for 2 days. I randomly assigned each orientation cohort to a treatment or control condition, with each orientation cohort comprising 180 students on average. Students were assigned at the cohort level to minimize peer spillover effects. As students visit campus for 2 days several weeks prior to moving in, attendees within each cohort encounter only those students receiving the same intervention. 3 The randomization technique also resulted in treatment assignments that varied across different days of the week and across different weeks to control for any systematic patterns in students selecting into cohorts.
On the first day of orientation, each student attends a degree planning workshop in a group of up to 15 students. During each workshop, regardless of assignment, advisors distribute materials about the university, a list of open courses, and a standardized course planning worksheet. In the 12 weeks leading up to the start of the fall 2016 semester, the university held up to 18 concurrent workshops per day for each orientation. Across all orientations, advisors ran a total of approximately 400 workshops. Student scheduling and advisor scheduling were handled by different administrative offices, such that each student-advisor pairing was random. As all advisors facilitated several workshops, and their work schedules varied over time, each advisor facilitated workshops for both treatment and control cohorts.
Course registration is divided into two components: an academic career planning workshop, which occurs on the first day of orientation, and an enrollment meeting with an academic advisor, which occurs on the second day. During the workshop, students receive an overview of the advising process, select classes, and learn about student resources on campus. The goal of the planning workshop is to provide each student with an overview of the process for obtaining a degree and to assist students in choosing courses for their first semester. During the second day of orientation, students are sorted into small groups of three to four students. The group meets with an academic advisor, and during the meeting, each student uses the planning worksheet from the previous day to register for classes using a handheld tablet.
In preparation for the academic planning workshops held on a given day, advisors pick up all materials in an assembly-line fashion. On dates assigned to the treatment condition, each advisor was also issued a packet of intervention brochures, an instruction sheet, and a sign-in sheet. All advisors presented a common set of presentation slides, and on treatment days, modified their presentation based on a script given with the instructions. At the end of each workshop, all remaining brochures were collected to prevent advisors from distributing intervention materials to students in control group cohorts.
During the workshop, an academic advisor, accompanied by a second advisor or a student peer coach, gives a 90-minute presentation to approximately 15 students. The presentation includes an overview of the degree attainment process, provides insights and tips for successfully obtaining a degree, and encourages students to consider how particular types of courses can prepare them to be successful. During the second half of the workshop, the advisor instructs students to choose courses from an unstructured list of open courses provided to them by advisors. Advisors walk through the planning worksheet, which is organized into sections that corresponded to the four types of general education courses required for all degrees: A&H, Social and Historical (S&H), N&M, and World Language and Culture. By the end of the workshop, each student has a list of courses to take during the fall semester. In contrast to the default list of courses provided to students, the intervention provided a list of technology courses organized by degree requirement and provided key information about each course, including a brief description, the number of credit hours, and the semesters that the course was offered. For students in treatment cohorts, the intervention exposed students to messaging and imagery intended to counter stereotypes about women and technology occupations, and advisors echoed this messaging during their presentation.
I consider hypotheses with respect to (a) the behavioral response to the intervention, (b) the timing of that response, and (c) differences between groups on the basis of gender. Nudge interventions are designed to reduce decision-makers’ reliance on heuristics, in this case through information provision. As all students face a considerable cognitive burden and would benefit from increased information, I expect the intervention to have positive effects on technology course enrollment and major selection. This behavioral response should be strongest immediately after the intervention; therefore, I expect the highest technology course enrollment response to occur during the first term.
The counter-stereotypical components of the intervention are designed to target women (see Table 1), and research suggests that these design elements will primarily influence women but not men. Therefore, I expect the intervention to have a stronger impact on women than on men. However, this impact is likely to be moderated by students’ baseline preference for technology occupations, which I do not observe. Some women may enter with a strong preference for technology but be deterred by a lack of confidence, aversion to risk, or identity threat. For these students on the margin, the intervention is most likely to lead to a change in outcome. Other women may have such a weak preference for technology that even if the intervention succeeds in shaping their level of confidence or risk, they will opt for courses in other fields. The distribution of technology preferences also varies by gender; for all the reasons stated earlier, more men will be on the margin than women. Depending on the effectiveness of the gender-specific components, the intervention may meaningfully increase women’s participation while having no impact, or even increasing the gender gap.
Data and Method
The sample includes students who were admitted to the university, without direct enrollment into a specific academic unit. These “undeclared” students typically declare a major by the end of their first or second year. For the 4,180 students who participated in the experiment, I examine two outcomes—technology course take-up during the first two terms and technology major selection during the first 2 years. For a given term, I observe whether each student enrolled in at least one technology course during the fall or spring terms. I include two measures for the “enrollment” outcome—a binary measure Enrolled with a value of one if a student enrolled in a technology course and a discrete measure Enrolled Credits indicating the total number of credits associated with the technology courses. As a certain number of credits are required to graduate, the total number of technology credits sheds some light on the importance of technology courses relative to other courses. To classify courses and majors as belonging to the technology subfield, I use the 2010 Classification of Instructional Programs taxonomy developed by the National Center for Education Statistics as part of the Integrated Postsecondary Education Data System (National Center for Education Statistics, 2010). Finally, I observe whether each student declared a technology major by the end of the first (or second) year.
Student-level pretreatment covariates include gender, minority status, age at the time of orientation, and ability. The minority dummy variable takes on a value of one if the student identifies with a racial or ethnic group that has been historically underrepresented in the technology and engineering fields. As Whites and Asians are overrepresented in computing and engineering, both are coded as zero. 4 As a proxy for ability, I include the percentile corresponding to each student’s highest test score, either ACT or SAT. 5
Descriptive statistics by treatment and control status are reported for the sample of 4,180 students in Table 2. Approximately two thirds of students were in cohorts assigned to the treatment group. Consistent with nationwide enrollment trends, slightly more than half of the sample are female students. Underrepresented minority students comprise 11.5% of the control group and 10.8% of the treatment group—for technology and engineering, this includes African American, Latino, Native American, and multiracial students. The average student’s ACT or SAT score fell around the 76th percentile. The average student is 18 years and 5 months of age, consistent for first-time, full-time freshmen.
Descriptive Statistics by Treatment Group
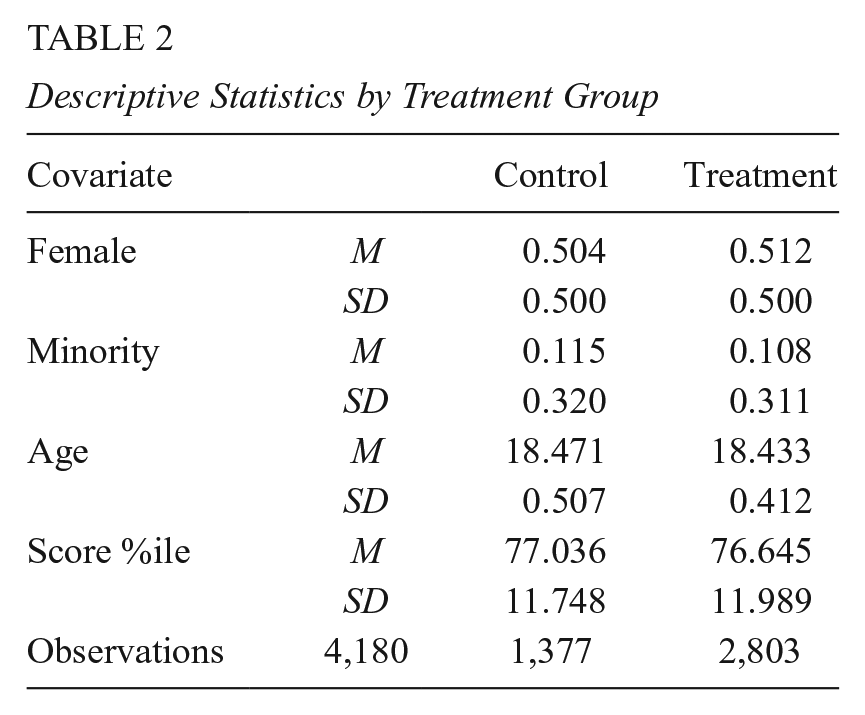
The randomization procedures produced balanced groups. All mean differences between groups are less than a tenth of a standard deviation, small enough to conclude that the groups are balanced in expectation for all covariates. As an additional randomization check, I regressed the treatment variable on the covariates (see Table 3). None of the covariates predict assignment to the treatment group, with the exception of age. 6 However, the magnitude of the age difference is substantively small: 0.044 years or approximately 16 days.
Randomization Check
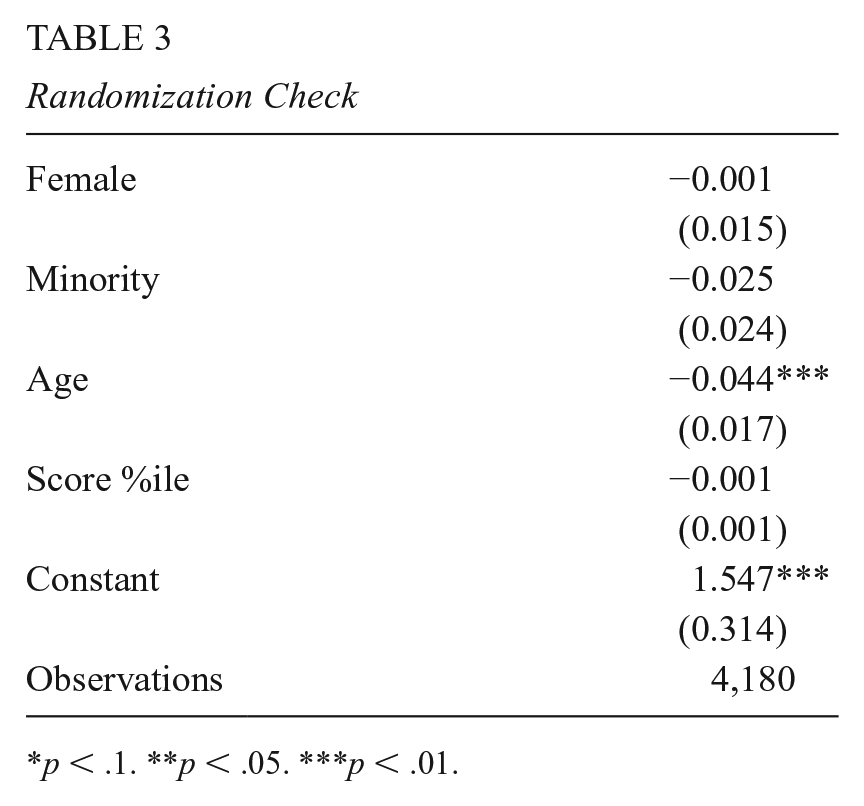
p < .1. **p < .05. ***p < .01.
Given a population of first-time, full-time students and randomization at the cohort level, I assume that treatment assignment is unrelated to potential outcomes across and within cohorts. The average treatment effect is the difference in the sample proportions for students who enrolled in a technology course or selected a technology major, or the difference in the average number of credits enrolled. I estimate these effects using the following ordinary least squares (OLS) model:

where T is an indicator of assignment to the treatment group and Xi is a vector including score percentile, gender, race, and age. As students are clustered within advisors, I compute heteroskedasticity-robust standard errors and estimate alternate specifications with advisor fixed effects.
Testing a large number of comparisons increases the likelihood of falsely rejecting the null hypothesis (Schochet, 2008). To avoid false discoveries, I limit the confirmatory analyses to two outcomes—course enrollment and major selection—observed during students’ first and second years of matriculation. Given the theoretical basis for gender differences, and the explicit attention to countering gender stereotypes in the intervention design, I examine gender differences by including an interaction term. In addition to the confirmatory analysis, I conduct exploratory investigation of potential mechanisms based on treatment effects by imagery treatment arm as well as post hoc subgroups of students.
The outcomes of interest occur on different timelines: students enroll in courses each term, while they tend to select a major at the end of their first or second year. For this reason, I observe course enrollment for each of the first two terms (fall and spring semester) and I observe major selection for each of the first 2 years, where each year concludes with the summer semester. In the sections that follow, I report these estimates for each outcome with and without covariates. Results for specifications that include advisor fixed effects, which did not meaningfully change the results, can be found in Supplementary Appendix C in the online version of the journal.
Results
The intervention had a positive overall effect on technology course enrollment and major selection. In Table 4, I report the estimated effect of assignment to the treatment group on whether a student enrolls in any technology course during the first two terms, the number of credits enrolled, and whether a student selects a technology major during the first 2 years. Just less than a quarter of students in the control group (23.4%) enrolled in a technology course during their first term; the intervention increased this proportion by 2.5 percentage points. With a typical course providing 3 credits, the intervention raised the baseline technology credits from an average of 0.8 credits to 1.1 credits. The intervention had statistically significant effects on enrollment in the first term, and no effects on enrollment in the second term. This is consistent with my hypothesis that outcomes measured in close proximity to the intervention would be most heavily impacted. At baseline, a higher proportion of students from the control group enrolled in a technology course during their second term (28.9%). This suggests that some students with strong preferences for technology courses may have shifted their timing to take those courses sooner.
Summary of Treatment Effects
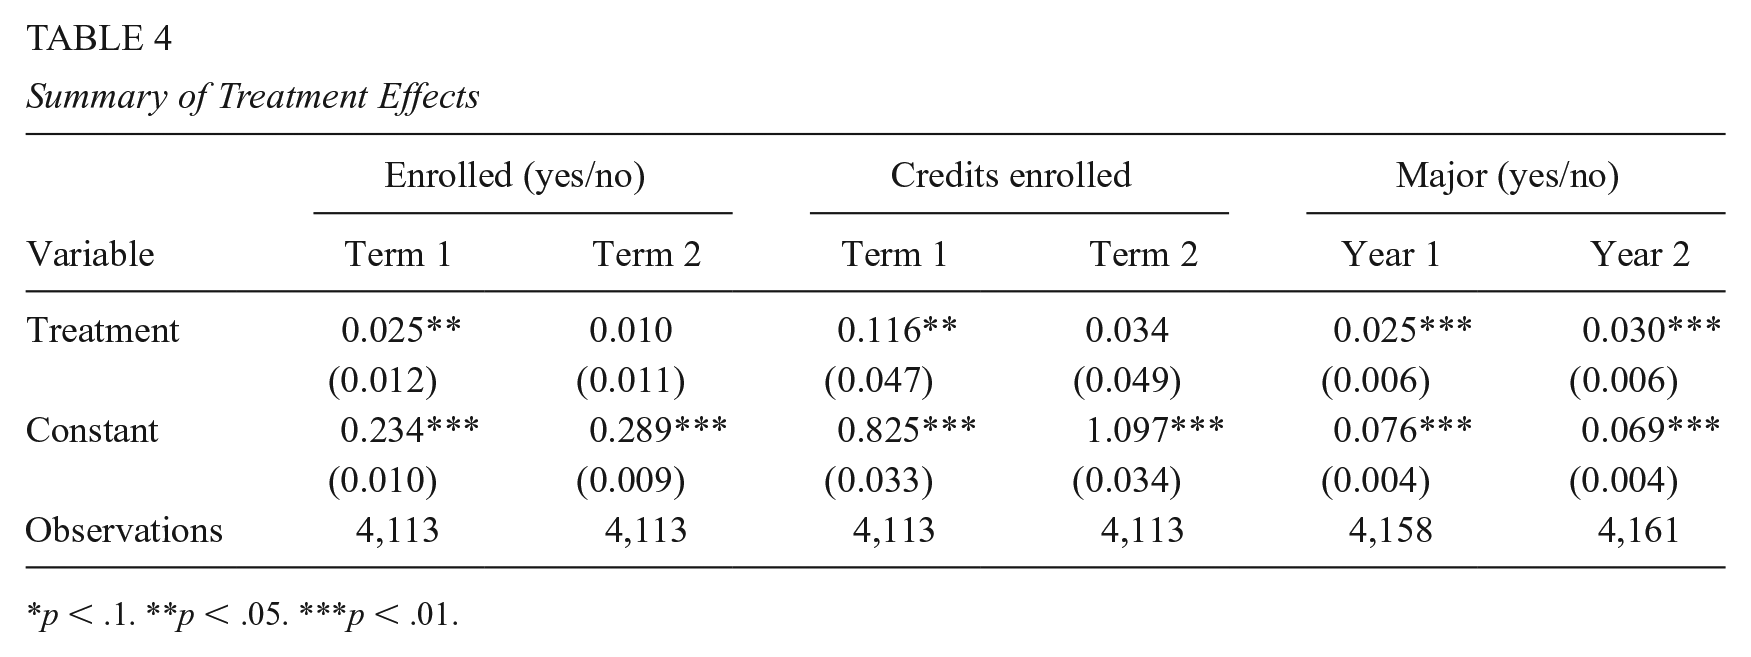
p < .1. **p < .05. ***p < .01.
The proportion of technology majors increased from 7.6% in the control group to 10.1% in the treatment group by the end of the first year. The intervention’s impact on major selection persisted over time, increasing from 2.5 to 3.0 percentage points in the second year. This suggests that those students who opted into technology majors remained, rather than switching to a different major during the second year. The intervention’s impact on technology major declaration is substantively large considering the ranking of technology majors relative to other majors. Historically, the most popular majors at the university were business (23.0%), biological and clinical sciences (16.4%), education (11.8%), communications (6.7%), and computer and information sciences (5.9%). The treatment effect of three percentage points represents a 33% increase in the overall share of students entering technology degree programs and results in an overall shift in the rankings of popular major programs.
Incorporating covariates and a gender (female) interaction term, Table 5 shows that the impacts of the brochure were primarily driven by male/unknown students. 7 For technology course enrollments during the first semester (Columns 1 and 3), the interaction term for treated female students was not significant. Its negative magnitude suggests that female students were less responsive to the treatment than men. For major selection, the gender interaction term is negative and highly significant. While the proportion of male technology majors increased by 4.9 percentage points in the first year and 5.3 percentage points in the second year (Columns 5 and 6), the proportions of female technology majors increased by 0.3 and 0.9 percentage points, respectively. Given the outsized response by male students, the intervention had not only the expected result of increasing women’s participation, but also the unexpected result of increasing the gender gap.
Summary of Treatment Effects by Gender
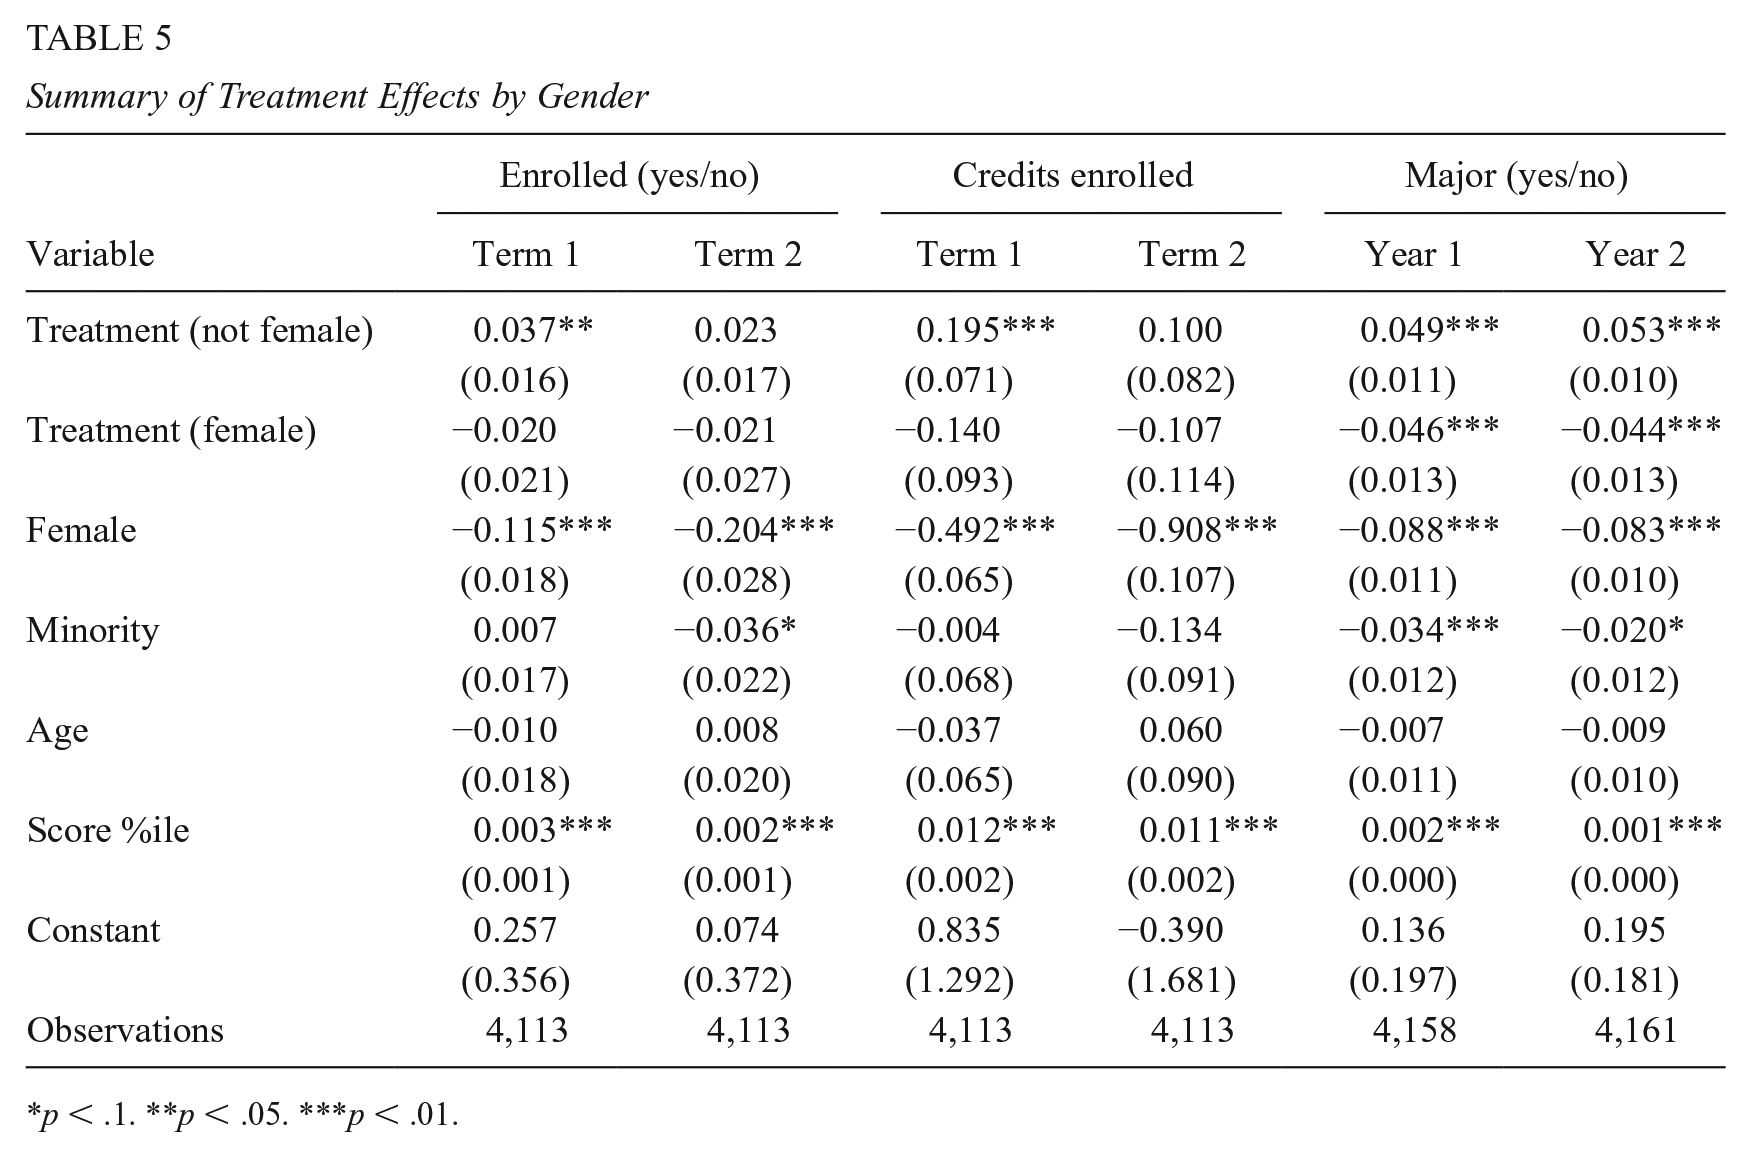
p < .1. **p < .05. ***p < .01.
In an exploratory investigation of possible mechanisms, I examine treatment effects for groups of students whose intervention brochures contained images of (a) men and women, (b) women only, or (c) men only. Table 6 reports treatment effects for each term or year by treatment arm: mixed-gender imagery (N = 1,295), all-female imagery (N = 924), or all-male imagery (N = 584). University administrators limited the size of the sample of students receiving brochures with images of only men or only women to avoid perpetuating gender stereotypes about technology. While more appropriate from an ethical perspective, this strategy undermined the statistical power of the analysis, particularly for the all-female and all-male imagery groups. 8 As interaction terms further constrain statistical power, they are limited in their ability to shed light on gender-specific differences in enrollment, where effect sizes are small. For this reason, I will focus on Columns 5 and 6, where treatment effects are large—3 to 6 percentage points—in comparison with the relatively small baseline proportion of students selecting a technology major.
Summary of Treatment Effects by Brochure Imagery
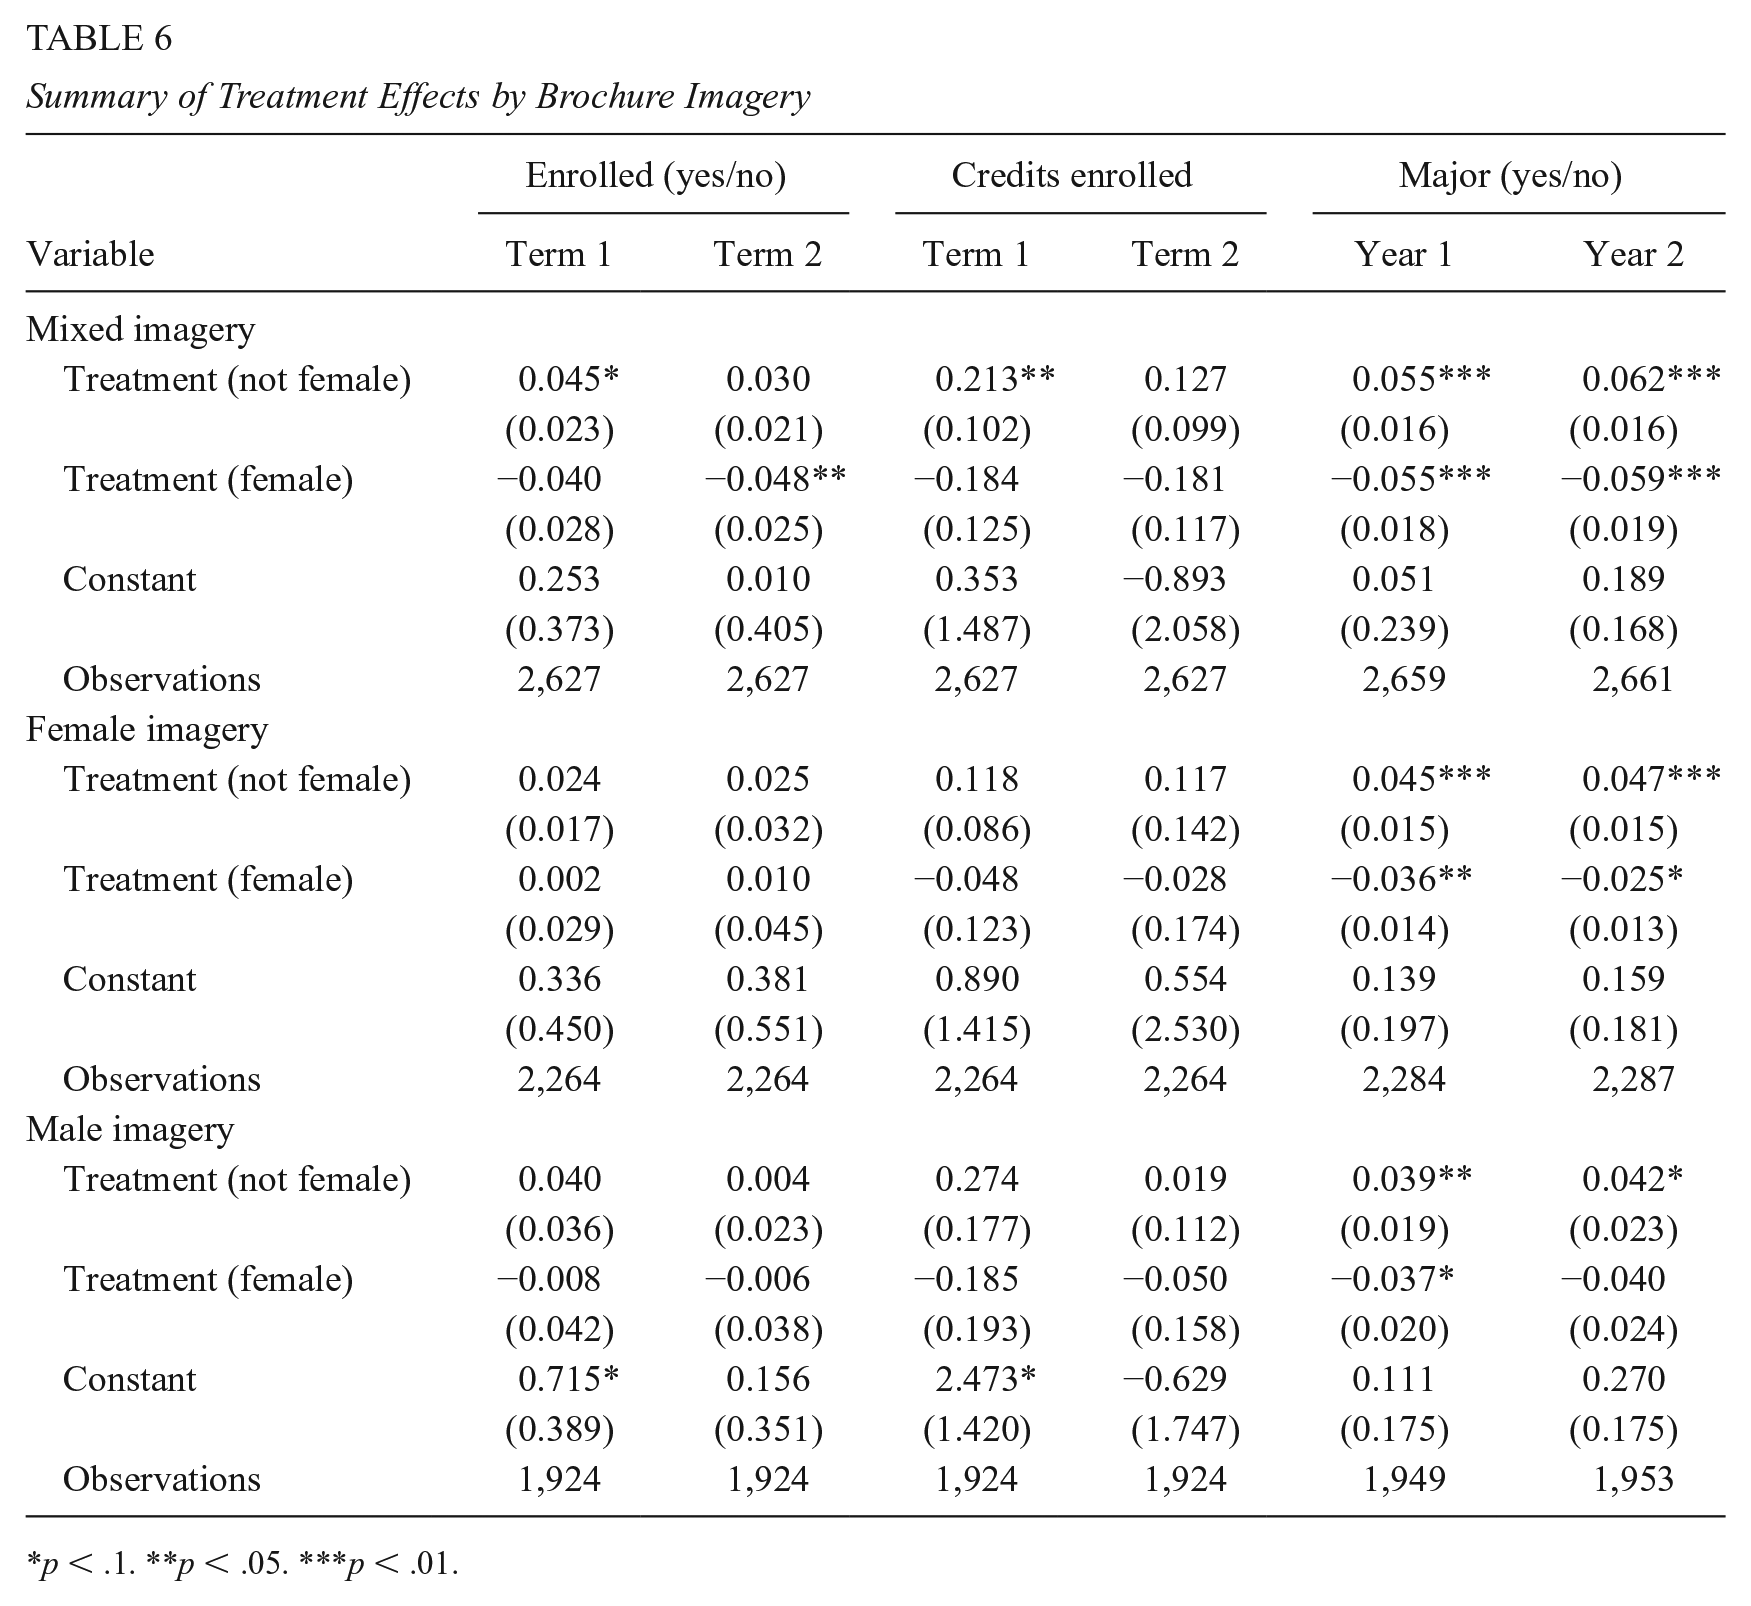
p < .1. **p < .05. ***p < .01.
In each panel of Table 6, students who received that particular brochure are compared with the control group (N = 1,377). There are small magnitude differences between brochures. The mixed imagery brochure increased technology major selection to the greatest extent, by 5.5 percentage points in the first year and 6.2 percentage points in the second year, among male/unknown students. It had no impact on female students’ major selection in the first year and a small, positive impact of 0.3 percentage points in the second year. For all brochures, female students were less likely than male/unknown students to choose a technology major. However, female take-up is highest and the gender gap is smallest for students who received brochures with all-female imagery. The female imagery brochure increased technology major take-up among women by 0.9 percentage points in the first year and 2.2 percentage points in the second year. This exploratory analysis suggests that the intervention’s effectiveness hinges on more than just information provision. Countering stereotypes with imagery, even through a brief intervention, has long-term consequences for academic choice.
Are new technology majors shifting from one STEM field to another or shifting from outside of STEM into STEM? To answer this question, I compared the proportion of majors for technology versus nontechnology majors within STEM, shown in Figure 3. The left panel shows the proportions of students that selected a technology or engineering major in each year by treatment group, whereas the right panel shows the proportions for nontechnology STEM majors—science and mathematics. As expected, there is a two- to three-point gap in technology major selection between the treatment and control groups.
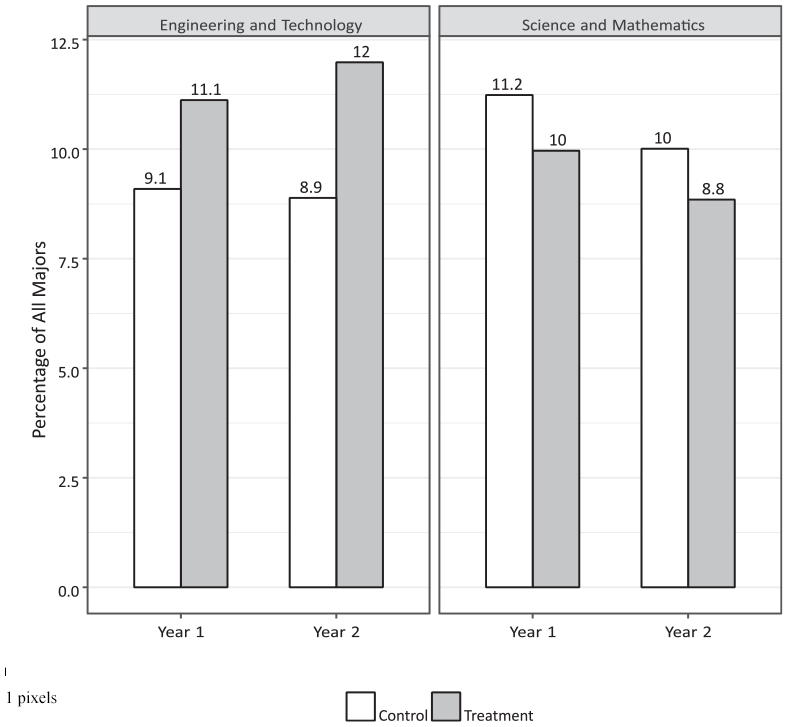
Percentage of student majors in technology and STEM. STEM = science, technology, engineering, and mathematics.
Examining just the control group (white bars) in each panel, technology and engineering majors make up 9% of all majors during the first 2 years, while science and math majors make up a higher proportion—10% to 11%. In contrast, the treatment group (gray bars) has the reverse pattern. Students in the treatment group are more likely to declare a technology major but less likely to declare a science or mathematics major. This suggests that a specific group responded to the intervention—students who would have declared a STEM major even without the intervention. Although some students shifted to technology from non-STEM majors, a considerable number students simply shifted from one STEM major (science) to another (technology).
Discussion
This study evaluates the impact of an advising intervention designed to increase women’s likelihood of developing technology skills and is also brief, low cost, and scalable. The intervention, consisting of structured information and advisor encouragement, led to increases in both technology course enrollment and major selection among both male and female students. Students in the treatment group were more likely to enroll in a technology course during their first semester, but not during their second. This is to be expected, since informational nudges are most impactful when they disrupt the typical decision-making process. The intervention’s effect on major selection persisted over time, an indication that these students remained technology majors. This is a significant finding, since students utilize information about their performance over time to make a more informed choice of major, and a third of STEM students typically switch to different majors. The research design has strong external validity due to its large sample of more than 4,000 students from diverse backgrounds. The intervention’s essential features—targeting students’ early enrollment decisions through academic advising—can be applied in many university settings.
As institutions seek to address underrepresentation, choice architecture may provide a viable alternative or complement to existing interventions. However, the effects of a such an intervention may depend on each institution’s student body, academic offerings, and enrollment processes. Although the intervention’s design targeted women, men were much more likely to respond to the intervention. The intervention increased women’s participation, particularly among students who received brochures with all-female imagery, but led to an increase in the gender gap. Therefore, institutions seeking to increase the overall share of women in technology may need to specifically target women and use imagery and messaging that appeals to them.
Students who declared technology majors in response to the intervention were more likely to be shifting from other STEM fields rather than from other popular majors from business, social science, or arts and humanities fields. These students have already demonstrated their preference for STEM and are more likely to be prepared to succeed. As women already comprise a large share of science majors, the intervention might be more effective at reducing the gender gap if it targeted women with an expressed interest in the sciences.
Given the length of time between the intervention and students’ major declarations, the gender gap in technology major selection may be explained by gendered patterns of attrition. The same factors that drive gender gaps in participation also shape persistence (Shapiro & Sax, 2011), including women’s sense of belonging in technology occupations (Lewis et al., 2017) and their confidence levels (Brainard & Carlin, 1998), which tend to decline over time. Their performance and experiences in technology courses also influence their persistence. Women are particularly sensitive to their first-year grades (Allen & Robbins, 2008; Green & Sanderson, 2018; Katz et al., 2006; Ost, 2010) and are less likely to persist without meaningful peer and instructor interactions (Barker et al., 2009; Green & Sanderson, 2018; Powell, 2008; Price, 2010).
Over the longer term, institutions may need to combine an intervention like the one described in this study with other efforts to support women’s persistence in STEM. For example, Carnegie Mellon University’s School of Computer Science modified admissions criteria as well as the first-year curriculum to reduce bias favoring students with more programming experience, typically men. From 1995 to 2000, the proportion of women among students entering the computer science degree program increased from 7% to 42% (Margolis et al., 2000). In another example, Harvey Mudd College, a small liberal arts college emphasizing science and engineering, implemented a set of changes that were associated with an increase in the proportion of women among computer science majors from 12% to 40% over a 4-year period (Alvarado et al., 2012). The college first shifted the focus of the first-year curriculum from programming to the breadth and contributions of the field. It also required all students, regardless of major, to take and pass a computer science course. To support women further, Harvey Mudd provided freshman women with research experience during the summer prior to their sophomore year, and sponsored a number of women to attend the annual Grace Hopper Celebration of Women in Computing (GHC).
Since Carnegie Mellon University and Harvey Mudd College are highly selective and STEM-focused, large gains in the proportion of women among computing majors may reflect the fact that women admitted to these institutions are more likely to be interested in technology than the general population of college women. In addition, the timing of the interventions, which primarily take place after students enroll in technology classes, may aid in retaining women already pursuing a technology pathway, rather than increasing participation among women who would prefer to study technology but are deterred by stereotypes or a lack of information. These interventions are also large in scope, costly, and difficult to scale. For example, it may not be feasible for a large, publicly funded university to adopt computer science as a required course for all students. Publicly funded institutions might face difficulties justifying such high-cost interventions as consistent with their broader educational mission.
This research demonstrates an important tradeoff. The interventions that produce the largest gains are hardest to implement and benefit a small number of students. In contrast, the advising intervention is brief, low cost, scalable, and effective, but its impacts are smaller and may increase gender disparities if not appropriately targeted. Institutions must assess the needs of their student body, but the broadest impacts are likely to come from combining low-cost changes to the choice architecture with more costly yet meaningful interventions that support women’s persistence over time.
Supplemental Material
sj-pdf-1-epa-10.3102_01623737241228278 – Supplemental material for The Effects of Information Provision on the Gender Gap in Technology: Experimental Evidence From Course Enrollment and Major Decisions
Supplemental material, sj-pdf-1-epa-10.3102_01623737241228278 for The Effects of Information Provision on the Gender Gap in Technology: Experimental Evidence From Course Enrollment and Major Decisions by NaLette Brodnax in Educational Evaluation and Policy Analysis
Footnotes
Acknowledgements
The author wishes to thank Ashlyn Nelson, Sean Nicholson-Crotty, Maureen Biggers, Sarah Reber, Nora Gordon, Ryan Harrison, and the anonymous reviewers for helpful feedback.
Data Availability Material
This study includes de-identified data from an ongoing study of human subjects. The data are available by request from the author’s Dataverse (Brodnax, 2019).
Declaration of Conflicting Interests
The author(s) declared no potential conflicts of interest with respect to the research, authorship, and/or publication of this article.
Funding
The author(s) received no financial support for the research, authorship, and/or publication of this article.
Ethical Approval
The Institutional Review Board at Georgetown University approved this study for research on human subjects under Protocol #00002090.
Notes
Author
NALETTE BRODNAX, PhD, is an assistant professor at Georgetown University. Her research focuses on education policy, policy diffusion, and computational social science.
References
Supplementary Material
Please find the following supplemental material available below.
For Open Access articles published under a Creative Commons License, all supplemental material carries the same license as the article it is associated with.
For non-Open Access articles published, all supplemental material carries a non-exclusive license, and permission requests for re-use of supplemental material or any part of supplemental material shall be sent directly to the copyright owner as specified in the copyright notice associated with the article.