
Abstract
A growing literature measures the impact of education interventions in low- and middle-income countries on both access and learning outcomes. But how should one contextualize the size of impacts? This article provides the distribution of standardized effect sizes on learning and access from 234 studies in low- and middle-income countries. We identify a median effect size of 0.10 standard deviations on learning and 0.07 standard deviations on access among randomized controlled trials. Effect sizes are similar for quasi-experimental studies. Effects are larger and demonstrate higher variance for small-scale studies than for large-scale studies. The distribution of existing effects can help researchers and policymakers to situate new findings within current knowledge and design new studies with sufficient statistical power to identify effects.
Introduction
In this article, we present the distribution of effect sizes from 234 studies in low- and middle-income countries that evaluate the impact of educational interventions on students’ access to schooling or on students’ learning in school. We further provide the distribution of effect sizes across different study designs (randomized controlled trials [RCTs] vs. quasi-experimental studies), the scale of the study, and the specific learning outcome (e.g., math vs. reading). This distribution of effects provides researchers with a simple way to situate impacts of new studies relative to what is known about how to expand access and increase learning. It also anchors expectations about the impact of future interventions. The current distribution of effect sizes does not rule out dramatically larger effect sizes of innovative education interventions in the future, but it does help researchers and policymakers to understand what a dramatically larger effect size would be.
Specifically, we draw on a large database of 138 RCTs and 96 quasi-experimental studies with learning or access outcomes, primarily obtained from previous reviews of education in low- and middle-income countries. We then standardize effect sizes across studies. We find that across the 96 of 138 RCTs that report learning outcomes (math or reading), the median effect size is 0.10 SDs, with a 25th percentile of 0.01, a 75th percentile of 0.23, and a 90th percentile—to give the reader a sense of what a large effect size looks like—of 0.45 SDs. (In his work in high-income countries, Kraft, 2020, also identifies a median impact of 0.10 SDs across education interventions.) Studies with a sample size in the bottom quartile report point estimates that are on average almost 3 times the size of studies with a sample size in the top quartile: 0.27 SDs versus 0.10 SDs. For access outcomes (i.e., enrollment, attendance, and dropout), the median effect size is 0.07 SDs across 73 RCTs, with a 25th percentile of 0.02, a 75th percentile of 0.14, and 90th percentile of 0.30 SDs. The distribution of access effect sizes is similar whether the outcome is enrollment or attendance. Our sample of quasi-experimental studies shows a similar pattern of results.
This distribution of effects contrasts with the benchmarks proposed by Cohen (1969). Those effect sizes were developed based on a small sample of social psychology lab experiments in the United States in the 1960s, mostly with undergraduate students (Kraft, 2020), so their relevance to impact evaluations in basic education today is questionable, even more so in low- and middle-income countries.
This study contributes to the growing body of synthesis work on the impact of education interventions in low- and middle-income countries (Evans & Popova, 2016; Kremer et al., 2013; Snilstveit et al., 2015), as well as to work seeking to characterize how large the impact of education interventions is relative to benchmarks such as the amount of learning usually gained during a year of schooling (Evans & Yuan, 2019) or the difference in learning levels between rich and poor countries (Angrist et al., 2020; Filmer et al., 2020).
Data and Analysis
We constructed a database of education impact evaluation studies to collect effect sizes. First, we draw on all studies included in 11 existing systematic reviews of education interventions in low- and middle-income countries. Then, we carry out a limited search to update the evidence that came out after those reviews were published, through early 2018. We detail our search, selection, and standardization processes in Supplemental Appendix A in the online version of the journal.
In brief, we include experimental and quasi-experimental evaluations of three types of programs. We include direct education interventions (such as teacher professional development or providing learning materials), and we include two other classes of interventions that commonly report educational outcomes: health interventions (such as providing deworming drugs and micronutrients) and safety net interventions (such as cash transfers). Studies also need to report at least one access outcome (e.g., enrollment, dropout, or attendance) or a learning outcome (e.g., literacy or numeracy). We focus on programs that took place in preprimary, primary, and secondary schools.
Our final analytical sample consists of 234 studies with 942 effect sizes from 51 low- and middle-income countries between 1981 and late 2017. Table 1 presents the summary statistics of our sample. Although our sample ends in late 2017, we find that effect sizes have remained consistent since 2006 (see Supplemental Appendix Figure B1 in the online version of the journal) suggesting that more recent studies are unlikely to be different.
Summary Statistics
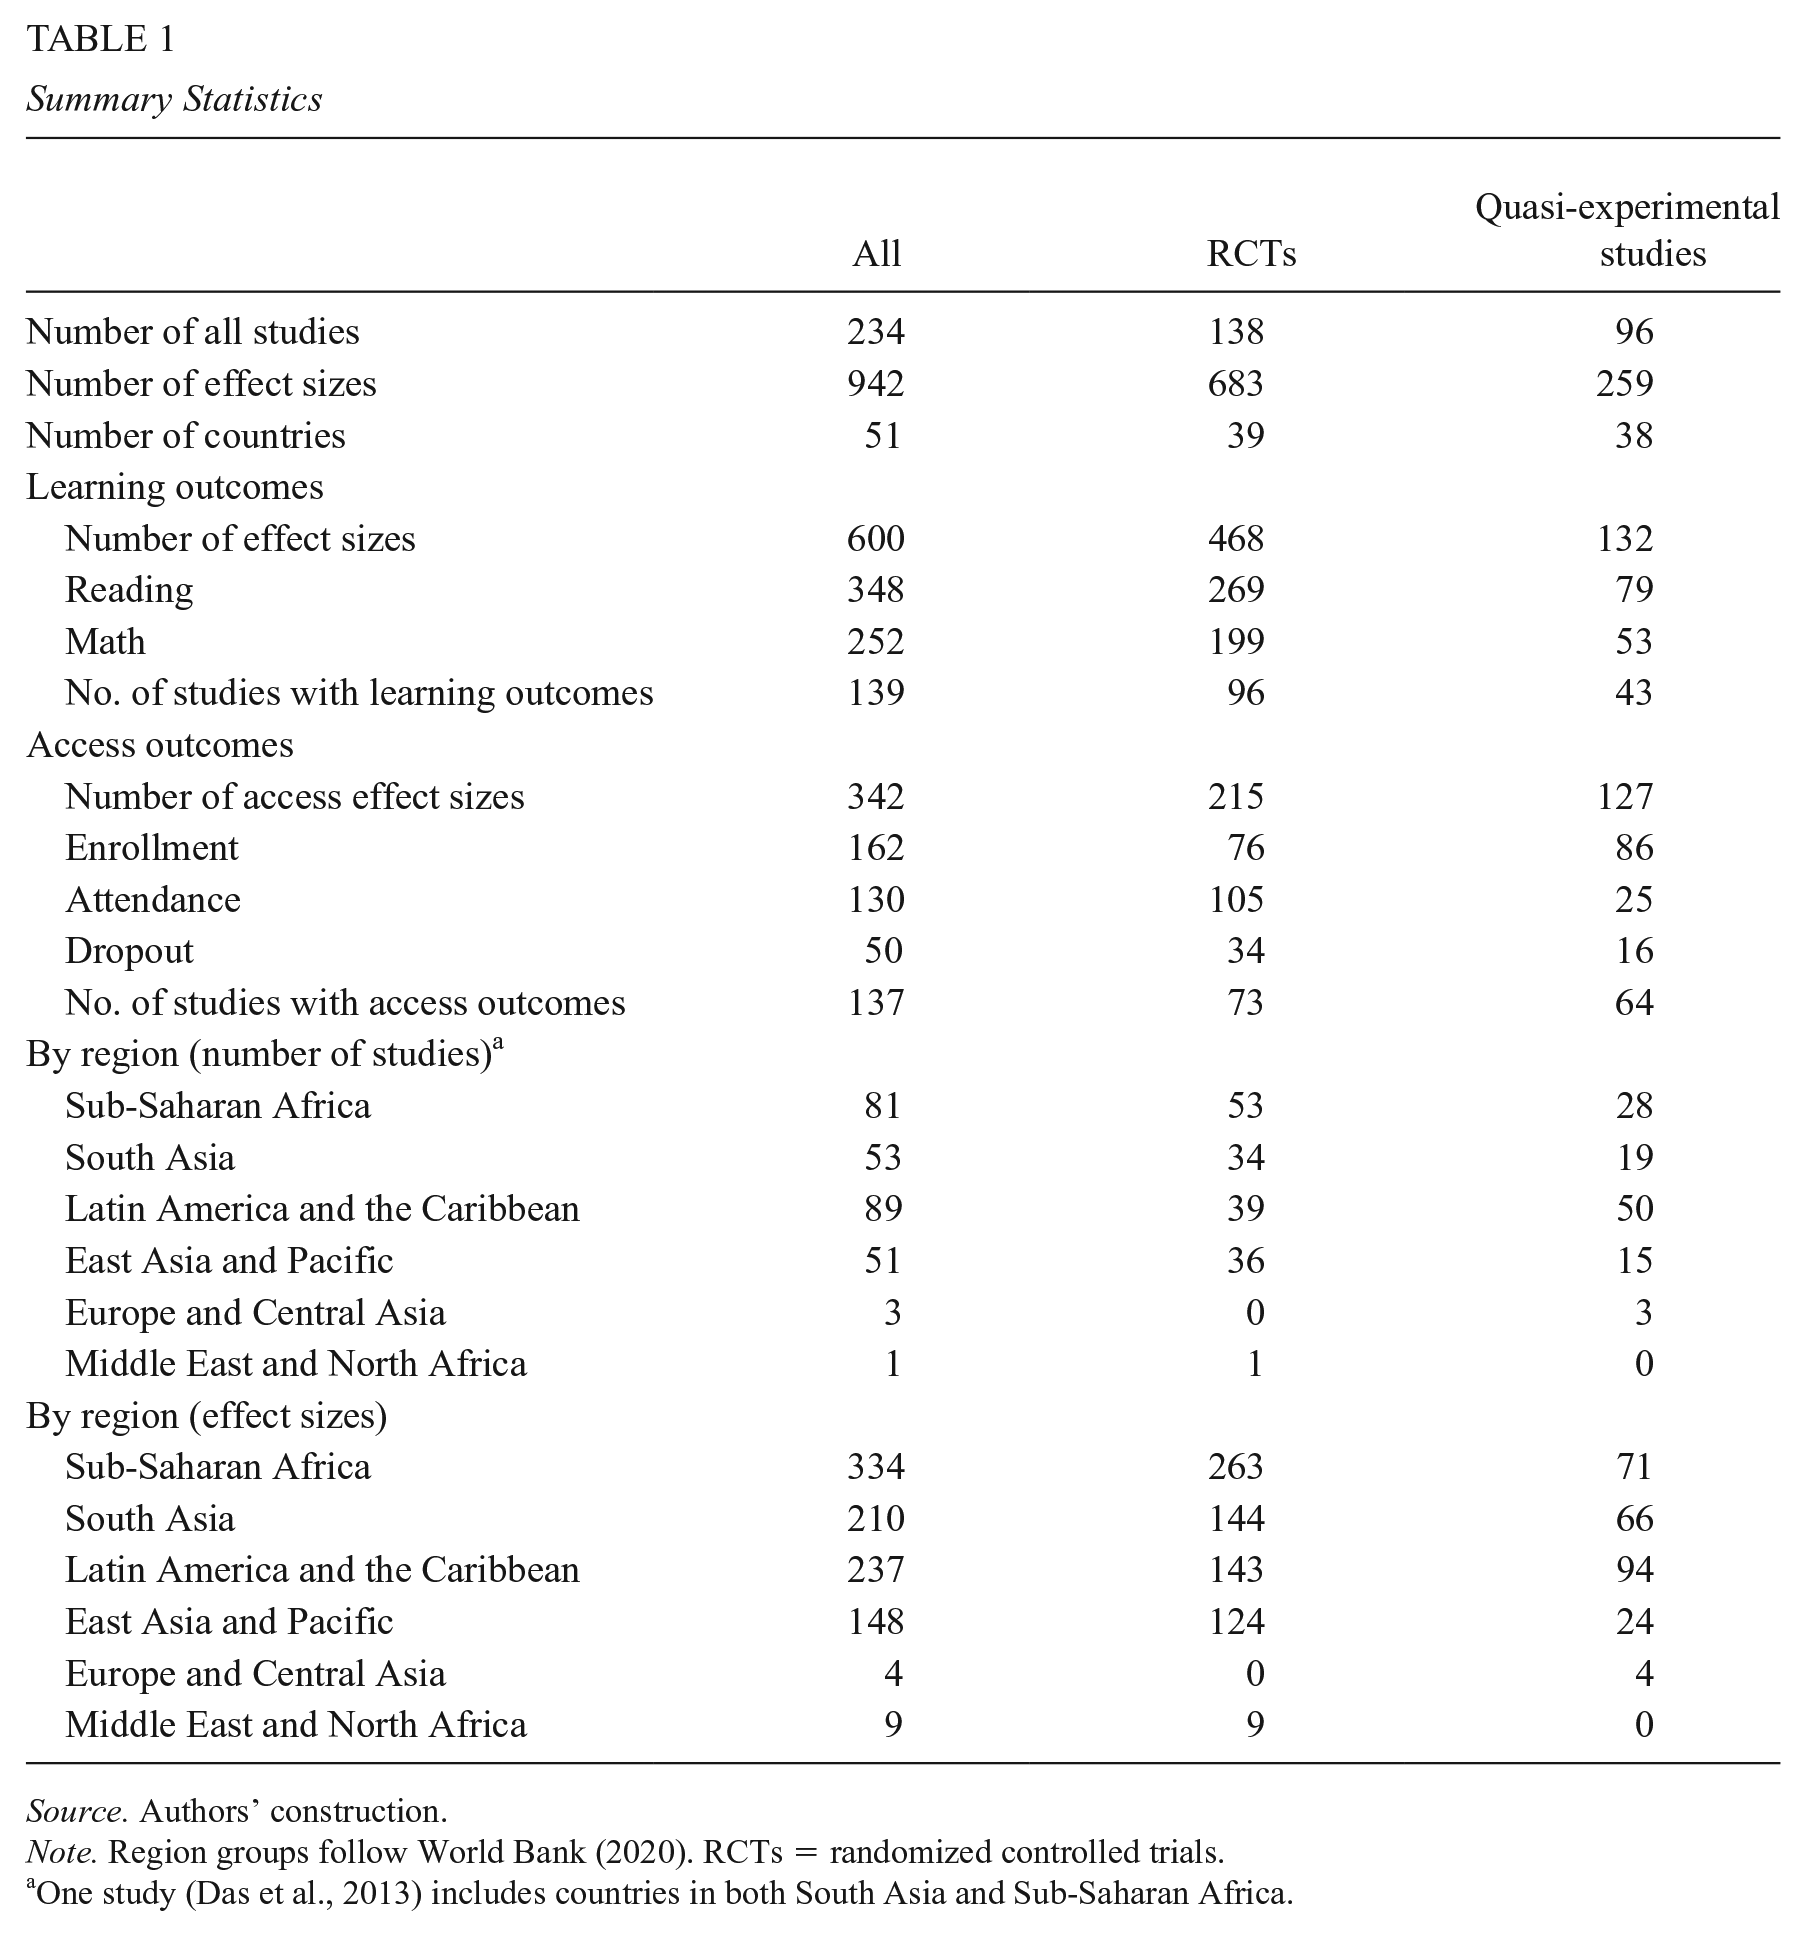
Source. Authors’ construction.
Note. Region groups follow World Bank (2020). RCTs = randomized controlled trials.
One study (Das et al., 2013) includes countries in both South Asia and Sub-Saharan Africa.
Our sample includes 683 effect sizes from 138 RCTs and 259 effect sizes from 96 quasi-experimental studies. We categorized measured outcomes into two broad types: learning (which includes test scores of reading and math) and access (which includes enrollment, attendance, and dropout). We report the absolute value of estimates of impacts on dropout rates, so that positive numbers are always associated with improvements. Sub-Saharan Africa has the largest number of effect sizes (334), whereas Europe and Central Africa (4) and Middle East and North Africa (9) have the fewest.
Results
Across the RCTs that measure reading or math outcomes, we find a median impact of 0.10 SDs (Table 2). The median impact is smaller for math assessments (0.07 SDs) than for reading assessments (0.14 SDs). For small studies with a sample size in the bottom quartile (under 732 participating students), median impacts are 0.23 SDs. For large studies, with a sample size in the top quartile (with more than 4,974 students), the median impact is a fourth of that, at 0.06 SDs. The variation is also higher among smaller studies. The distribution of impacts is comparable (if slightly smaller) for quasi-experimental studies (see Supplemental Appendix Table B1, Panel A in the online version of the journal), including the finding of larger impacts for the smallest scale studies and smaller impacts for the largest scale studies.
Distribution of Learning Impacts Across RCTs
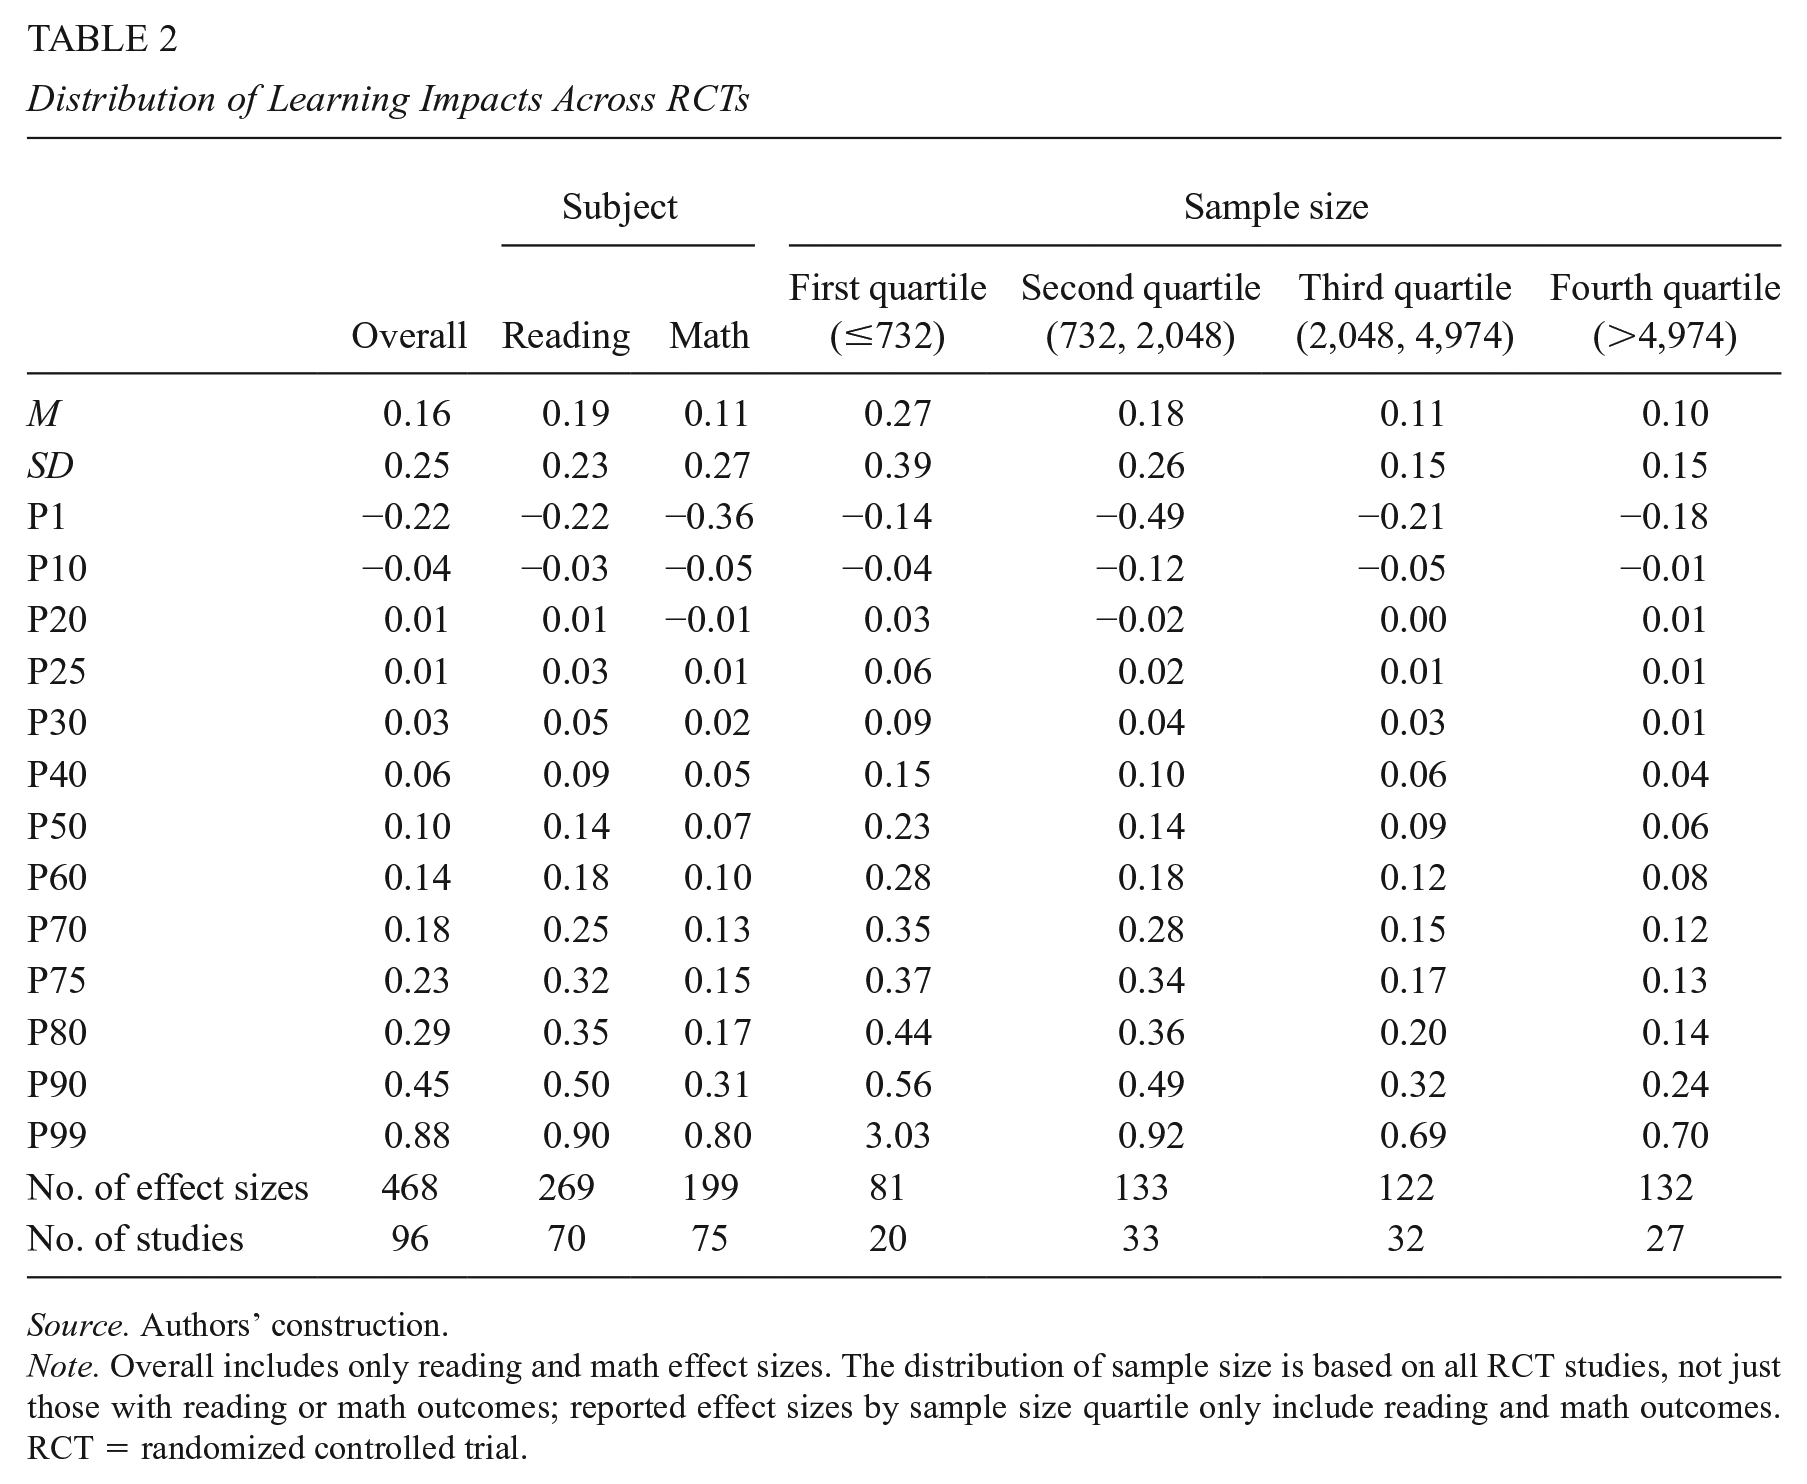
Source. Authors’ construction.
Note. Overall includes only reading and math effect sizes. The distribution of sample size is based on all RCT studies, not just those with reading or math outcomes; reported effect sizes by sample size quartile only include reading and math outcomes. RCT = randomized controlled trial.
For RCTs that report impacts on access, the median impact is smaller: 0.07 SDs (Table 3). Studies commonly report one or more of three access outcomes: enrollment (0.06 SDs), attendance (0.08 SDs), and dropout (0.05 SDs). The differences across outcomes are modest, but the slightly higher median for attendance may reflect greater ease in boosting student participation at the intensive margin than the extensive margin. The gap between small-scale and large-scale studies is similarly striking with access outcomes: For studies with a sample size in the bottom quartile, the median impact is 0.16 SDs, whereas for the largest studies (with a sample size in the top quartile), the median impact is just 0.05 SDs. Quasi-experimental studies again show slightly smaller effects and a similar pattern vis-à-vis the scale of the program (see Supplemental Appendix Table B1, Panel B in the online version of the journal).
Distribution of Access Impacts Across RCT Trials
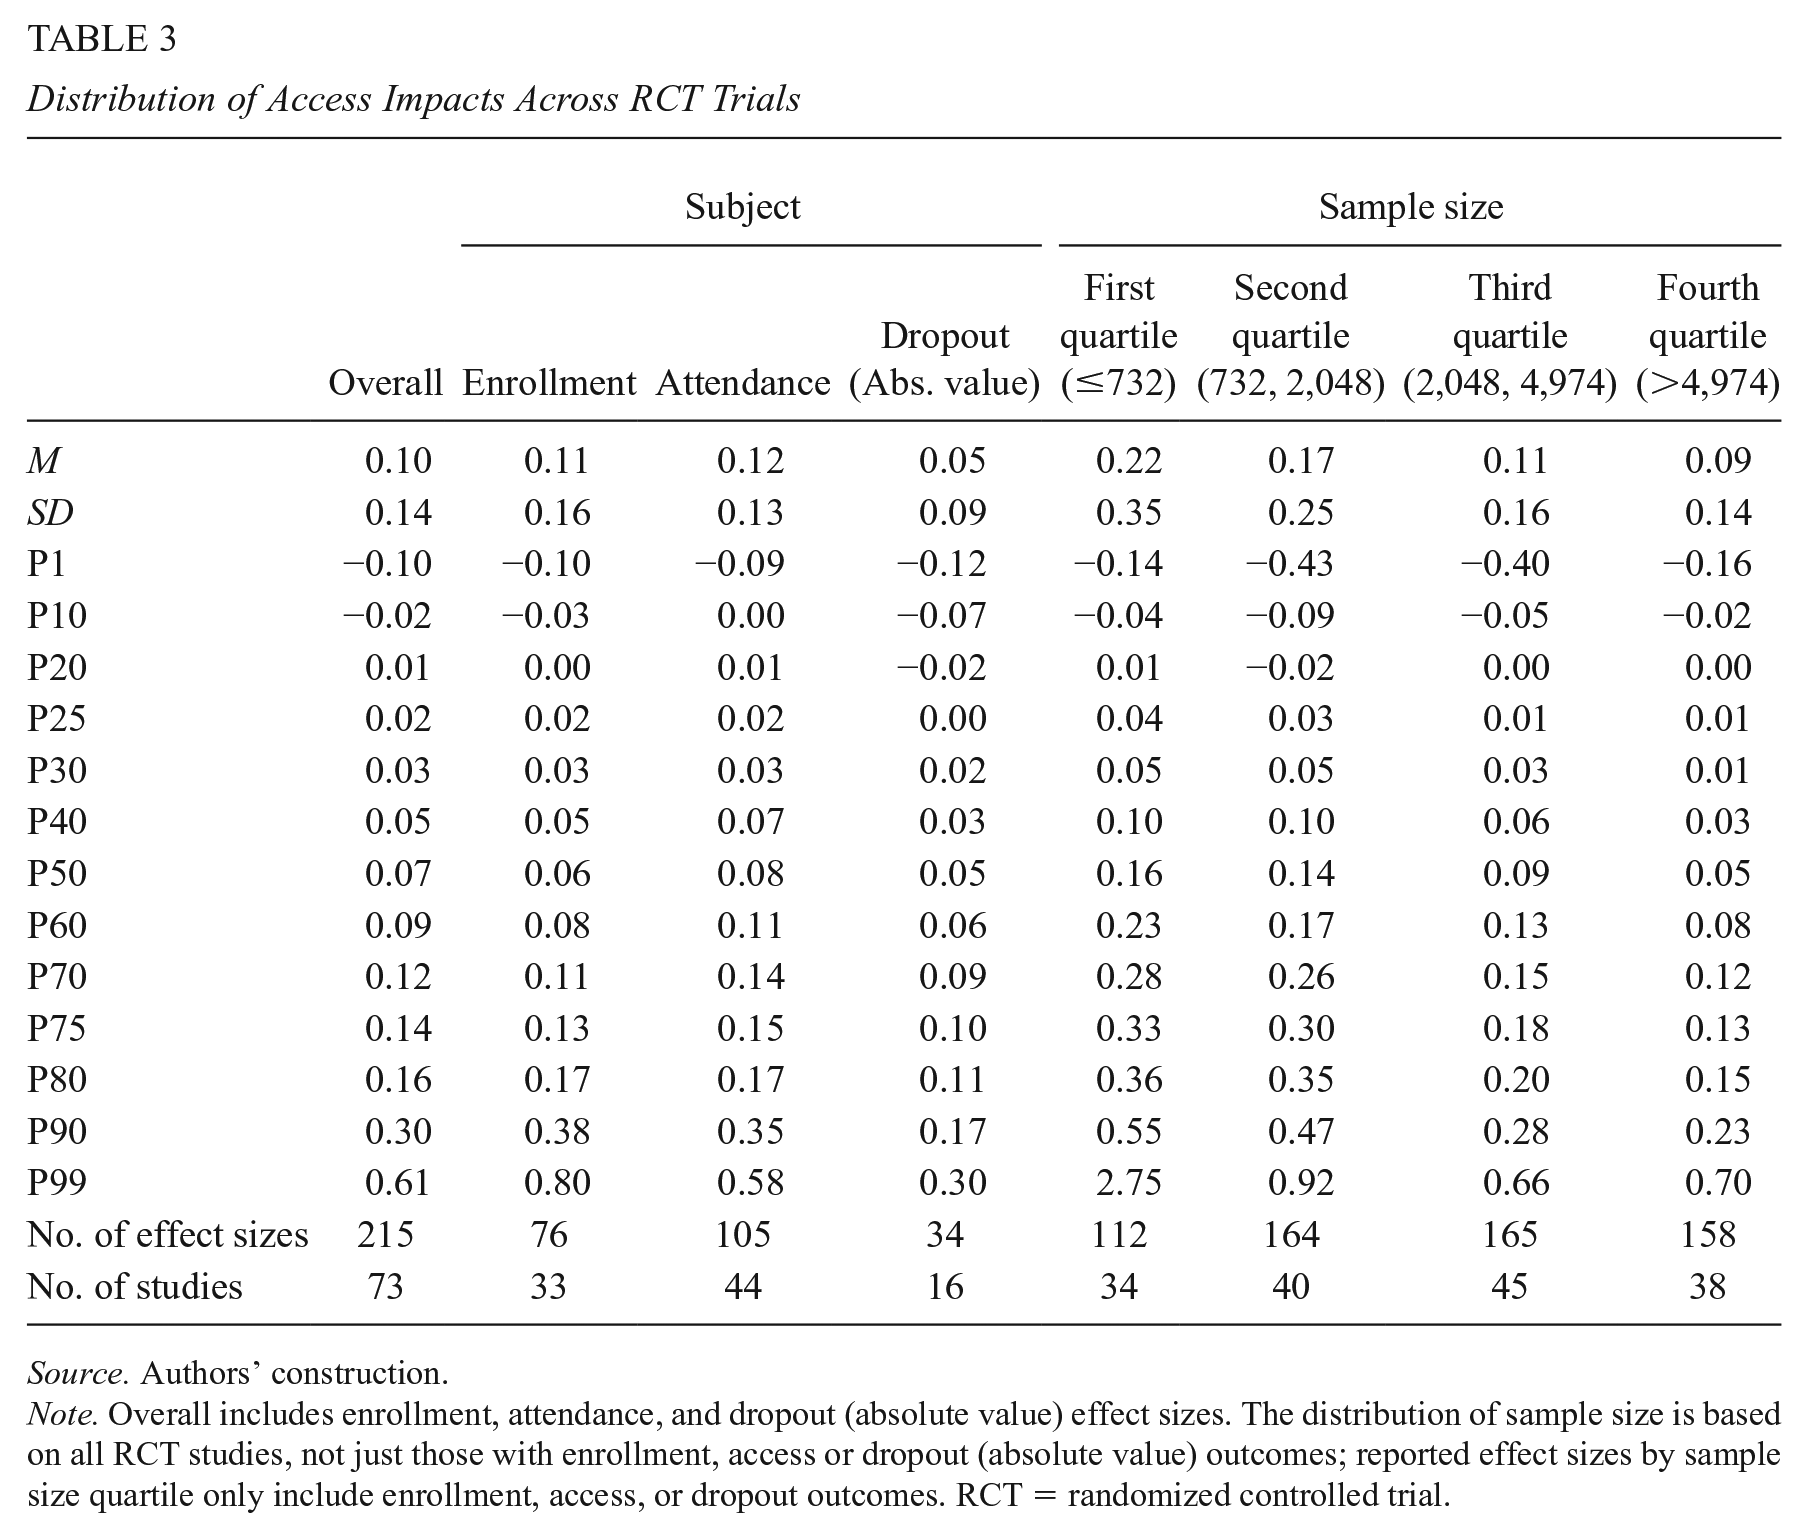
Source. Authors’ construction.
Note. Overall includes enrollment, attendance, and dropout (absolute value) effect sizes. The distribution of sample size is based on all RCT studies, not just those with enrollment, access or dropout (absolute value) outcomes; reported effect sizes by sample size quartile only include enrollment, access, or dropout outcomes. RCT = randomized controlled trial.
Standard deviations are not always comparable across studies. As Singh (2015a, 2015b) shows, standard deviations will vary both across populations and across classes of tests. Thus, comparing standard deviations across contexts and tests should be treated with caution. In this study, we divide tests by subject to increase comparability. (In our main results, we only include reading and math effects. Supplemental Appendix Table B2, in the online version of the journal, reports the distribution of effect sizes for other types of tests—for example, composite tests—although a lack of comparability across those tests makes those results more difficult to interpret.) Furthermore, tests vary by other characteristics: They may be administered orally or in written format, administered in a group or individually, multiple choice or open-ended, or focused on one specific domain of—for example—reading or mathematics (see Supplemental Appendix Table B3 in the online version of the journal). We find that test score impacts tend to be much higher for orally administered and individually administered tests; this may in part be a function of the administration format and may also be because tests of more basic skills, like letter recognition, tend to be administered to younger children and so require oral, one-on-one administration. Test score impacts are also double for multiple-choice tests than what they are for tests with open-ended questions.
We further examine the relationship between scale of intervention and effect size in the three countries in our sample with the most estimates from RCTs, to enhance comparability across populations: Kenya (117 estimates), India (115 estimates), and China (72 estimates). For access estimates, we observe a negative relationship for all three countries; it is statistically significant in Kenya and China (see Supplemental Appendix Figure B2 in the online version of the journal). For learning estimates, we observe a negative, statistically significant relationship for Kenya and China, with no clear correlation for India (see Supplemental Appendix Figure B3 in the online version of the journal). As reported earlier and in Tables 2 and 3, we also see higher variation in small studies (related to the phenomenon documented in Barrera-Osorio & Ganimian, 2016; Kane & Staiger, 2002). If there is stronger publication bias among smaller studies, with it being easier to publish significant positive impacts, then we could observe higher average effects for smaller studies simply because of publication bias. As a partial test for such publication bias, we compare the results in journal articles with those in other publications (working papers, conference papers, or other reports). We find broadly comparable effects (see Supplemental Appendix Table B4 in the online version of the journal): The median effect size for learning outcomes from RCTs in journals versus other publications is 0.09 versus 0.11; for quasi-experimental studies, the parallel numbers are 0.05 and 0.06. The pattern for access outcomes is similar. If publication bias does not drive these effects, then it may simply be that implementing pilots effectively is easier than implementing at-scale programs.
Finally, we examine whether there are apparent differences in the distribution of effect sizes across regions (see Supplemental Appendix Table B5 in the online version of the journal). We find, in the four regions with a reasonable sample of studies, both the most RCTs and largest median impacts on learning in Sub-Saharan Africa (0.13 SDs).
Discussion
In this article, we provide a distribution of effect sizes from studies that measure the impact of education interventions on learning and access in low- and middle-income countries. These data can help to situate future studies among the distribution of existing work. This is not a normative distribution. There is a large gap between student access and student learning in low-income countries versus high-income countries (Filmer et al., 2020), and one can reasonably argue that closing that gap will require either much larger effect sizes or a great many reforms that deliver effect sizes of the type that we observe.
Our finding that—among RCTs—effect sizes in the smallest studies are quadruple those in larger studies for learning and triple for access also encourages caution when policymakers encounter pilot results with impressive effect sizes. It is possible to improve both access and learning at scale, but usually the improvements are smaller than those observed in pilots. Alternatively, we cannot rule out that this effect is at least partly driven by selective publication bias.
Our analysis yields recommendations for researchers. First, because standard deviations are not always comparable across studies, benchmarking effect sizes against real-world metrics can enhance interpretation (Eble & Escueta, 2021). For example, a recent study of a public–private partnership for primary education in Liberia yielded an effect size of 0.16 SDs after3 years, which the authors emphasize is “equivalent to 4 words per minute additional reading fluency” (Romero & Sandefur, 2019). An early child intervention in Kenya increased children’s language and motor development by 0.1 SDs, which the authors highlight as the same as the difference between “children of primary-educated and secondary-educated mothers” (Jakiela et al., 2020). Second, many tests used in development studies are designed by the research team instead of using standardized tests, and little is reported about what exactly is measured. Developing comparable measures across studies will require greater reporting precision by researchers.
One limitation of this work is that we do not incorporate cost effectiveness, in part because a careful treatment of costs merits a full separate study of its own. Yet, the interpretation of an effect size is mediated by the cost of the intervention. Unfortunately, a minority of studies report cost effectiveness into their analysis and these studies may not be representative. An analysis of 76 RCTs in low- and middle-income countries found that nearly half reported no details on costs and most of the others had minimal information (McEwan, 2015). A more recent analysis of recent education research from Africa found that less than a third of studies reported cost effectiveness (Evans & Mendez Acosta, 2021). As more studies report cost data in comparable ways, future research may supplement this work with cost analysis.
Readers may be tempted to despair that impacts of interventions tested thus far have been so small. In response to that, first, we highlight that comparing the literacy skills of adults with different years of schooling in five low- and middle-income countries (Bolivia, Colombia, Ghana, Kenya, and Vietnam) suggests that students gain between 0.15 and 0.21 SDs of literacy during the course of a school year (Evans & Yuan, 2019). Using longitudinal data, Singh (2020) estimates larger impacts for a year of schooling, ranging from 0.35 to 0.40 SDs in Ethiopia and India to 0.75 SDs in Vietnam. Thus, a large effect on learning according to our distribution (e.g., larger than 0.23 SDs, or three quarters of the distribution) is the equivalent to how much a student might learn in more than a full year of business-as-usual schooling according to the Evans and Yuan (2019) estimates or between 58% and 66% of a year of schooling in Ethiopia or India according to the Singh (2020) estimates. Either way, these are substantive impacts.
Second, average effects can mask large effects for subsets of students. An average effect of 0.23 SDs (again, a large effect size) may mean that an intervention had no impact for three quarters of the students but an impact of 0.92 SDs for one quarter of students, which would be considered a success by virtually any metric (Gelman, 2020). As practical examples, a conditional cash transfer program with educational conditions reduced dropout rates by twice as much for students who were performing poorly at baseline in China (Mo et al., 2013) and increased enrollment by nearly twice as much for younger children in Burkina Faso (Akresh et al., 2013).
Third, there are programs that do have exceptionally large program impacts. For example, a literacy program that provided intensive training and materials to teachers in Uganda to help them teach literacy in children’s mother tongue increased reading scores by 0.64 SDs and writing scores by 0.45 SDs (Kerwin & Thornton, 2021). Scholarships to secondary school students in Ghana boosted enrollment by 0.56 SDs (Duflo et al., 2019). Providing take-home meals to students in Uganda, conditional on their attendance, boosted enrollment by 0.42 SDs (Alderman et al., 2012). These are all above the 90th percentile of the distribution of effect sizes. Interventions can and should aim to achieve large changes in learning and access, but it is important to understand the full distribution to understand the potential of existing educational interventions to close education gaps between high- and low-income countries.
Supplemental Material
sj-pdf-1-epa-10.3102_01623737221079646 – Supplemental material for How Big Are Effect Sizes in International Education Studies?
Supplemental material, sj-pdf-1-epa-10.3102_01623737221079646 for How Big Are Effect Sizes in International Education Studies? by David K. Evans and Fei Yuan in Educational Evaluation and Policy Analysis
Footnotes
Acknowledgements
The authors thank Lee Crawfurd, Susannah Hares, Matthew Kraft, Paco Martorell, Justin Sandefur, Eric Taylor, Eva Vivalt, and one anonymous referee for comments and Amina Mendez Acosta for research assistance.
Declaration of Conflicting Interests
The author(s) declared no potential conflicts of interest with respect to the research, authorship, and/or publication of this article.
Funding
The author(s) disclosed receipt of the following financial support for the research, authorship, and/or publication of this article: The Bill & Melinda Gates Foundation provided financial support.
Authors
DAVID K. EVANS is a senior fellow at the Center for Global Development. His research areas include education in low- and middle-income countries, teacher policy, and girls’ education.
FEI YUAN is a doctoral candidate at the Harvard Graduate School of Education who researches education policy in low- and middle-income countries, program evaluation, systematic review, and girls’ education.
References
Supplementary Material
Please find the following supplemental material available below.
For Open Access articles published under a Creative Commons License, all supplemental material carries the same license as the article it is associated with.
For non-Open Access articles published, all supplemental material carries a non-exclusive license, and permission requests for re-use of supplemental material or any part of supplemental material shall be sent directly to the copyright owner as specified in the copyright notice associated with the article.