
Abstract
This article examines the influence of teacher assistants and other personnel on outcomes for elementary school students during a period of recession-induced cutbacks in teacher assistants. Using panel data from North Carolina, we exploit the state’s unique system of financing its local public schools to identify the causal effects of teacher assistants, controlling for other staff, on measures of student achievement. We find consistent evidence of positive effects of teacher assistants, an understudied staffing category, on student performance in reading and math. We also find larger positive effects of teacher assistants on achievement outcomes for students of color and students in high-poverty schools than for White students and students in more affluent schools. We conclude that teacher assistants are a cost-effective means of raising student achievement, especially in reading.
Keywords
This article takes a new look at a perennial question in education: Do resources matter and, if so, which ones? Our perspective differs from that of most other studies in that we focus directly on staffing levels rather than on funding levels or teacher quality. We do so in the context of elementary schools in North Carolina. The idiosyncrasies of that state’s approach to funding schools make it possible for us to produce plausibly causal estimates of the effects of teacher assistants (TAs) on student outcomes.
The study builds directly on two literatures related to school finance and policy. One is the extensive literature on whether money matters. In the many early studies summarized by Hanushek (1986, 1997), researchers explore whether spending on teachers in the form of higher salaries for years of experience, master’s degrees or National Board Certification, or on larger numbers of teachers in the form of smaller class sizes pays off in the form of higher student outcomes, typically as measured by test scores. Hanushek’s work is the source of the common mantra that “money doesn’t matter.” But more recent work that makes use of funding changes induced by state school finance court cases challenges that conclusion and indicates a more positive role for additional funding (e.g., Hyman, 2017; Jackson et al., 2016). Moreover, other recent studies confirm positive effects of school funding, especially in the lower grades and often for students in disadvantaged communities (e.g., Chaudhary, 2009; Guryan, 2001; Papke, 2005).
A second smaller, but growing, body of literature focuses attention on expenditures for specific programs or nonteacher staffing within schools, such as health centers or social workers, and often looks at a broader set of outcome measures, including graduation rates, teen pregnancy, and grade retention (Carrell & Carrell, 2006; Lovenheim et al., 2016; Reback, 2010a).
Motivating the present study is the significant reduction in state-funded staffing levels for TAs in North Carolina that took place during the Great Recession and that have continued to the end of our study period. We exploit variation in staffing levels over the period 2001–2012 to estimate causal effects on student outcomes at the elementary level. Our main finding is that TAs enhance student performance in reading and math, with the clearest and most widespread effects on reading. We also find that TAs boost achievement outcomes more for traditionally underserved groups of students than for other students.
The article proceeds as follows. Section “North Carolina Context and School Funding” describes the North Carolina funding context and section “Key Staffing Categories” summarizes the relevant literature. We describe our data and methodology in section “Data and Method,” and present our results in section “Findings.” The article ends with a concluding discussion of the main findings in section “Summary and Discussion.”
North Carolina Context and School Funding
North Carolina has more than 10 million people distributed among several thriving metropolitan areas centered around cities such as Charlotte, Raleigh, Greensboro, and Winston-Salem in the middle of the state, as well as many poorer rural areas to the east and to the mountainous west. The state is relatively poor—at the end of our sample period, in 2012, it ranked 39th among the states in terms of average annual income and 12th in terms of its overall poverty rate. 1 Its instructional expenditures per pupil puts it at 39th in the nation and its average teacher salaries at 48th. 2 Nonetheless, in 2015, its students scored at or slightly above the national average on the National Assessment of Educational Progress. 3
Central to our research strategy is the state’s unusual system of funding its schools. Starting in 1933, and reinforced by policy actions in 1975, the state government has had responsibility for funding a “sound basic education” for all students. The state currently meets its responsibility by distributing funds to the state’s 115 school districts by allotments for positions or programs provided in three forms. These include position allotments for specific categories of personnel including teachers, dollar allotments for specific purposes including TAs, and categorical programs. Importantly, the personnel allotments to districts are generally used for the designated category of staffing although in various years, districts have been given some flexibility to move funds from one category to another, such as from TAs to teachers in Grades K–3.
The position allotments work as follows: The state uses formulas to allocate positions (not dollars) to districts in the form of slots for specific categories of staff such as teachers, school leaders, and various types of support personnel including social workers and school counselors largely based on district-level student enrollments, as measured by average daily membership. The allocation formulas are detailed and clear. For example, for the year 2009–2010, the state provided funds to cover one teacher per 18 students in Grades K–3 and one teacher per 22 students in Grades 4–6. 4 For each of the major staffing categories, districts have an incentive to use all the slots in the designated manner and to hire the most qualified people they can recruit, irrespective of salary level, because the state pays the staff according to a statewide salary schedule. Employing higher salaried teachers thus places no cost burden on the local school or district. 5 For statewide budgetary purposes, the state predicts the costs of the slots based on the average statewide salaries per slot.
The primary funding for TAs differs in that it is based on dollar allotments to each district based on the number of pupils in the early grades (i.e., K–3). 6 The districts use this funding to hire TAs with salaries within a state-specified range. Recent budget documents make clear that districts cannot move dollars out of the TA allotment (Department of Public Instruction, North Carolina, 2018; Nordstrom, 2017); however, in some earlier years, districts were allowed to transfer a portion of TA funding to teacher slots if they chose to do so—but were not allowed to transfer funds into most other allotments, including those for technology, behavioral support, special education, or driver training. Districts can fund additional TAs out of other state grants, federal grants, or local funds.
The state does not adjust any of the base staffing allocations or TA allotments to take account of the differing conditions of the local districts. Instead, the state provides additional support to districts through a variety of categorical programs. The largest categorical programs are for “at-risk student services” and alternative schools, children with disabilities, vocational education, and supplemental funding for low-wealth districts. Smaller programs include funding for limited English proficient students and for small counties. A 2008–2009 analysis of the low-wealth funding program, which is distributed to 70 of the state’s 100 counties, found that 8% of that funding was used for TAs and 37.3% for teachers and instructional support (Highlights of the North Carolina Public School Budget, North Carolina Department of Public Instruction, 2010). Some of the other categorical programs, most notably the allotment for children with disabilities, were used for TAs.
School districts also receive funding from local counties and the federal government. Although the state is by statute responsible for funding a sound basic education, counties are allowed to supplement state funds. Over time, the local share has grown and in 2012, the final year of our sample, it was 24% (Public School Forum of North Carolina, 2012). In most cases, the counties are coterminous with the school districts but, largely as a historical anomaly, a few counties contain more than one district. 7 The locally elected school boards have to request funding from their county commissioners because they, not the school boards, have the power to levy taxes. Districts use most of the local revenues provided for education for two primary purposes—salary supplements to add to the amounts set by the state salary schedule for teachers, and funding for facilities. 8 Federal funds are targeted toward specific populations such as low-income or disabled students. The funds must be used for the purposes allotted and cannot be transferred. As of 2008–2009, 6.5% of total K–12 personnel in North Carolina were paid out of federal funds. One significant consequence of the allotment-based system of funding by the state of North Carolina is that districts are required to report staffing levels by category at the school level, not only for state-funded positions but also for positions funded by local counties or the federal government. As we elaborate further below, these detailed data serve as the basis for our analysis of the effects of staffing levels.
Key Staffing Categories
In our empirical models, we include four categories of staffing positions: regular teachers, TAs, health care providers, and a miscellaneous category that we refer to as “other staff.” We highlight in this section the literature on those four categories of staffing, with most attention to the literature on TAs. In our empirical models, we specify each category at the district level, aggregated across the set of elementary schools in our sample within a district, as the full-time equivalent (FTE) staff by type per student.
Teachers
Our measure of teachers is the number of positions identified as regular teachers divided by the total number of students in each district (in a given year). Although not specifically a measure of class size, because we do not link teachers and students to particular classrooms, changes in this measure within a district over time should closely relate to changes in class size. 9 Hence, the relevant literature for predicting the effects of such a change is the extensive literature on the association between class size and educational outcomes.
At a theoretical level, class size often matters because of interactions among peers in the classroom. As spelled out in a well-known article by Lazear (2001), instruction in the classroom is like a public good, but one in which negative externalities arise when the behavior of one or more students impedes the learning of their classmates.
The best-known and most credible evidence on how changes in class size affect student achievement comes from the Tennessee STAR class size reduction experiment in the 1980s. In this experiment, students in Grades K–3 who were randomly assigned to small classes (13–17 students) were compared with those in regular classes (22–25 pupils) and also to those in regular classes with a teacher’s aide. Krueger’s (1999) reanalysis of the experimental data, in which he corrects for nonrandom attrition, finds significant and sizable test score gains in the first year that pupils are in smaller classes and smaller but still positive gains in subsequent years as they progress through school. Notably the effects are larger for more disadvantaged students.
Other evidence from quasi-experimental studies that use a variety of strategies to isolate the causal effects of class size generate more mixed results. Hoxby (2000) finds no class size effects on student achievement in Connecticut; Angrist et al. (2019) find no effects in Israel; Rivkin et al. (2005) find small, but inconsistent, class size effects in Texas; and Cho et al. (2012) find small effects for students in Grades 3 and 5 in Minnesota. 10 Based on this literature, we would predict that more teachers per student (as a proxy for smaller class sizes) would improve the outcomes of disadvantaged students, with average effects on all students less clear. Unfortunately, the limited amount of within-district variation over time in the context of our preferred models constrains our ability to detect effects of teachers or of class size. Nonetheless, we include teachers in all our models to avoid the possibility that our estimates of the effects of TAs are confounded by class size effects.
TAs
Nationally, TAs account for close to 12% of the total elementary and secondary school labor force (U.S. Department of Labor, 2014). Most districts in the nation historically required that TAs have at least a high school diploma, but the educational requirements to serve as a TA differ across states, and often, as is the case in North Carolina, also across districts and schools. The 2002 federal No Child Left Behind Act (NCLB) raised the standard for TAs working in a Title I school (a school with at least 40% of its students qualifying for federal Title I funding), requiring them to have either 2 years of higher education or an associate’s degree and to work with a “highly qualified teacher.” About 70% of North Carolina’s districts have adopted this higher standard for TAs, with the other 30% implementing it just for their Title I schools. North Carolina does not require TAs to have any form of state professional license.
TAs perform a variety of roles in classrooms. These include preparing classroom activities, working on instruction with individuals and small groups, performing clerical tasks, managing student behavior, and helping to evaluate student work (Kerry, 2005). Using TAs in any of these roles has the potential to free up time for teachers to focus on their main task of teaching and to make it easier to differentiate instruction within classrooms. Further, the presence of a TA in a classroom has the potential to mitigate some of the negative externalities within a classroom highlighted by Lazear (2001). The precise mix of activities that TAs engage in differs from classroom to classroom depending on differences in teachers’ ability to make good use of their assistants and in the skills of the TAs themselves. The test-based accountability provisions of NCLB may have placed more pressure on TAs to participate directly in instruction, for which they may or may not be qualified.
The research on TAs is far more limited than that on teachers. Krueger (1999) concluded that the provision of a full-time teacher aide had modest and inconsistent effects on student achievement. In a reanalysis of the Tennessee STAR data, Gerber et al. (2001) found that teacher aides had little, if any, positive effects on students’ academic achievement, with the one exception being students who were in classrooms with an aide for 2 to 3 years. Nor did the authors find that any specific type of TA activity had an effect on student achievement. A thorough 2009 review of the literature on TAs mainly from the United States, England, and Wales suggests a more mixed and nuanced picture (Alborz et al., 2009a, 2009b). In particular, of the eight studies that examined the effects of TAs in primary schools on measures of literacy, seven “suggested that trained and supported TAs working on a one-to-one basis or in a small group can help primary-aged children with literacy and language problems to make significant gains in learning” (Alborz et al., 2009a, p. 2). Effects on math achievement were more mixed. Thus, one reasonable hypothesis is that TAs may be particularly helpful in attending to differentiated needs of students related to reading.
Recent and compelling evidence of the potential for positive effects of TAs emerges from a randomized trial of two types of teacher aides—those with and without teaching degrees—in sixth-grade classrooms in Denmark (Andersen et al., 2018). The authors find positive and significant intent-to-treat effects on test scores in reading, but not in math, with effect sizes larger for students from disadvantaged backgrounds. Although the effects were similar in magnitude across the two types of teacher aides, the authors speculate that the mechanisms differed. The aides with degrees functioned more like teachers and served, according to the authors, as a flexible form of class size reduction. The aides without degrees appeared to work more as parts of professional teams focused on reducing classroom behavioral problems and complementing pedagogical efforts by the lead teacher.
Overall, this literature suggests that TAs may have positive effects on student outcomes, with the test score effects likely to be larger for reading than for math, and larger for disadvantaged students than for other students. The absence of recent studies that are grounded in the U.S. context of strong pressure on teachers to meet test-based accountability standards represents a significant gap in knowledge. A primary aim of this article is to fill that gap by examining the relationship between arguably exogenous changes in the number of TAs and changes in student achievement in North Carolina.
Health Care Providers
Our measure of school-level health care providers is not as comprehensive as we would have liked. In practice, we define health providers as staff at the school level who are providing mental and allied health services, plus speech pathologists and audiologists. This group includes social workers (all of whom must have a degree in social work and be licensed by the NC Department of Public Instruction) but it excludes nurses because our data cover only about half of all school nurses in the state—those who are employed by local education agencies rather than other public agencies. Nor do we include school psychologists because school-level information on psychologists is not consistent over time.
According to state guidelines, the main task for all the health care workers is to reduce health-related barriers to learning that individual children bring to the classroom by attending to their mental and physical health needs. In addition, these professionals are charged with addressing broader health issues such as the control of communicable disease, and the creation of positive classroom and school environments. 11
Although the link between the general health of children and student achievement is relatively clear (Currie, 2009; Ding et al., 2009), little research exists on how, if at all, health professionals in schools might affect student achievement and other student outcomes. A major challenge for researchers is the difficulty of ruling out the reverse causation that would arise, for example, if such personnel were assigned to schools judged to be most in need. Recent studies of the introduction of school-based health centers indicate that they generate mixed effects on academic outcomes. One national study (Lovenheim et al., 2016) finds that their introduction substantially reduced teen birth rates but only slightly reduced high school dropout rates.
Other Staffing Categories
School-level data are also available on other categories of staff that could potentially generate higher levels of achievement or improvements in other student outcomes. These categories include school counselors, principals and other school leaders, and noncertified academic staff. 12 In North Carolina, school counselors are trained to incorporate the state’s Guidance Standard Course of Study through large and small group activities, focusing on students’ growth and development. 13 Two high-quality causal studies—one by Carrell and Carrell (2006) and the other by Reback (2010b)—both find positive effects of school counselors on student behaviors such as reduced disciplinary or weapons-related incidents, but neither finds any effects on student achievement, perhaps because of the temporary nature of the changes used to identify effects.
Similar arguments apply to the category of school leaders, such as principals. Principals influence staffing, curriculum, and climate, all of which may shape student achievement (Coelli & Green, 2012; Dhuey & Smith, 2014). However, within-district variation over time in leadership position allotments is, unsurprisingly, very limited over our period and thus not well-suited to function as a stand-alone staffing category in our analytic approach. As for noncertified academic support, which includes tutors, interpreters, therapists, and noncertified instructors, adding more staff could potentially have a more direct impact on student achievement, but we have chosen to treat that category the same way we treat school counselors and school leaders to retain the focus on teachers, TAs, and health personnel. All of our achievement models control for an aggregate of these three categories.
Data and Method
Our goal is to determine how each of our four staffing categories affects student achievement outcomes in math and reading in elementary school, with a primary focus on TAs. We begin with student- and school-level data that we aggregate to the district level from 2001 to 2012. This procedure generates 1,149 district-by-year observations. In each year, we include all public elementary schools in North Carolina with traditional grade configurations, defined as pre-K or K to Grade 5 or to Grade 6. 14 We exclude charter schools as well as schools with atypical grade configurations, such as Grades 4–8 or Grades K–8, which might require unusual staffing patterns. 15 As state-based allocations of staff are made to districts, the identifying variation we exploit operates at the district level, and thus we anchor our analysis at that level.
As we have explained, the state allocates slots (or dollars in the case of TAs) to districts and not to schools. Thus, districts in North Carolina, and by extension the schools under their authority, have staff that are funded from one of three sources: (a) the district itself through local revenues (e.g., property taxes), (b) the state government, and (c) the federal government. Districts are free to determine how many positions they choose to fund out of local revenue. In addition, they may also influence the number of federally funded positions through their decision of whether to spend federal funds on staffing versus other inputs such as curricula, as well as decisions about whether to apply for certain kinds of federal funding. Hence, neither the locally nor the federally funded positions are exogenous to the district. In contrast, local districts have little or no control over the basic state-funded positions or funding allotments which are determined by statewide policy decisions. We note, however, that many counties also receive additional state funding in the form of low-wealth and small county supplements that they may use to pay for positions at the school level, which are typically coded as state-funded positions. We control directly for these sources of aid in our modeling approach, below.
For each category of staff, we have school-level information on the number of (FTE) positions broken down by whether they are paid for by state, local, or federal funds. Figures 1 to 3 depict the number of positions in each of the three main categories per 100 students in elementary schools across our full analytic sample of districts. The figures illustrate that the state government funds the largest share of the staffing positions in each category. The recent decline in TAs largely reflects a combination of recession-related pressures on the state budget and subsequent policy decisions by the state legislature after 2010 aimed at reducing the size of government. In contrast, health care workers (as we measured them) have generally risen during the period perhaps partly as a response to the economic pressures on families related to the recession.
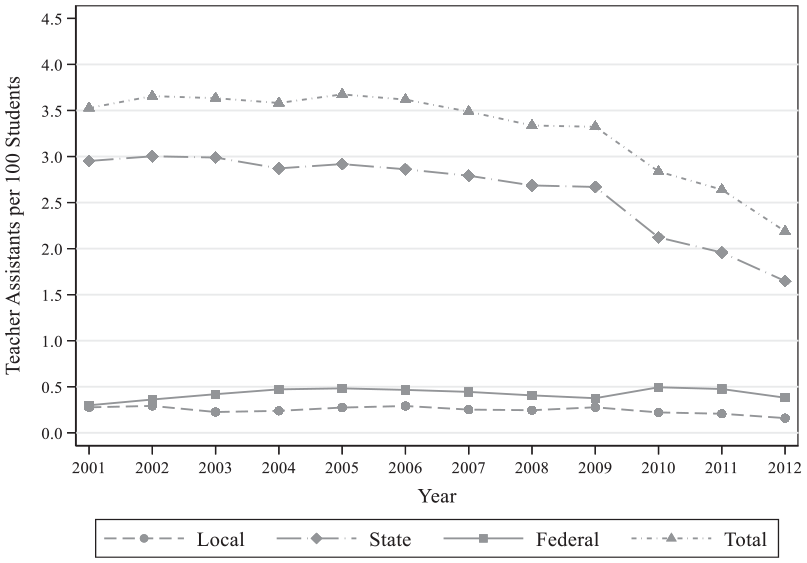
Teacher assistants per 100 students, 2001–2012.
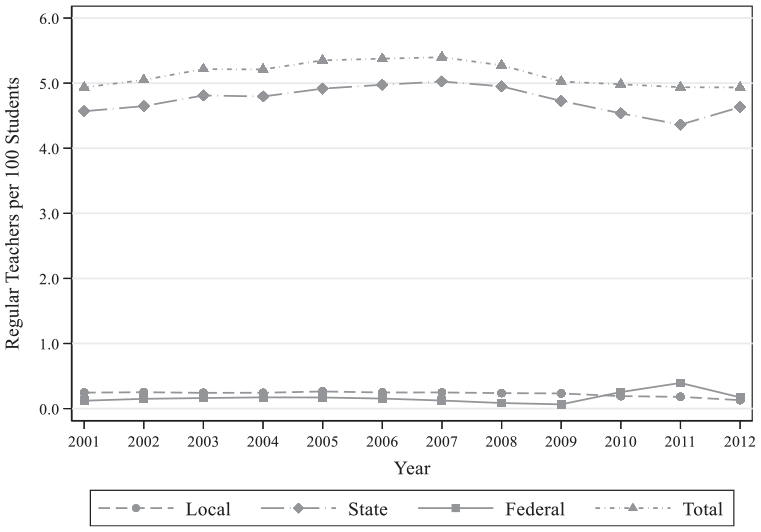
Regular teachers per 100 students, 2001–2012.
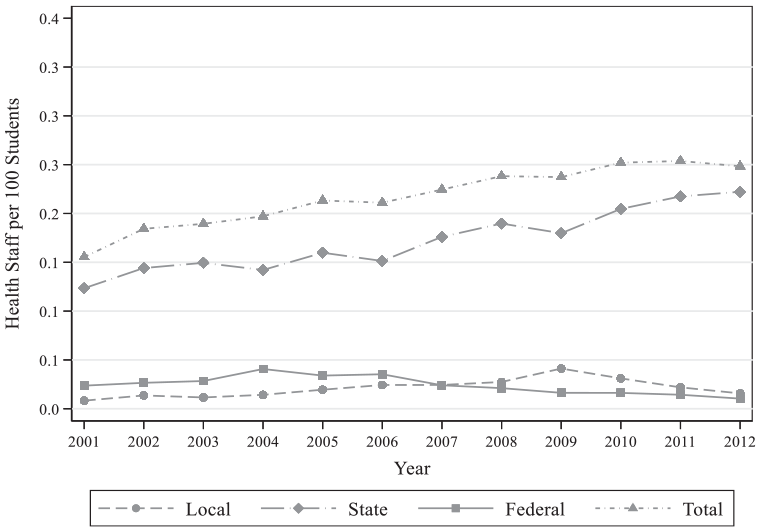
Health providers per 100 students, 2001–2012.
Districts vary in how they allocate state-funded positions among schools. Based on discussions with district officials, we found that some allocate slots on a strict per-pupil basis, whereas others use various allocation schemes that target slots across schools to give disadvantaged schools more resources. As our analysis is anchored at the district level, we view the within-district disbursement of staff across schools as part of the treatment effect of the plausibly exogenous shift in staffing levels associated with changes in state policy.
Empirical Approach
Our goal is to leverage changes over time in staff positions in each of the four categories to determine how staffing patterns affect student outcomes at the district level. Letting d denote the district and t denote the year, we write the basic model as:
where
As control variables, the model includes a vector
Nonetheless, concerns about bias may arise because any one of the staffing variables could potentially be correlated with the error term. That problem could occur, for example, if policymakers at any of the three levels of government determined staffing levels based on the performance of the district’s students. Although much of the state government’s basic staffing allotments are solely a function of district enrollment levels, that may not be true for staffing paid for by either the federal or local government.
Hence, we supplement the basic ordinary least squares (OLS) model of Equation 1 with a reduced-form (RF) version in which each of the four staffing variables is replaced by its state-funded component. This component is outside the control of district policymakers and, importantly, is not determined by district-specific factors that may correlate with student achievement. By purging the staffing variables of endogenous components that may be associated with local and federal decisions, this RF specification estimates “intent-to-treat” effects of state funding on student outcomes for each category of staffing.
In addition, we use a two-stage least squares (2SLS) approach to estimate the causal effect of additional staff (of a given type) on student achievement outcomes. By using district aggregates of staffing positions funded by the state as instruments in the first stage of the 2SLS setup, we once again purge the influence of most of the hard-to-measure factors that might shape both staffing levels and student outcomes. Our instrumental variables (IV), 2SLS approach takes the following form:
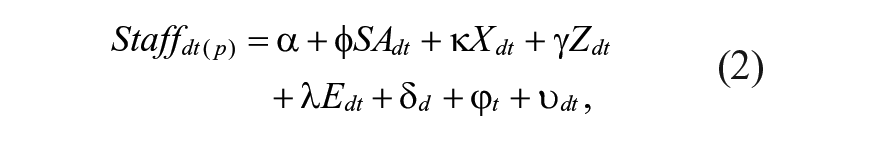
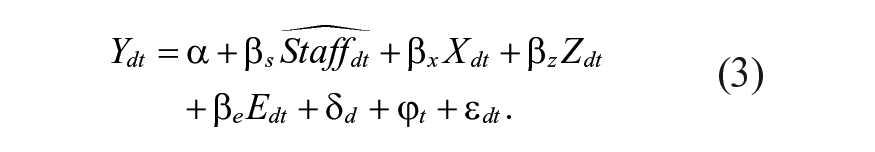
As there are four endogenous staffing variables, we estimate four first-stage models that take the form of Equation 2 with
Summary Statistics: Elementary Schools, 2001–2012
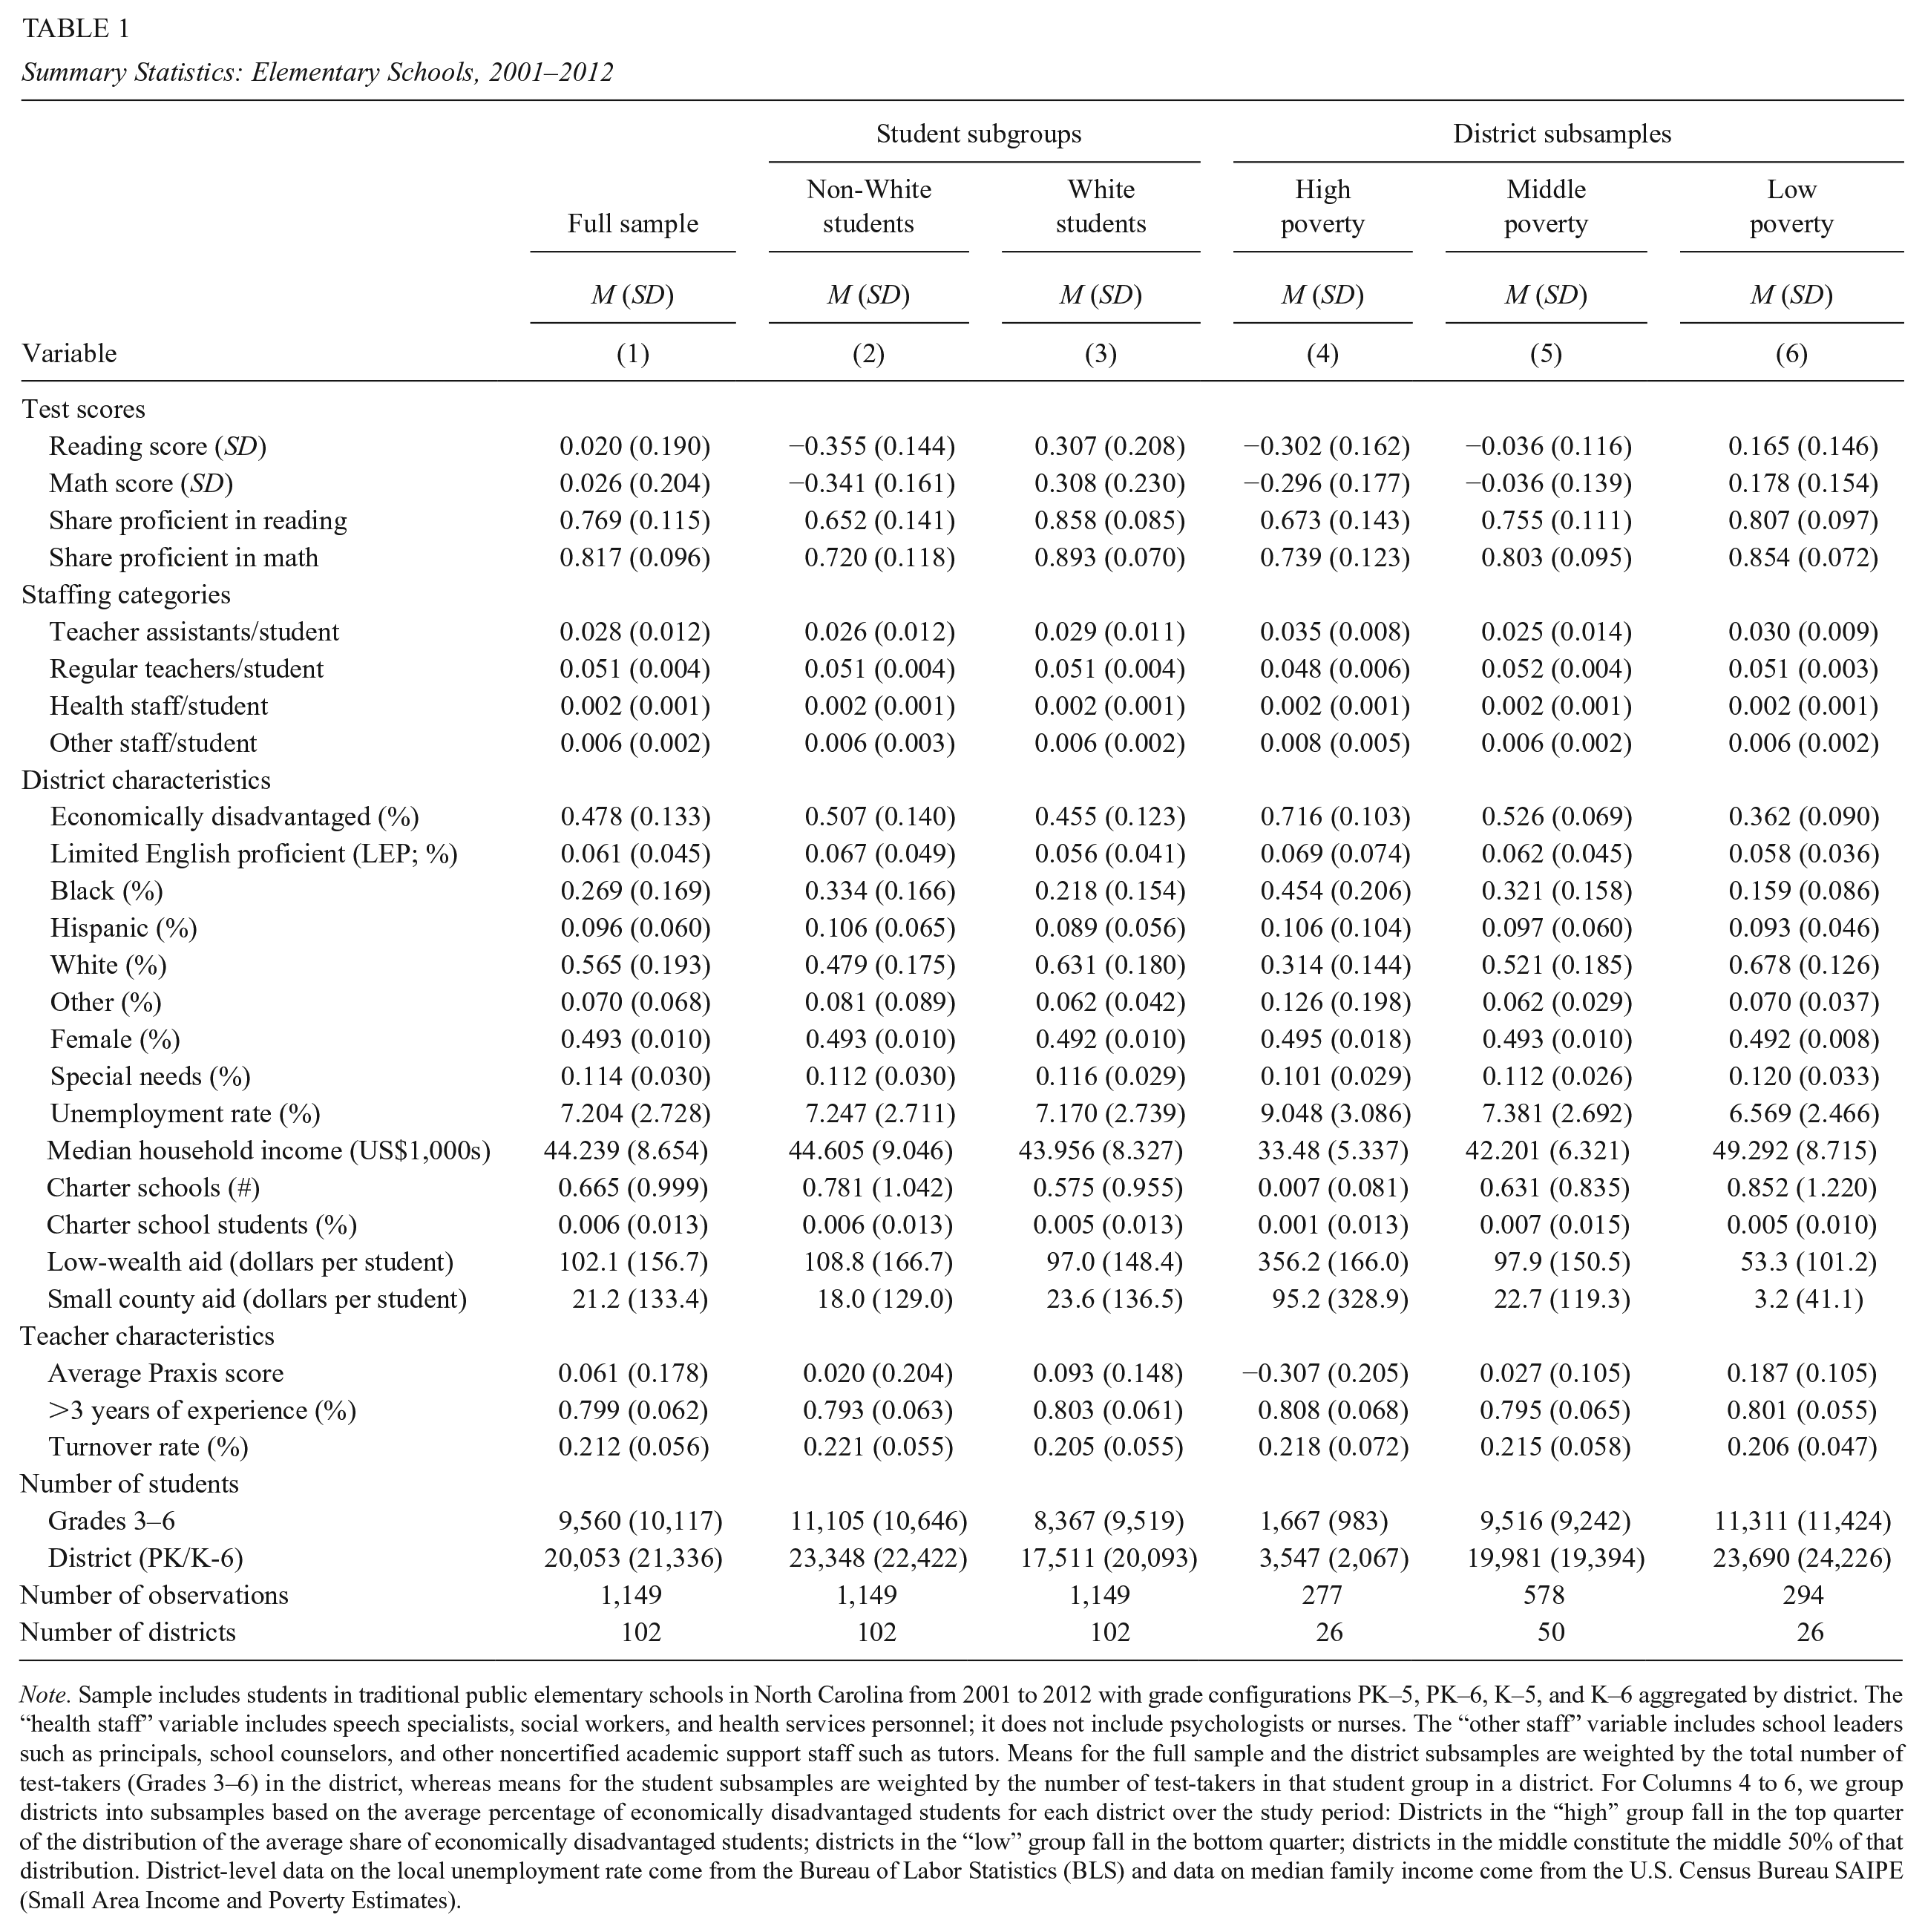
Note. Sample includes students in traditional public elementary schools in North Carolina from 2001 to 2012 with grade configurations PK–5, PK–6, K–5, and K–6 aggregated by district. The “health staff” variable includes speech specialists, social workers, and health services personnel; it does not include psychologists or nurses. The “other staff” variable includes school leaders such as principals, school counselors, and other noncertified academic support staff such as tutors. Means for the full sample and the district subsamples are weighted by the total number of test-takers (Grades 3–6) in the district, whereas means for the student subsamples are weighted by the number of test-takers in that student group in a district. For Columns 4 to 6, we group districts into subsamples based on the average percentage of economically disadvantaged students for each district over the study period: Districts in the “high” group fall in the top quarter of the distribution of the average share of economically disadvantaged students; districts in the “low” group fall in the bottom quarter; districts in the middle constitute the middle 50% of that distribution. District-level data on the local unemployment rate come from the Bureau of Labor Statistics (BLS) and data on median family income come from the U.S. Census Bureau SAIPE (Small Area Income and Poverty Estimates).
In all of our models including our 2SLS models, we weight observations by the number of test-takers (in Grades 3 to 5 or 6 as appropriate) in each district so that our estimated effects of staffing can be interpreted as average effects on students, not on districts. In addition, we cluster standard errors at the district level to address the potential for student outcomes in a district to be correlated over time. 17
This IV approach is based on two main assumptions. The first is that the exogenous, district-level aggregates of the state-funded positions are strong predictors of the total amounts of district-level staffing by staffing type. The first-stage results we report in Supplementary Table S1 in the online version of the journal corroborate that assumption.
18
The second is that changes in the number of state-funded staffing positions within districts over time influence outcomes such as student performance only through changes in staffing levels. This assumption is commonly referred to as the exclusion restriction and can be thought of in two related parts (Angrist & Pischke, 2009). The first is that the instrument is as good as randomly assigned. We provide evidence of the plausibility of this assumption in Table 2 in which we regress lagged measures of achievement and demographic characteristics on our instruments. Overall, we fail to detect meaningful associations between these measures and our instruments, assuaging concerns that state-funded staffing flows may be correlated with prior patterns of student achievement or shifting sociodemographic characteristics of districts.
19
Moreover, in all our specifications, we directly control for a range of time-varying student characteristics
Assessing the Validity of the Instrument
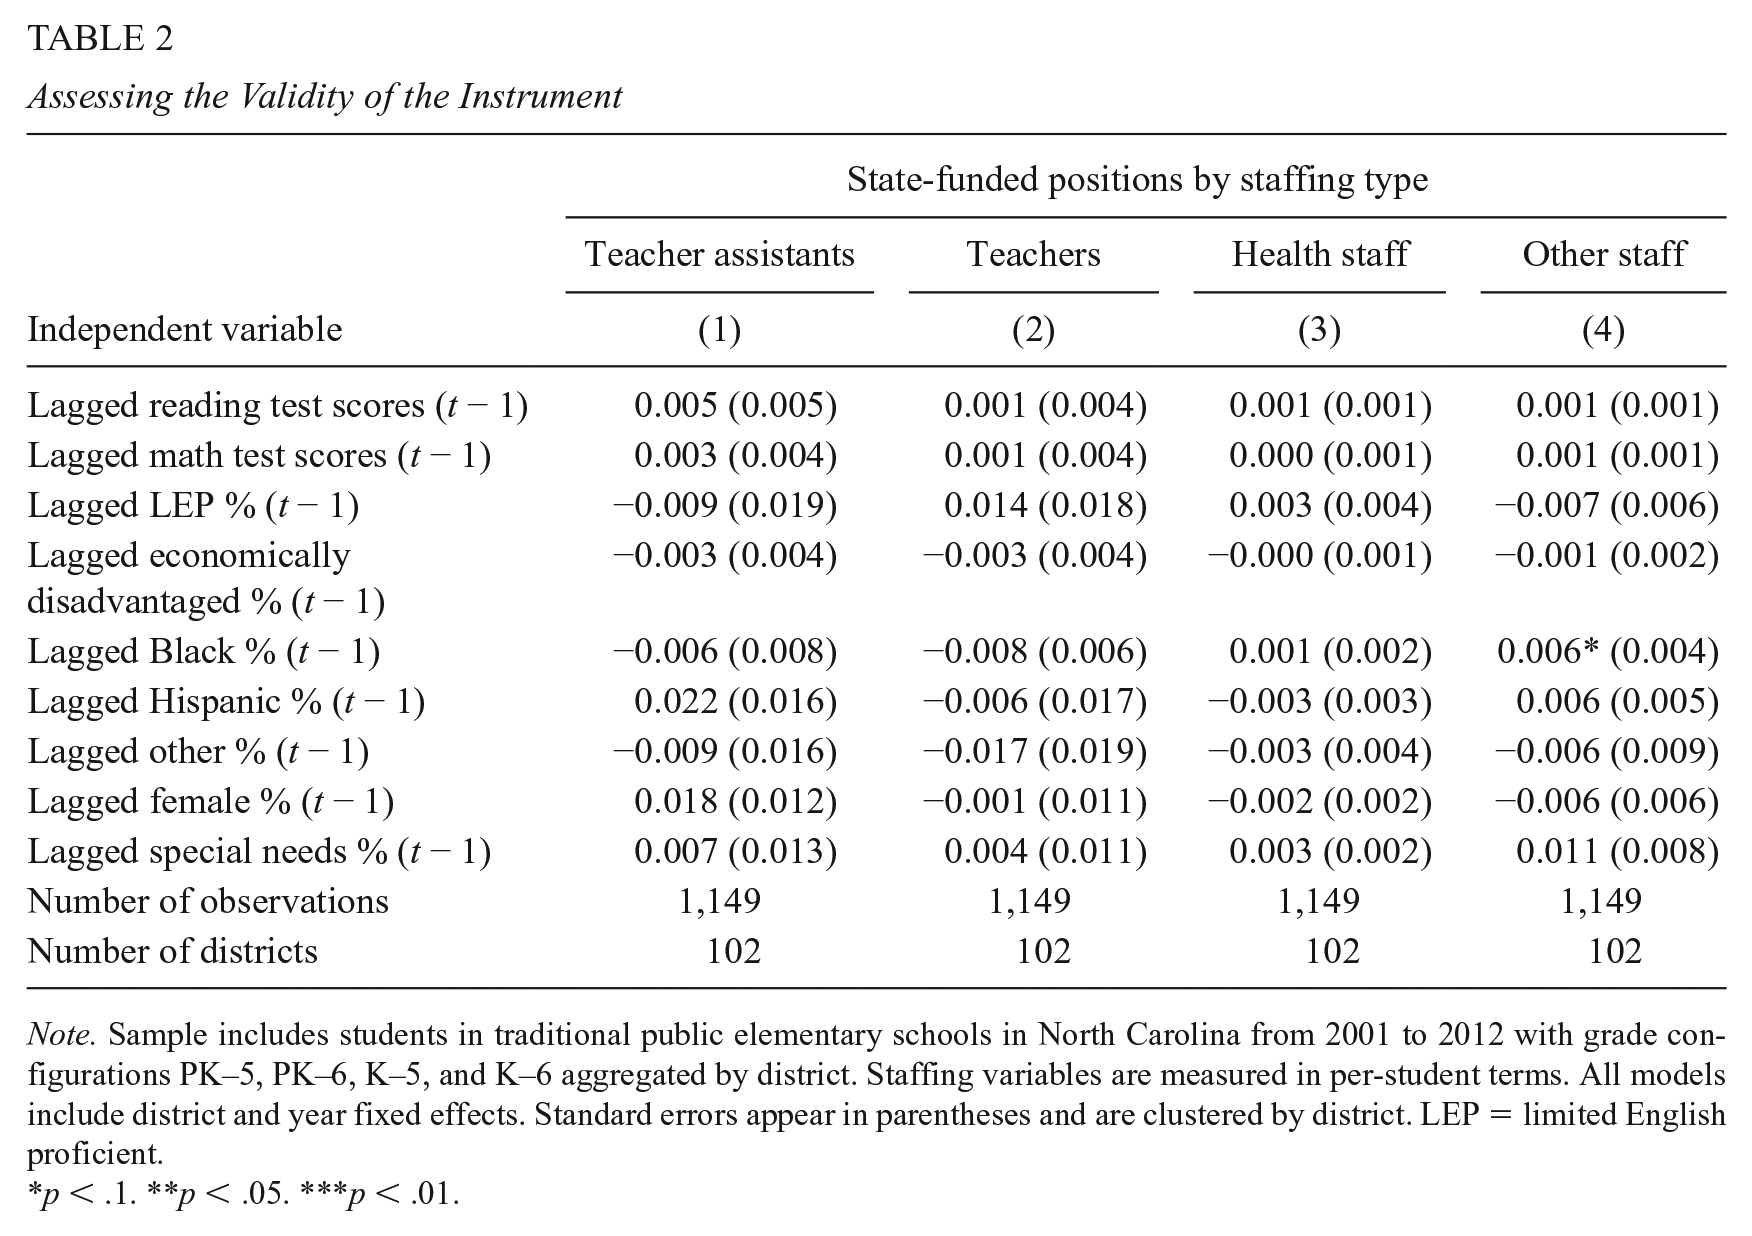
Note. Sample includes students in traditional public elementary schools in North Carolina from 2001 to 2012 with grade configurations PK–5, PK–6, K–5, and K–6 aggregated by district. Staffing variables are measured in per-student terms. All models include district and year fixed effects. Standard errors appear in parentheses and are clustered by district. LEP = limited English proficient.
p < .1. **p < .05. ***p < .01.
The second part of this assumption, which is that the instrument has “no effect on the outcomes other than through the first-stage channel” (Angrist & Pischke, 2009, p. 117), is not directly testable. However, the main threats to the full fulfillment of the exclusion restriction in our setting are indirect, namely compensating behaviors on the part of districts in response to state-funded staffing changes that may also influence student achievement.
As a test of the degree to which we observe such offsetting behavior with respect to staffing for TAs, Figure 4 plots year-to-year changes in TAs funded by the state against year-to-year changes in locally funded TAs. We focus on the years surrounding the recession, 2007 to 2011, and fail to observe a systematic relationship between declines in state-funded TAs and increases in locally funded TAs. Thus, it seems that the majority of districts, including those with notable declines in state-funded TAs, do not meaningfully offset such declines with locally funded positions of the same type. This provides indirect evidence that most districts are not pulling dollars from other inputs to counteract declines in state-funded TAs. Therefore, our estimates of the effects of TAs on student outcomes ought to pick up little of such indirect effects.
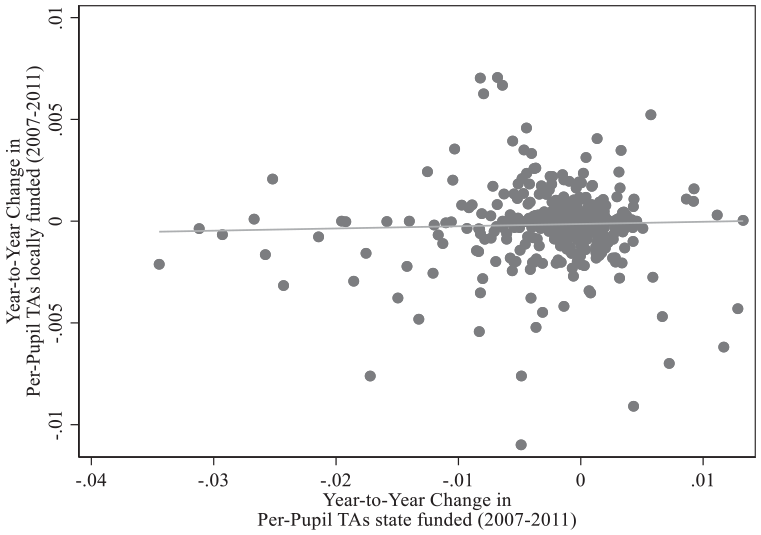
Changes in teacher assistant positions by funding source, 2007–2011.
Another possible concern is that changes in state-funded staffing may affect student outcomes at the district level through changes in the quality, in contrast to the quantity, of the staff. We address this concern for teachers largely by including in the model variables designed to control for their quality
Finally, if sizable numbers of families were systematically moving their children out of traditional public schools in favor of charter schools or were moving between districts in response to aggregate performance measures, 21 we might inappropriately attribute changes in achievement caused by the cross-sector or cross-district movement of families to changes in staffing. We address possible concerns about cross-sector shifting by including in our models controls for the presence of charter schools, as measured at the district-year level by the number of charter schools serving elementary school grades and the proportions of students in charter schools. First established in North Carolina in 1996, charters reached the legislated limit of 100 schools by 2011, at which time the limit was raised. During the sample period, most districts had very few charters (with the average over the full sample period being only about two-thirds of a charter school, as shown in Table 1), although some had several.
Descriptive Statistics
Table 1 provides descriptive statistics for the main analytic sample. The test scores of the students (standardized by grade and year) refer only to students in Grades 3, 4, and 5 or 6 because those are the only students who are tested. All the staffing variables, however, apply to all the students in the analytic sample for each district. 22
Consider first the data for the full sample of elementary schools in Column 1. The mean teacher-to-student ratio is 0.051, that is, 5.1 teachers per 100 students. If each regular teacher had her own class, that would translate into an average class size of about 19 to 20 students, albeit most likely with smaller class sizes in the early grades and larger ones in the upper grades. The mean for TAs is slightly more than half that, at 2.8 per 100 students. Health providers are much less numerous, with only about 0.2 per 100 students, or about one provider per 500 students. The “other” combined category of school counselors, school leaders, and noncertified academic staff is somewhat larger, with 0.6 per 100 students or about one per 167 students.
Table 1 also includes a number of district-level variables that capture characteristics of students, the wider economy, and the two other sources of general state aid, as well as a few teacher characteristics. The student characteristics indicate that slightly less than half the students are economically disadvantaged, 23 27% are Black, about 10% are Hispanic, and about 11% have special needs. The teacher characteristics indicate that teachers have average licensure test scores (i.e., Praxis scores) slightly above the normalized value of 0 for all teachers and about 80% of the teachers have more than 3 years of experience. The average teacher turnover rate at the school level is 21%. 24 The next two columns of Table 1 show comparable information for subgroups of students—students of color (defined as Black, Hispanic, and students classified in other non-White categories) and White students. The staffing variables are quite similar across these two groups of students as well as to those in the full sample.
The final three columns of Table 1 provide comparable information for subsamples of districts grouped by the average share of economically disadvantaged students. 25 The staffing variables are generally comparable with those in the full sample, although the high-poverty districts have a slightly higher ratio of TAs to students, but a lower ratio of teachers to students and the teachers are of lower quality as measured by their lower average Praxis scores.
Findings
Core Results
Table 3 reports the main results for reading and math test scores, contrasting estimates of staffing effects that emerge from our three models: OLS, RF, and 2SLS. 26 All estimates come from specifications that include all of the control variables (see Supplementary Table S2 in the online version of the journal). In the first row of Table 3 are the estimates for TAs, the main staffing category of interest in this study, followed by estimates for teachers, health staff, and other staff.
Reading and Math Test Scores: OLS, RF, and 2SLS Results, 2001–2012
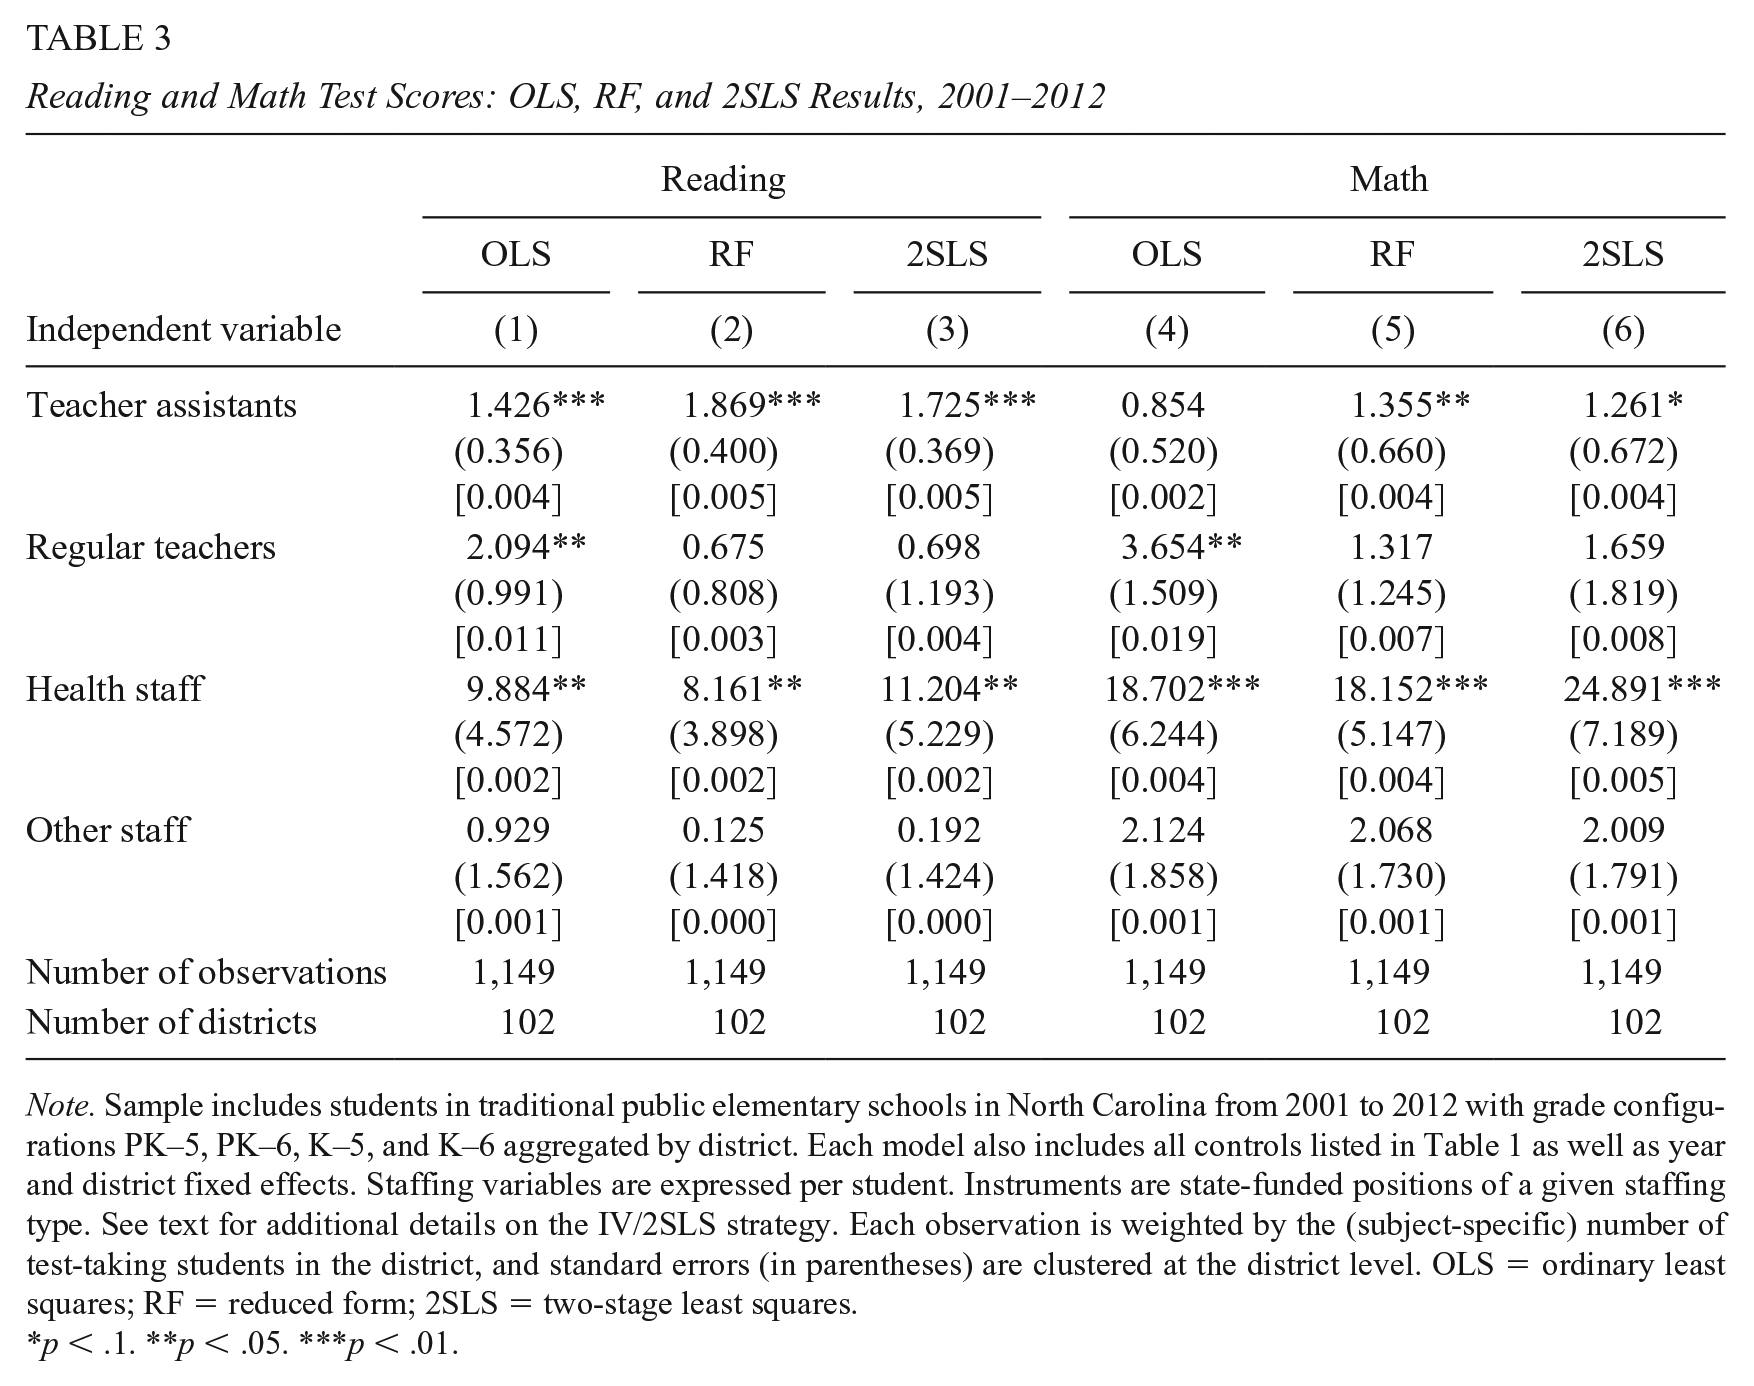
Note. Sample includes students in traditional public elementary schools in North Carolina from 2001 to 2012 with grade configurations PK–5, PK–6, K–5, and K–6 aggregated by district. Each model also includes all controls listed in Table 1 as well as year and district fixed effects. Staffing variables are expressed per student. Instruments are state-funded positions of a given staffing type. See text for additional details on the IV/2SLS strategy. Each observation is weighted by the (subject-specific) number of test-taking students in the district, and standard errors (in parentheses) are clustered at the district level. OLS = ordinary least squares; RF = reduced form; 2SLS = two-stage least squares.
p < .1. **p < .05. ***p < .01.
Consider first the OLS results for reading and math (see Columns 1 and 4, respectively). For reading, the OLS coefficients for TAs, regular teachers, and health staff are all positive and statistically significant and for math all are positive, although the TA coefficient is just short of statistical significance. Taken at face value, these positive coefficients imply that these three types of staffing contribute to student achievement. In contrast, the category of other staff enters with small and insignificant positive coefficients.
The reported coefficients can be interpreted as the effect on student achievement of a one unit increase per 100 students in the specific staffing category, but the relative magnitudes can be misleading because of the differing average staffing levels across categories. The very low average ratio of health care workers per student means, for example, that such an increase for health care workers represents a far larger percentage increase than it does for teachers or for TAs. Thus, to help with the interpretation of the coefficients and to make them more comparable across staffing categories, we show in square brackets below each estimate in this table and in subsequent tables the implied effects of a 10% increase in the staffing variable starting from the average. For example, based on the OLS model, a 10% increase in TAs is predicted to increase reading scores by 0.004 standard deviations (SD), a 10% increase in regular teachers by 0.011 SD, and a 10% increase in health staff by 0.002 SD.
Although these OLS findings appear reasonable, we suspect they may be biased, with the estimates for TAs being downward biased and for regular teachers being upward biased. The concern for teachers is that despite all the control variables in the equation, there may still be a positive correlation between the unexplained error term and the number of teachers per student. That would be the case if districts with high-achieving students (or more specifically, those with positive unexplained variation in student test scores) are located in wealthier areas willing to provide greater local funding for teachers than other areas. The bias for TAs will go in the opposite direction if districts with many low-performing students are able to attract more funding from the federal government for TAs than are other districts. In that case, the additional funding would bias downward the estimated effect of TA funding on student achievement. While we are not willing to reject the OLS results, outright, this type of reasoning leads us to prefer results that emerge from the RF and 2SLS models, especially for the estimates of TAs.
As reported in the first row of the table, the RF and 2SLS estimates for TAs are positive and statistically significant for both subjects. The fact that the estimates are somewhat larger than their OLS counterparts is consistent with our expectation that the OLS estimates of TAs would be downward biased. 27 However, all three sets of estimates for reading are clearly in the same ballpark, suggesting that our use of district and year fixed effects along with rich time-varying controls likely to be correlated with TA levels (from all funding sources) and student achievement go a long way toward producing defensibly causal estimates of the effects of TAs on student performance.
In contrast, the RF and 2SLS estimates for regular teachers are notably smaller than the companion OLS estimate and are statistically indistinguishable from zero for both reading and math. This pattern is consistent with our speculation that well-resourced, higher-performing districts may use local dollars to hire additional teachers in ways that would bias upward the OLS estimates. However, recall the relatively flat trend in state-funded teacher positions depicted in Figure 2. Over our period, the state pursued a teacher allocation strategy designed to maintain reasonable class sizes throughout the recession—and thus our instrument, state-funded teaching positions over time within a district, may be limited in its capacity to identify the effects of teachers on student outcomes. Thus, a reasonable estimate of the causal effects of teacher staffing levels on student achievement likely falls somewhere between our 2SLS/RF and OLS results. Finally, the three approaches generate very similar results for the health staff and other staff variables. In all cases, higher levels of health staff lead to higher levels of both reading and math achievement, whereas higher levels of “other staff” have insignificant effects in all cases.
While some readers may prefer the RF estimates to the 2SLS estimates on the ground that the former do not require the exclusion restriction necessary for the latter, we generally prefer the 2SLS estimates because they can be interpreted as the effect of exposure to additional staff of a particular type on student achievement. Moreover, basic patterns of findings do not differ between the RF and 2SLS sets of results. Hence, we focus attention here on the 2SLS estimates in Columns 3 and 6 of this table, and in subsequent tables we report only the 2SLS results (but see Supplementary Tables S3–S5 in the online version of the journal for a full set of RF estimates).
As already noted, the figures in square brackets below each estimate indicate the effects of 10% increases. Hence, the 2SLS results imply that a 10% increase in TAs, that is, an increase from 2.8 to 3.1 per 100 students, would increase test scores by 0.005 standard deviations in reading and 0.004 standard deviations in math, effects that are slightly larger than those from the OLS models. Because we have no information on the specific activities of TAs within classrooms, we are not able to explore the mechanisms that generate these positive effects. For example, TAs may contribute to student achievement either by their direct interactions with students or by freeing up time for teachers to reallocate their time and effort to the core tasks of teaching.
The comparable results for health care workers are 0.002 standard deviations for reading and 0.005 for math. To assuage any concerns about the inconsistency over time in the specific types of staffing positions that we were able to count as “health staff,” we have also estimated our preferred 2SLS models without that staffing variable. As shown in Supplementary Table S2 in the online version of the journal, this deletion has little influence on the estimated effects of TAs. Despite definitional challenges not only for the health staff variable but also for “other staff,” we prefer to include both variables in all the models to avoid any bias that might arise from correlations among the staffing categories. 28
We conclude this section on core results by noting that most of the time-varying measures of demographic and teacher characteristics enter the equations as expected (see Supplementary Table S2 in the online version of the journal for the full models). Thus, they appear to serve as reasonable statistical controls for any district-level changes in the composition of students or teachers that might be correlated with changes in staffing levels. 29 The two time-varying controls that capture changes in local economic conditions—the local unemployment rate and median household income, both defined at the county level—also enter in expected ways. These controls are important given that much of the intertemporal variation that we exploit comes from cutbacks in TAs during the recession. Given that the timing of such cutbacks is correlated with recessionary pressures across districts, their effects could be confounded by the effects of such pressures on the local labor market for school staff. Consistent with an earlier study that focused on the relationship between recessionary pressures and teacher quality (Nagler et al., 2020), the positive coefficient on the unemployment rate (and a negative coefficient on median income) suggests that schools are able to hire more qualified staff when job opportunities in the local private sector economy are limited. Thus, if the pool of TA applicants markedly changed in a transient manner during the recession along dimensions not captured by our control variables, our results may not be as applicable to times when the economy is stronger. This could potentially limit the external validity of our findings.
Robustness Checks and Additional Threats to Internal Validity
In this section, we first test the robustness of our basic findings and then explore some of the remaining potential threats to the internal validity of our approach.
The robustness checks appear in Table 4. Columns 1 and 4 of the table repeat our preferred 2SLS results from Table 3. We then examine the robustness of those results to (a) limiting the sample to a fully balanced set of districts, and (b) adding district-specific linear time trends, which control for the evolution of any remaining, hard-to-measure within-district forces possibly correlated with both changes in staffing levels and student achievement. As we move to a balanced sample of only 89 districts, our basic conclusions about the effectiveness of TAs in both reading and math hold up. With the addition of the district-specific linear time trends, the estimate for TAs in reading falls somewhat but retains its statistical significance. In contrast, the estimate for math is small and no longer statistically significant. Thus, the effect of TAs on student achievement in reading is more robust than the effect in math.
School Staffing and Student Achievement, 2SLS Estimator, 2001–2012: Robustness of Main Results and Falsification Check
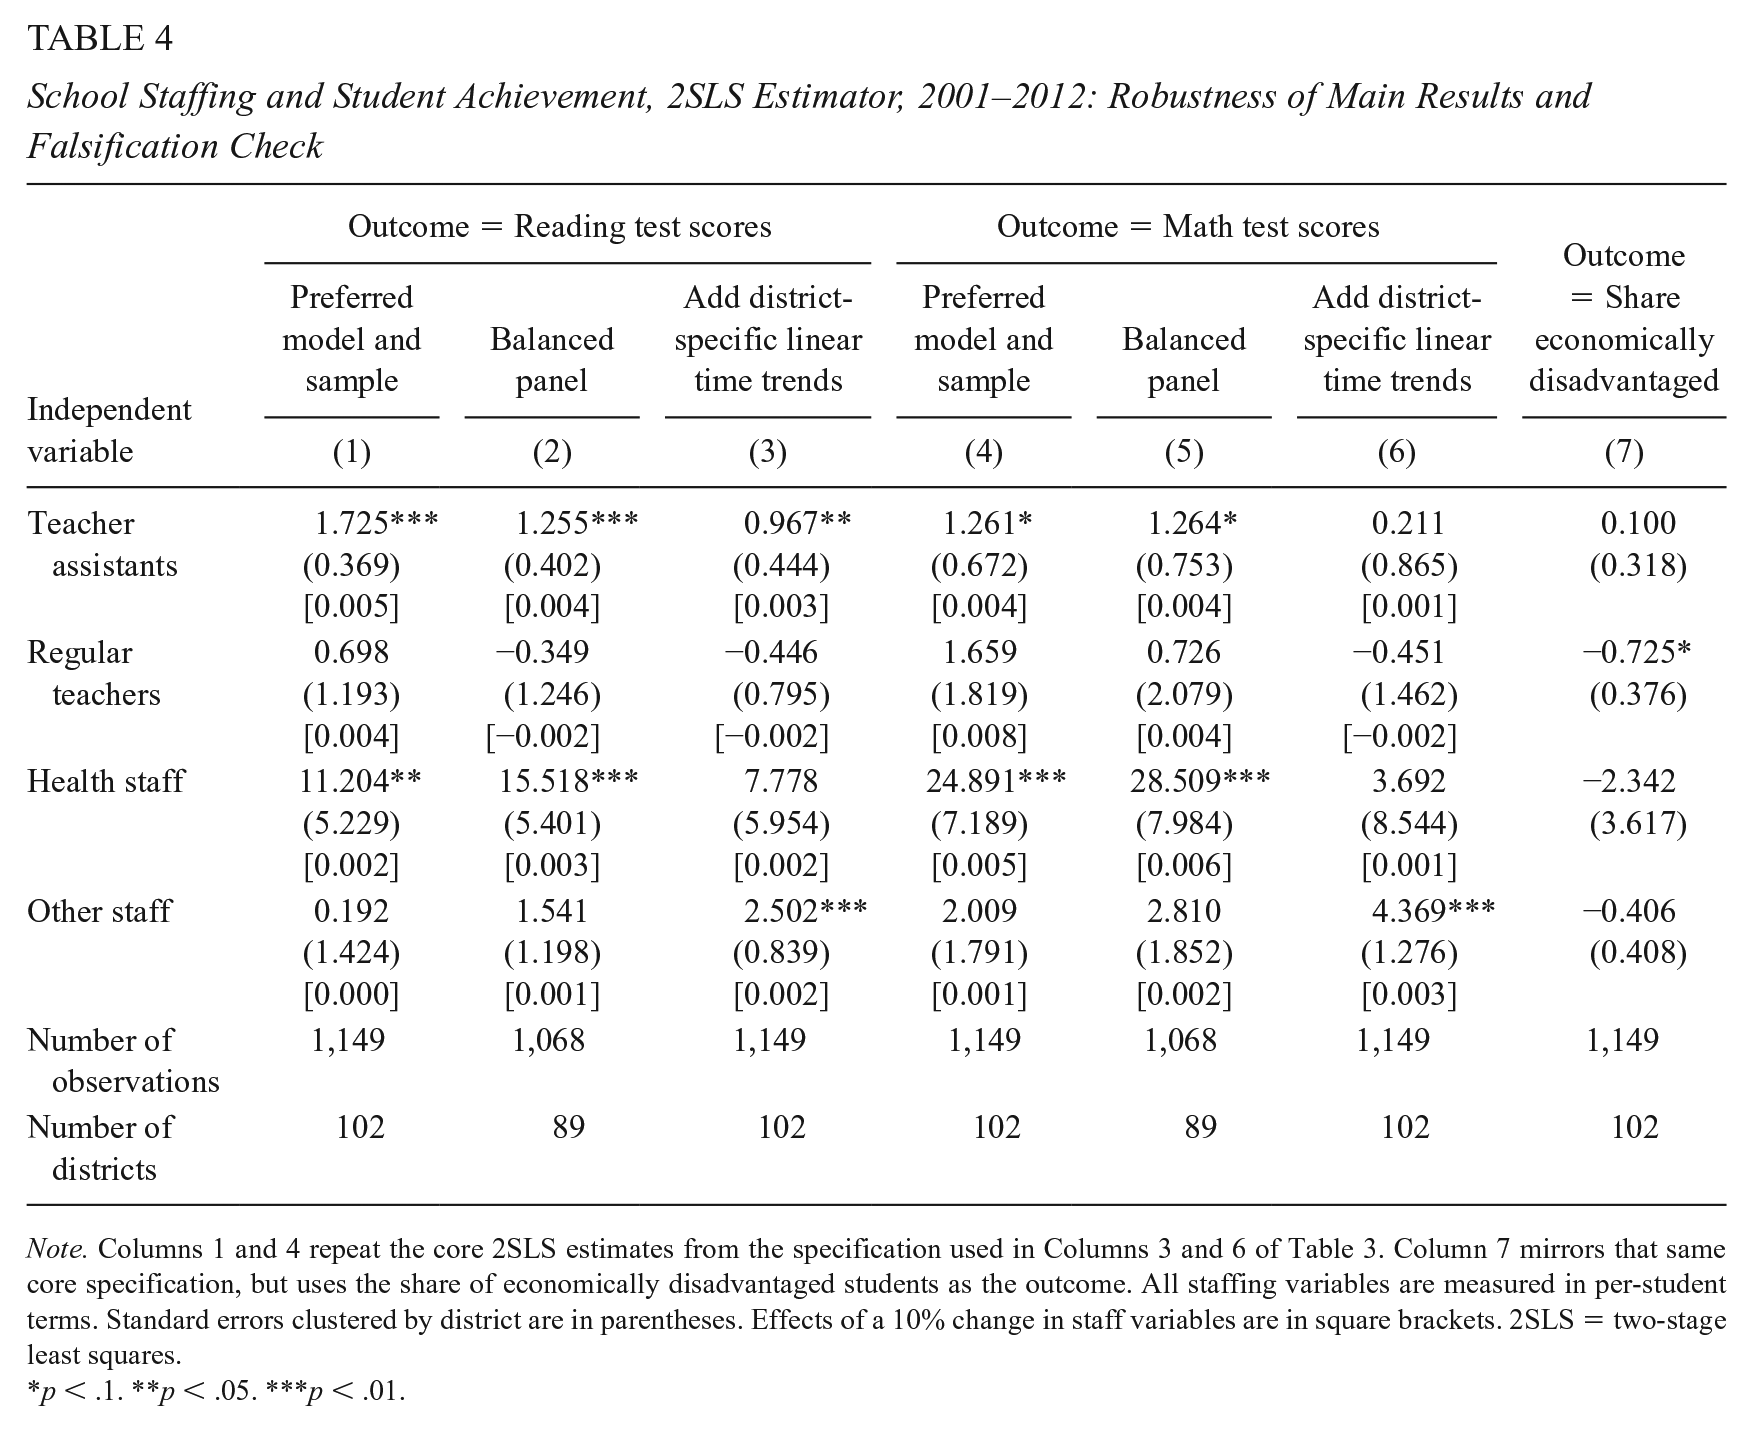
Note. Columns 1 and 4 repeat the core 2SLS estimates from the specification used in Columns 3 and 6 of Table 3. Column 7 mirrors that same core specification, but uses the share of economically disadvantaged students as the outcome. All staffing variables are measured in per-student terms. Standard errors clustered by district are in parentheses. Effects of a 10% change in staff variables are in square brackets. 2SLS = two-stage least squares.
p < .1. **p < .05. ***p < .01.
We note as well that the addition of the time trends substantially reduces the estimated effects of health staff in both subjects at the same time that it raises the coefficients for other staff. Given that the models already include a large number of time-varying control variables, all of which were included for specific theoretical reasons, we interpret these unexpected results with some caution and simply acknowledge that our estimates of the positive effects of health staff in other models are not robust to the addition of linear time trends. 30
The final column of Table 4 includes a falsification test. For this test, we start with the preferred specification of our 2SLS estimator but use the share of economically disadvantaged students as the dependent variable. If our instruments have allowed us to carve out plausibly exogenous variation in staffing levels, such variation ought not to be correlated with changes in the socioeconomic characteristics of districts. We see no evidence of such concerns with respect to TAs, health staff, and other staff, but some evidence of a marginally significant negative relationship between regular teachers and the share of economically disadvantaged students. On net, this evidence generally supports our identifying assumptions.
Additional Results
The literature we reviewed earlier suggests that TAs may have larger effects for traditionally underserved students than for other students. We examine such differences in Table 5 first by exploring the degree to which effects of TAs and other staff differ for students of color (i.e., Black, Hispanic, and other non-White students) as compared with White students. The first four columns of Table 5 show that the effects of TAs on test scores in both math and reading are larger for non-White students than for White students. In particular, 10% increases in TAs raise the test scores of non-White students by 0.01 SDs in reading and by 0.008 SDs in math, effects that are larger than the comparable estimates of 0.003 SD and 0.001 SD for White students.
Test Score Results for Staff Variables, by Subgroup and Subsample, 2SLS Estimator, 2001–2012
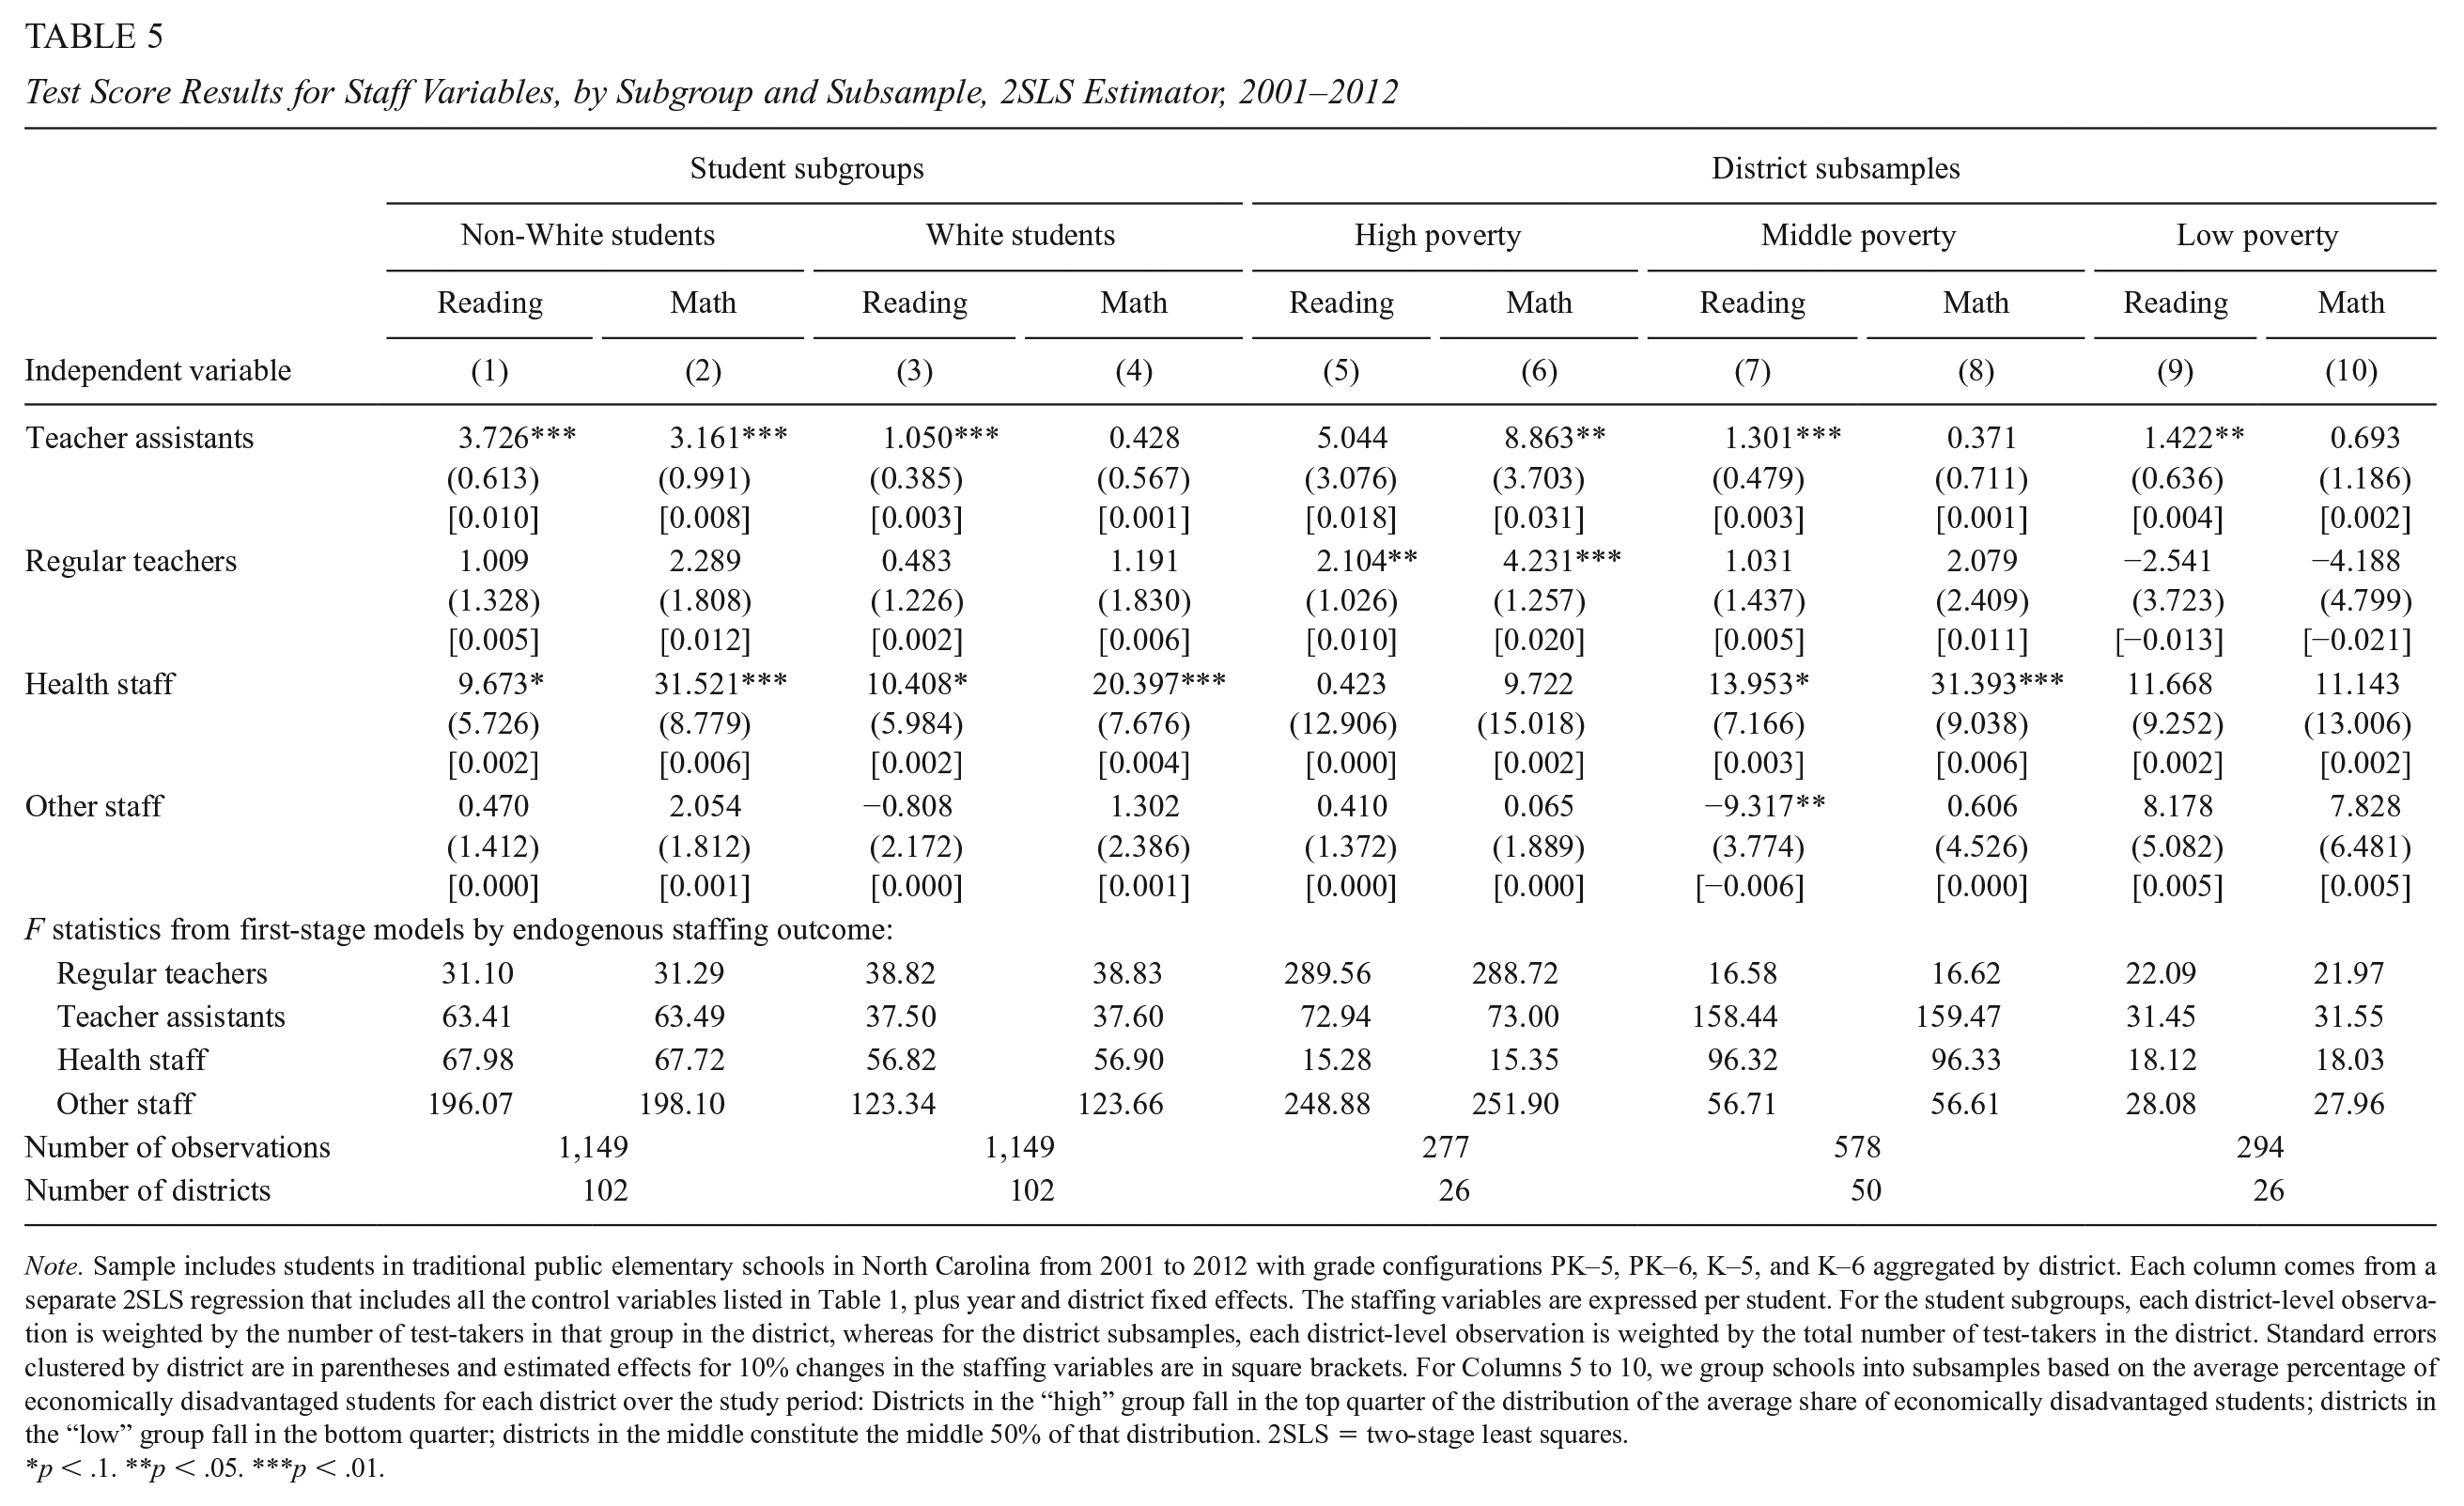
Note. Sample includes students in traditional public elementary schools in North Carolina from 2001 to 2012 with grade configurations PK–5, PK–6, K–5, and K–6 aggregated by district. Each column comes from a separate 2SLS regression that includes all the control variables listed in Table 1, plus year and district fixed effects. The staffing variables are expressed per student. For the student subgroups, each district-level observation is weighted by the number of test-takers in that group in the district, whereas for the district subsamples, each district-level observation is weighted by the total number of test-takers in the district. Standard errors clustered by district are in parentheses and estimated effects for 10% changes in the staffing variables are in square brackets. For Columns 5 to 10, we group schools into subsamples based on the average percentage of economically disadvantaged students for each district over the study period: Districts in the “high” group fall in the top quarter of the distribution of the average share of economically disadvantaged students; districts in the “low” group fall in the bottom quarter; districts in the middle constitute the middle 50% of that distribution. 2SLS = two-stage least squares.
p < .1. **p < .05. ***p < .01.
In addition, we examine in Columns 5 to 10 the extent to which the effectiveness of TAs differs across subsamples of districts defined by their poverty rates. 31 The results indicate that estimated coefficients for TAs in the high-poverty districts (5.04 in reading and 8.86 in math) far exceed the estimated coefficients in the other subsamples of districts. The large standard errors for the TA estimates in the high-poverty subsample, however, renders the coefficient for reading just short of statistical significance. Smaller but positive and statistically significant effects are also apparent for TAs in reading, but not in math, in both middle- and low-poverty districts. Finally, we note that regular teachers also enter with large and positive statistically significant effects in the high-poverty districts, a pattern that is consistent with prior work that finds relatively larger benefits of smaller class sizes for disadvantaged students (e.g., Dynarski et al., 2013).
In Table 6, we report a final set of results for a different academic outcome, namely the proportion of tested students who score at or above subject- and grade-specific proficiency levels. We report 2SLS results for all students and the same subgroups and subsamples as in Table 5. The averages for the composite proficiency rates are 76.9% in reading and 81.7% in math. In contrast to average test score measures that incorporate all student test scores, this measure focuses attention on students at the margin of success. Throughout the period of this study, North Carolina schools, like schools in all other states, were subject to the federal accountability requirements of NCLB. This federal law put pressure on schools to raise the proportions of their students who tested at proficient levels or above. The focus on proficiency rates encouraged schools to pay close attention to the students on the borderline of passing the tests, perhaps to the detriment of students who are likely to score way below or well above the proficiency cut point (Ladd & Lauen, 2010; Lauen & Gaddis, 2016). Additional TAs could potentially play a key role in helping students close to passing to perform well enough on the test to reach the proficiency level. The reason is that TAs—assuming they have sufficient training—can work with small groups of students who need additional help to get over the hurdle as the teacher continues to work with the bulk of the class or they can free up time for the teacher to work more intensively with such students.
Note. 2SLS = two-stage least squares; OLS = ordinary least squares; TA = teacher assistant.
School Staffing and Academic Proficiency, 2SLS Estimator, 2001–2012
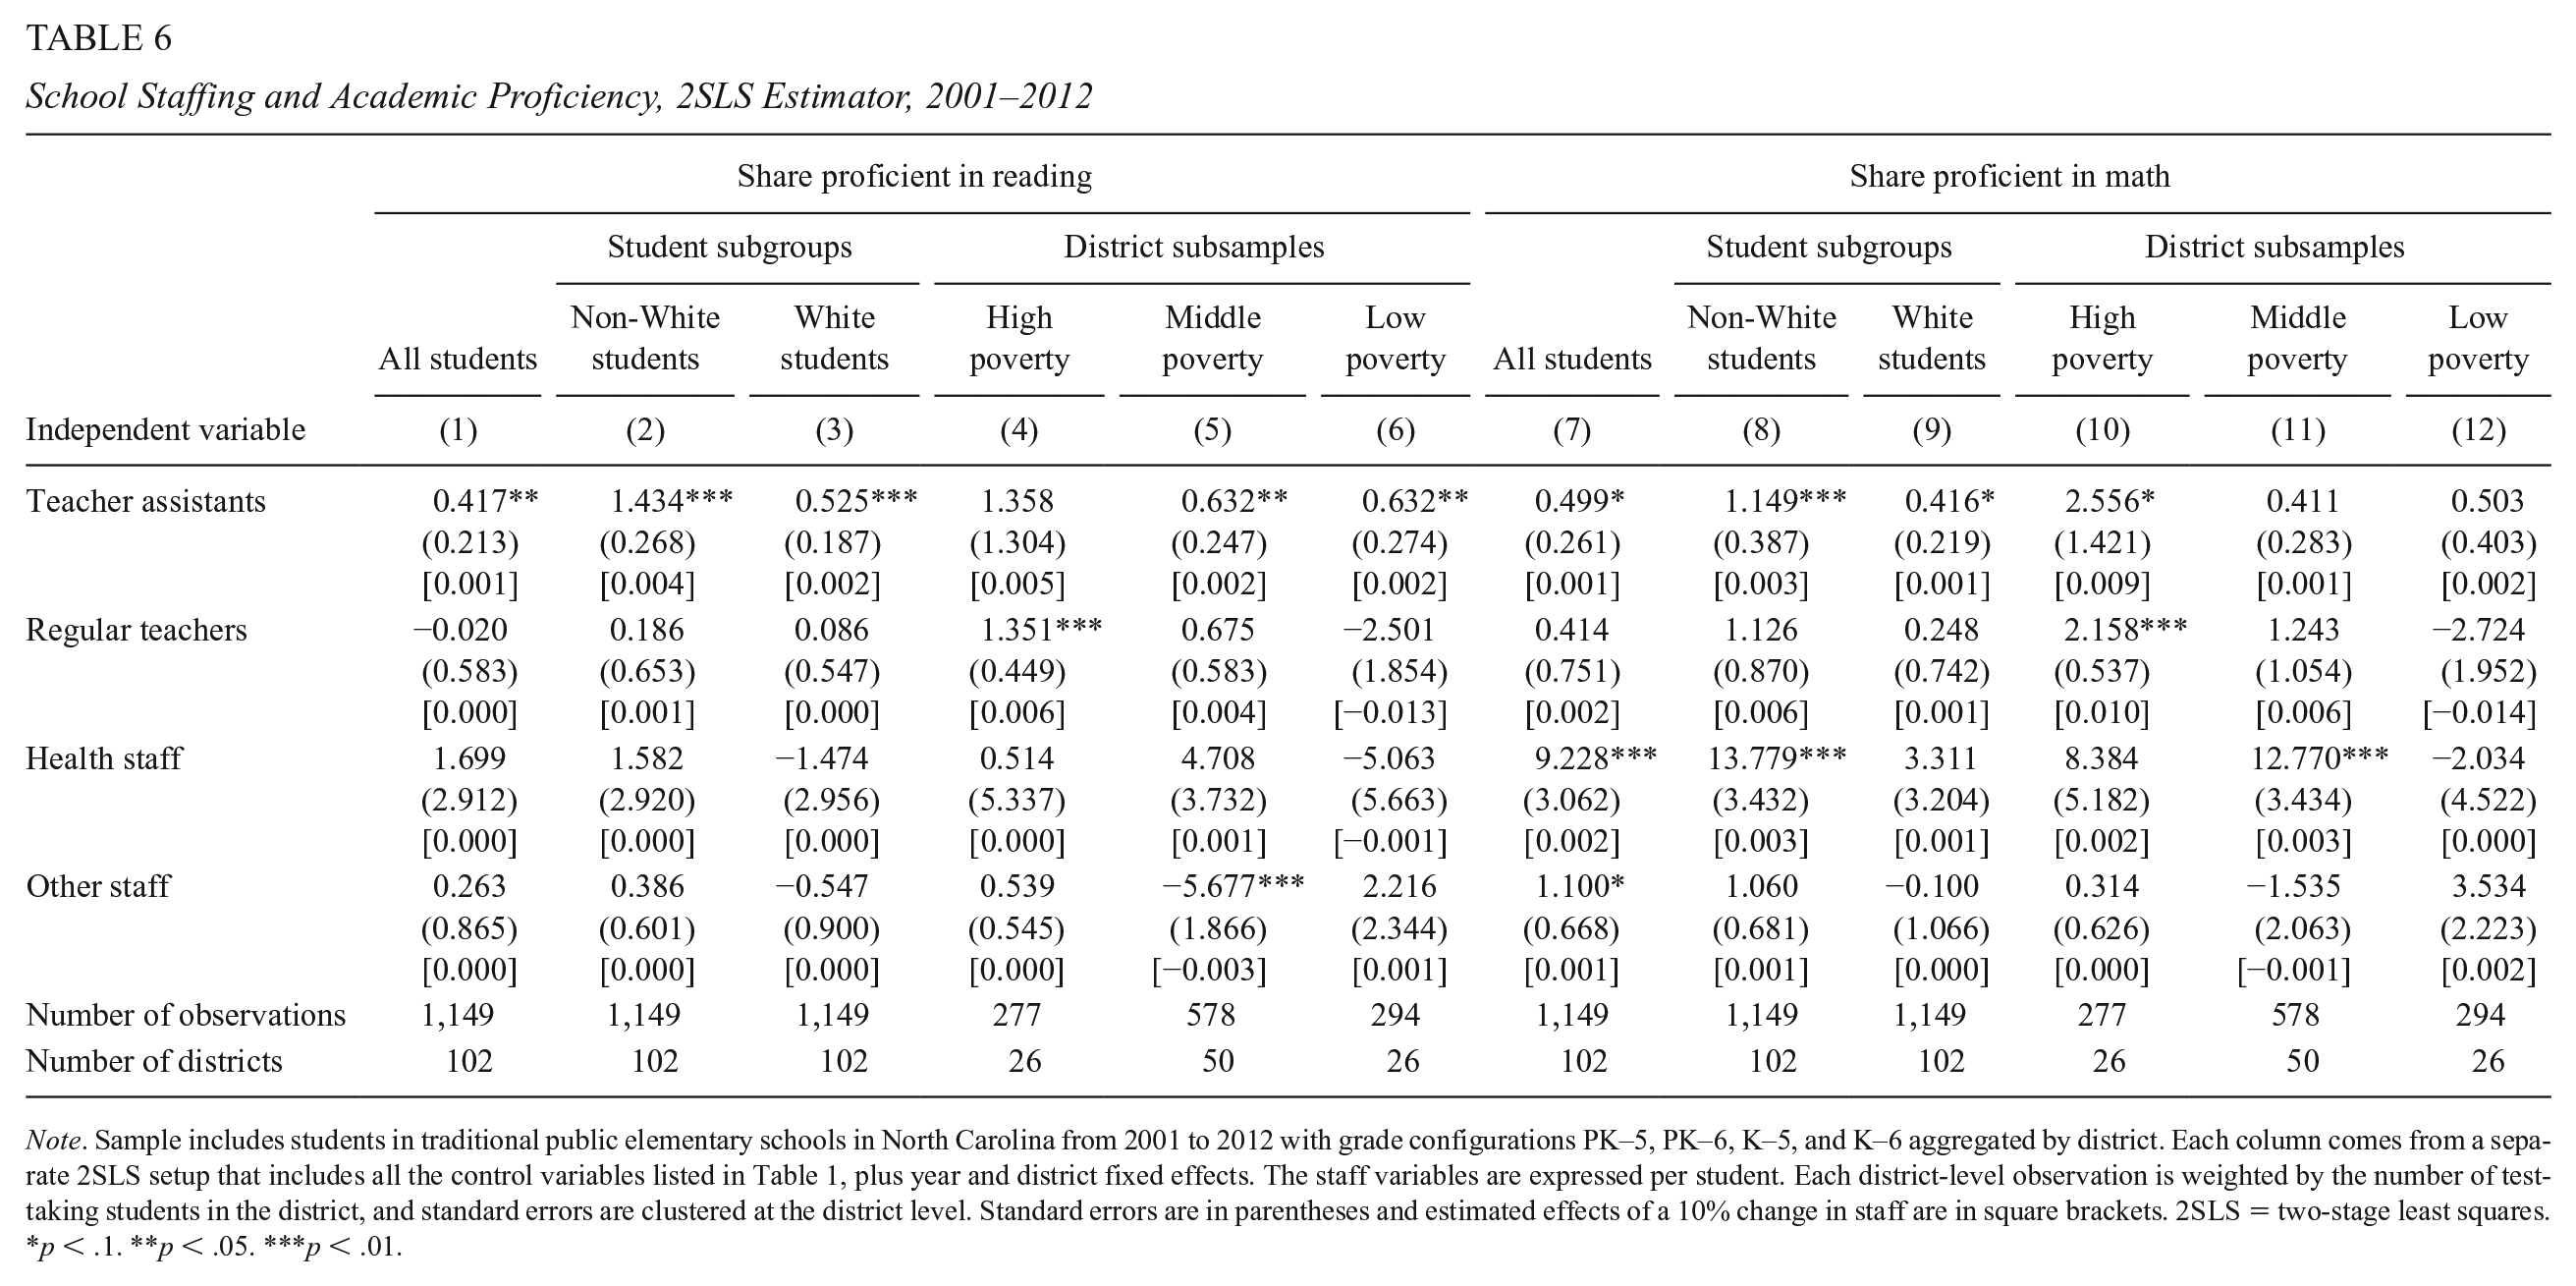
Note. Sample includes students in traditional public elementary schools in North Carolina from 2001 to 2012 with grade configurations PK–5, PK–6, K–5, and K–6 aggregated by district. Each column comes from a separate 2SLS setup that includes all the control variables listed in Table 1, plus year and district fixed effects. The staff variables are expressed per student. Each district-level observation is weighted by the number of test-taking students in the district, and standard errors are clustered at the district level. Standard errors are in parentheses and estimated effects of a 10% change in staff are in square brackets. 2SLS = two-stage least squares.
p < .1. **p < .05. ***p < .01.
Table 6 shows that additional TAs raise the shares of all students scoring proficiently in both reading and math, and that the effects are about twice as large for non-White students as for White students. 32 In addition, the effects are somewhat larger in reading than in math. Across the district subsamples, the largest estimates, once again, are for the high-poverty subsample, although large standard errors render the reading coefficient statistically insignificant, and the math coefficient only marginally significant. Together, these results reinforce our earlier findings about the positive impact of TAs on academic outcomes, especially for non-White students, and in reading.
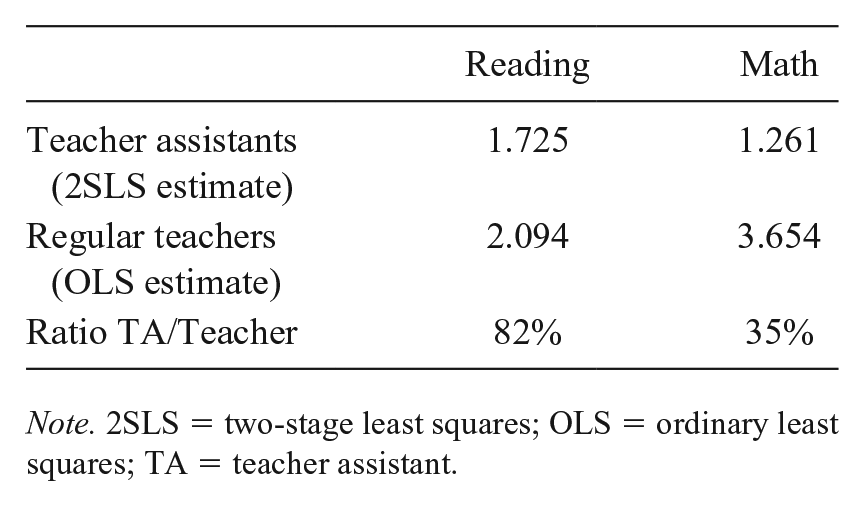
Are TAs Cost-Effective?
TAs have lower salaries than teachers, hence TAs need not be as effective as teachers to make them cost-effective. The question here is whether TAs are sufficiently effective relative to teachers to make hiring more TAs a cost-effective investment. For the following analysis, we assume that the only criterion for hiring TAs is their contribution to student test scores. This is clearly an oversimplification given that the educational goals of schools, and, more specifically, of both teachers and TAs, extend far beyond test scores (e.g., Jackson, 2012).
North Carolina has a statewide salary schedule that differentiates teacher salaries based on a teacher’s educational background and years of experience. For the following calculation, we use a monthly salary of US$4,400 which is the 2019 salary of a teacher with a master’s degree and 5 years of experience. 33 The state also specifies a salary range for TAs (Level 56 category on the 2019 salary schedule) of US$2,100 to US$3,300. Thus, if we assume that a typical TA is paid at the midpoint of that range, the TA’s salary would be US$2,700, or about 61% of that of a teacher.
We use the upper-bound, OLS estimates of the effects of teachers on student achievement in math and reading. This provides conservative estimates of effectiveness with which to assess the relative cost-effectiveness of TAs. Thus, we compare the following estimates from Table 3:
Based on these figures, TAs would appear to be a cost-effective investment for reading given the 82% effectiveness ratio is well above the 61% salary ratio, but they would not be cost-effective for math. Alternatively, a comparison of the average effectiveness ratio of 59% (=(82+35)/2) across the two subjects to the salary ratio indicates that TAs are roughly cost-effective on average given their contributions to both subjects. In addition, we remind the reader that the OLS estimates for regular teachers are most likely biased upward. Taking that upward bias into account would further strengthen the argument that TAs are cost-effective, even based on the limited definition of effectiveness used here.
Summary and Discussion
Children interact with a range of adults in schools. Research in the social sciences has largely focused on the role of teachers in shaping student achievement. Teachers are of central importance to the work of educating students, but by no means function in isolation. In this article, we expand the lens of inquiry to study the effects of TAs and other staff members on student outcomes using data from elementary schools in North Carolina.
It is difficult to determine how staffing levels affect student outcomes given that levels of staffing are typically not exogenous to schools and districts. The resulting challenge for empirical research is to rule out the possibility of reverse causation, wherein student outcomes affect staffing levels, which in turn would lead to biased estimates of staffing effects. The estimates would be upward biased if staffing levels were typically higher in districts serving more advantaged and higher-performing students and downward biased if staffing levels were higher in districts serving more disadvantaged and lower-performing students.
We use a new strategy for addressing such bias-inducing reverse causation to estimate the effects of TAs on student test scores. In particular, the specific manner in which the state of North Carolina funds its schools allows us to instrument for changes in staffing at the district level with state-determined changes in funded positions to districts. Given the large reduction in state funding for TA positions during our sample period, this two-stage approach—combined with district and year fixed effects, time-varying demographic characteristics and measures of teacher quality, as well as county-level economic controls—generates plausibly causal estimates of the effects of TAs on student outcomes. Although we have pursued a variety of strategies to limit the confounding influence of local economic changes, to the extent that the recession broadly boosted the quality of the TA pool in a transitory fashion along dimensions we cannot capture, our results might not hold in periods with a stronger economy. This points to the need for additional work on the characteristics of TAs that lead to improved student outcomes.
We find evidence that TAs have positive effects on student test scores in reading and math, with the largest, consistent, and most robust effects in reading. As we illustrated above, the effects of TAs in that subject are sufficiently large to show that hiring TAs can be a cost-effective way to improve test scores in reading. In addition, we find that TAs have larger positive effects on the academic performance of students of color and suggestive evidence that the effects are higher in high-poverty districts than in other types of districts. Finally, we also find evidence that TAs help to boost school-level proficiency rates, particularly among non-White students and those in high-poverty districts.
Our strong and quite consistent story about the importance of TAs counters the relatively more pessimistic, standard view about TAs that emerged from the highly cited Tennessee STAR experiment during the 1980s. However, our results are quite consistent with much more recent experimental evidence from Denmark that finds positive effects of TAs on reading scores (Andersen et al., 2018). The role of TAs in the United States has likely evolved since the 1980s, with perhaps more complementary use of TAs as “part of a professional team who share responsibility for a classroom rather than help with practical tasks” (Andersen et al., 2018, p. 35). Thus, although we cannot observe specific activities of TAs in our study, our results are consistent with such a view.
Increases in health staff also appear to lead to higher test scores, with the largest effects in math and in middle-poverty districts. We are careful not to oversell these health staff results because our measure of health care staffing within schools excludes some important personnel such as nurses and school psychologists. However, these estimates are suggestive of positive contributions of health care providers to student outcomes at the elementary school level.
We remind the reader that student achievement as measured here by test scores in reading and math is not the only goal of schooling, and that teachers, TAs, health providers, and other staff members may also contribute to student outcomes in ways that we have not measured, including in the form of achievement in other subjects, as well as behavioral and other non-test-score outcomes. More research is needed to understand the ways in which TAs and other support staff contribute to valued outcomes for students.
Supplemental Material
sj-xlsx-1-epa-10.3102_0162373721990361 – Supplemental material for Do Teacher Assistants Improve Student Outcomes? Evidence From School Funding Cutbacks in North Carolina
Supplemental material, sj-xlsx-1-epa-10.3102_0162373721990361 for Do Teacher Assistants Improve Student Outcomes? Evidence From School Funding Cutbacks in North Carolina by Steven W. Hemelt, Helen F. Ladd and Calen R. Clifton in Educational Evaluation and Policy Analysis
Footnotes
Acknowledgements
We thank Charles Clotfelter and Kris Nordstrom for comments on earlier drafts. We are grateful to two anonymous referees for very thoughtful suggestions that improved the paper. Winnie Biwott, Adrienne Jones, Ying Shi, and Mavzuna Turaeva provided excellent research assistance for this project.
Declaration of Conflicting Interests
The author(s) declared no potential conflicts of interest with respect to the research, authorship, and/or publication of this article.
Funding
The author(s) disclosed receipt of the following financial support for the research, authorship, and/or publication of this article: This research was supported by the National Center for the Analysis of Longitudinal Data in Education Research (CALDER), which is funded by a consortium of foundations. For more information about CALDER funders, see ![]() .
.
Notes
Authors
STEVEN W. HEMELT is an associate professor in the Department of Public Policy at the University of North Carolina at Chapel Hill, and a research fellow at the Institute of Labor Economics (IZA). His research intertwines the economics of education, education policy, labor economics, and program evaluation.
HELEN F. LADD is the Susan B. King Professor Emerita of Public Policy and Economics, Sanford School of Public Policy at Duke University. She has studied a range of education policy issues, including school choice and school finance, in the United States and other countries.
CALEN R. CLIFTON is a fellow with the Strategic Data Project at the Harvard Graduate School of Education and a senior data analyst with ImpactTulsa. His research interests include teacher quality, school choice, and segregation.
References
Supplementary Material
Please find the following supplemental material available below.
For Open Access articles published under a Creative Commons License, all supplemental material carries the same license as the article it is associated with.
For non-Open Access articles published, all supplemental material carries a non-exclusive license, and permission requests for re-use of supplemental material or any part of supplemental material shall be sent directly to the copyright owner as specified in the copyright notice associated with the article.