
Abstract
Subtle policy adjustments can induce relatively large “ripple effects.” We evaluate a College Board initiative that increased the number of free SAT score reports available to low-income students and changed the time horizon for using these score reports. Using a difference-in-differences analytic strategy, we estimate that targeted students were roughly 10 percentage points more likely to send eight or more reports. The policy improved on-time college attendance and 6-year bachelor’s completion by about 2 percentage points. Impacts were realized primarily by students who were competitive candidates for 4-year college admission. The bachelor’s completion impacts are larger than would be expected based on the number of students driven by the policy change to enroll in college and to shift into more selective colleges. The unexplained portion of the completion effects may result from improvements in nonacademic fit between students and the postsecondary institutions in which they enroll.
College entrance exam score sending is a college-exploration step in which students from low-income backgrounds may not optimally engage. Yet, it is a key component of the college search, application, and selection process. Among recent cohorts, about 90% of first-time, degree-seeking students enrolling at traditional BA/BS granting institutions are either required or recommended to submit official college entrance exam scores with college applications. 1 Likewise, across the cohorts that we examine in our analysis, 74% of all on-time college enrollers (and 84% of 4-year college enrollers) first enrolled in a college to which they sent their SAT scores. 2 Similarly, more than three quarters of sampled on-time enrollers who completed college sent their SAT scores to the colleges from which they graduated. In short, entrance exam score sending is a key component of the college search. Given this, limited score sending may translate into fewer, or fewer successful, college applications, in turn decreasing the likelihood of prospective college students being admitted to any college or to an institution that represents a sound match on academic, financial, and other dimensions. Importantly, some of these dimensions, such as affordability, may be uncertain at the time of college application.
The SAT is a college entrance exam taken by about 1.4 million high school graduates in the 50 states and D.C. annually over the cohorts included in this study. Nationally, for the cohorts that we examine, nearly half of high school graduates take the SAT during their secondary school experience. For example, approximately 46% of class of 2009 students did so. 3 The rate of participation has risen somewhat in recent years. Among class of 2013 graduates, for example, 49% of students took the SAT. 4 When registering for the SAT, and for a short duration after sitting for the exam, students can select up to four colleges to receive their official SAT score report free of charge. This process requires students to know where they would like to apply and to be confident enough in their exam performance to select colleges without knowing whether their scores are high enough to meet institution-specific admissions standards. Students from low-income backgrounds may especially face uncertainty. Nine days after the SAT administration and several weeks before students receive their scores, this free score-send window closes. Students must then pay US$11.25 per score send. 5 Although modest, the cost of these additional score sends may nevertheless stand as a real barrier to low-income students sending scores and applying to an optimal number and range of postsecondary institutions.
To combat this potential barrier, in the fall of 2007, the College Board implemented a new SAT score-sending policy whereby all low-income students who took the exam with a fee waiver were afforded four additional free and flexible score sends to be used at any time during their high school careers. This policy shock changed the free score-sending opportunities for lower income students in two key ways. First, it allowed lower income students to send SAT scores for free to as many as eight colleges, compared with higher income students who continued to receive the standard four free score sends. Second, this policy changed the time horizon over which eligible students could take advantage of the additional four free score sends, allowing them to receive and react to their SAT performance before selecting institutions to which to send their scores.
To understand the impact of such a policy shift on the college search, application, and college-going behavior of students from low-income backgrounds, we would ideally conduct an experiment. In such an experiment, we would identify all low-income students eligible by virtue of registering for the SAT with a fee waiver, and then we would randomize the opportunity to make use of the flexible score-send policy. Such an experimental approach would ensure comparability of treated and control students prior to policy assignment, and it would therefore allow us to examine the downstream impacts of the policy and investigate heterogeneity in those impacts by student characteristics, such as SAT performance. We hypothesize that this policy shock would influence students’ college search and application behavior both by encouraging students to send scores (and apply) to more schools and by encouraging them to apply to schools that represented a better fit, at least academically, given their ability to respond to information about their own SAT performance prior to score reporting. Furthermore, we hypothesize that such shifts in student behavior at the college search and application stage could lead to downstream improvements in degree completion.
Because the College Board implemented this policy shift systematically for an entire cohort of SAT takers, we are unable to examine its impact in an experimental framework. Instead, we capitalize on a difference-in-differences (DID) analytic strategy to investigate the policy’s impact on SAT score sending, college access, college quality, and bachelor’s degree attainment outcomes for low-income students. Using a standard application of the DID estimation strategy, we measure the change in each outcome for fee-waiver students before and after the introduction of the enhanced score-send policy and compare this change with that occurring among students who did not use SAT fee waivers and therefore were not afforded four free and flexible score sends.
Our investigation is informed by and builds on the work of Pallais (2015), who examined how students changed their score-sending behavior after the ACT, another college entrance exam, increased the default number of free score reports from three to four (with no change in the timing with which such free score reports could be utilized). Pallais finds that this small policy shift contributed to increases in score sending as well as increases in the range of institutions to which students sent scores. Using data on a sample of first-year college students collected through the American Freshman Survey, Pallais then links the change in ACT score-sending policy to a jump in selectivity among colleges attended by lower income students.
In our study, we match student-level score data directly with data from the National Student Clearinghouse and trace out each student’s unique postsecondary trajectory. This allows us to determine whether the flexible score report policy actually increased college enrollment among low-income students in addition to the shifting along intensive margins that Pallais documents. Finally, we document the substantial downstream ripple effects of this seemingly subtle policy shift by revealing the impact of the flexible score report policy on college completion outcomes for low-income SAT takers.
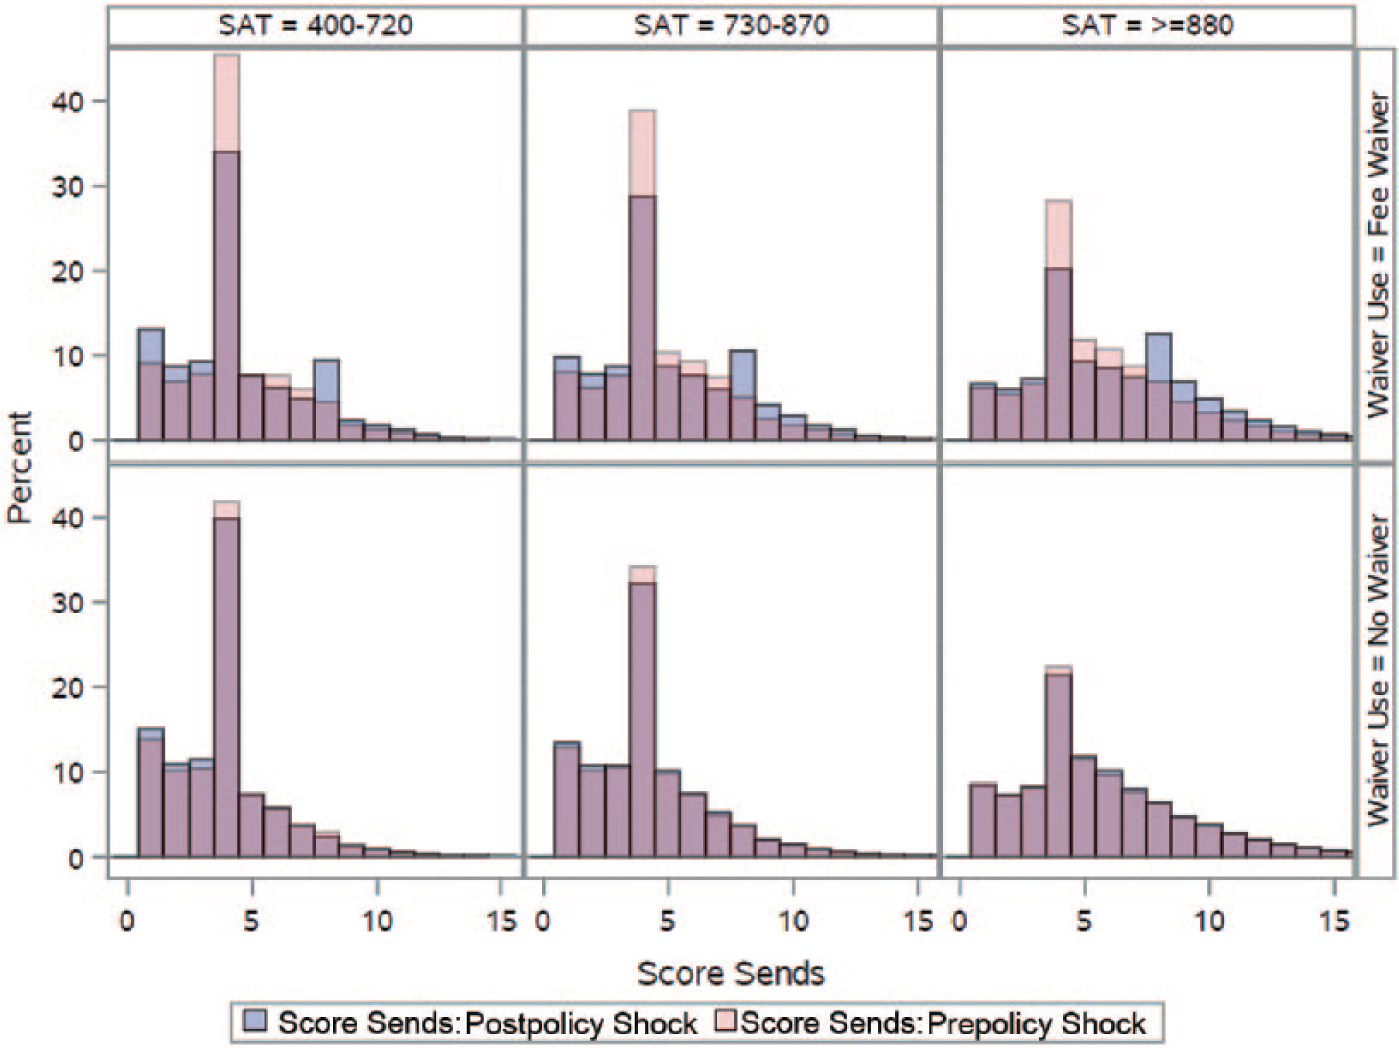
We corroborate Pallais’s (2015) finding that students are responsive to the option of sending more scores for free. Specifically, we estimate that this shift in College Board policy resulted in an increase of 0.4 in the number of score reports sent by fee-waiver recipients, on average. As we illustrate in the left panel of Figure 1, much of this change was driven by the fraction of fee-waiver recipients sending exactly four score reports falling by 10 percentage points and an offsetting 10 percentage point increase in the probability of sending eight or more score reports. Considering longer term impacts, the flexible score report policy also increased both on-time college-going and bachelor’s completion rates (within 6 years) by 2 and 1.7 percentage points, respectively. Our estimates are robust to a number of different model specifications and sample restrictions. Furthermore, as we discuss in detail below, we are able to address and rule out the threats to validity that commonly affect studies using a DID framework as well as threats unique to this study’s setting.
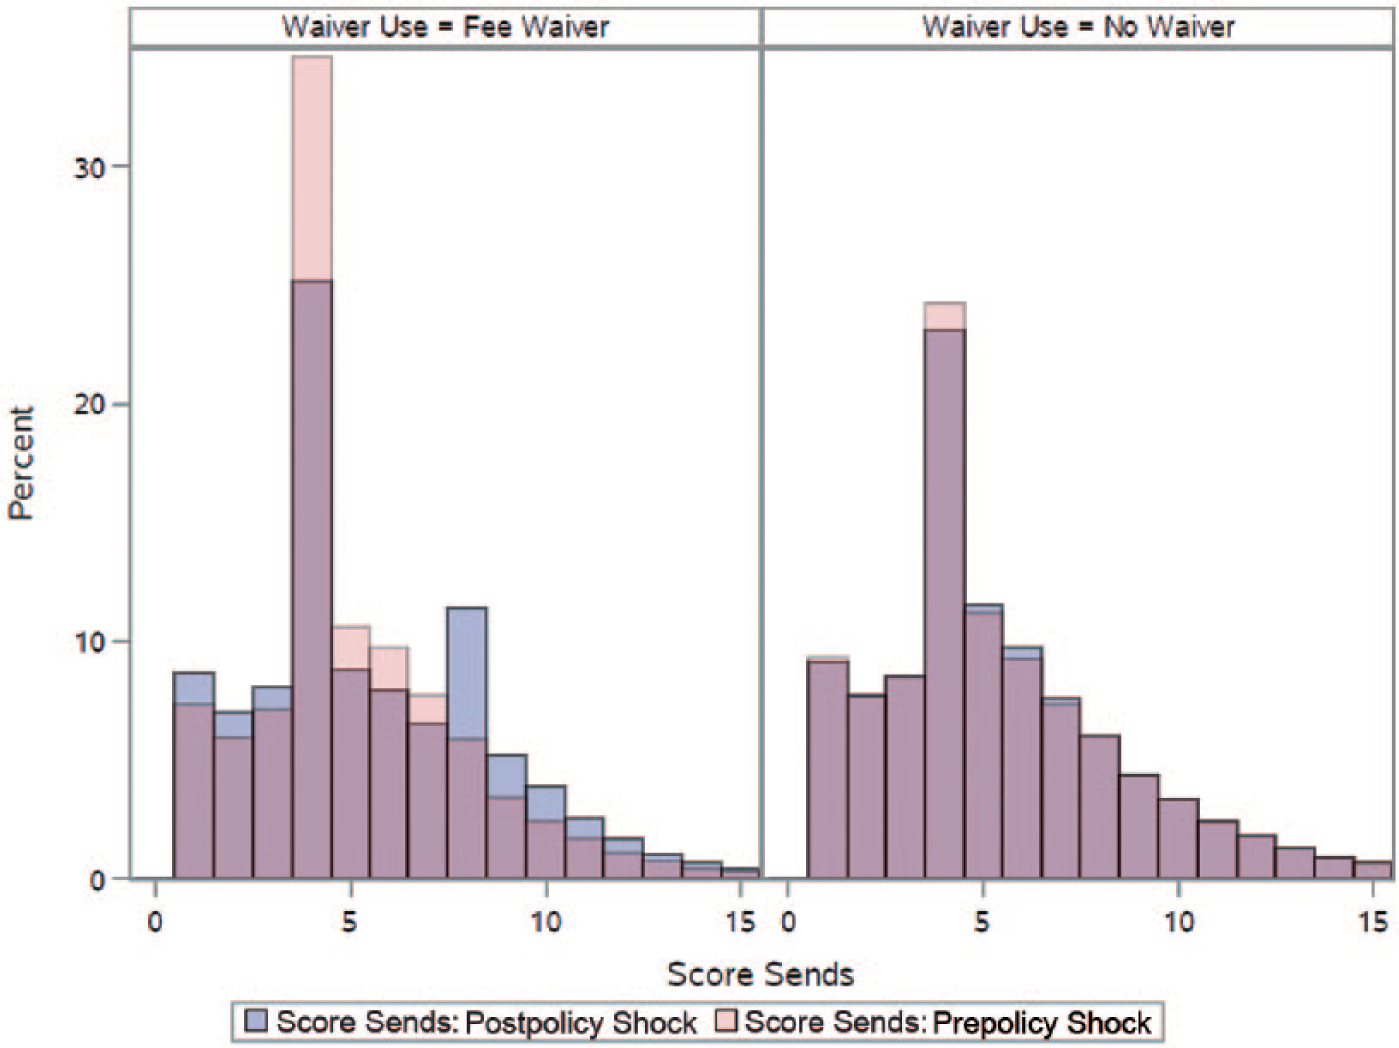
Distribution of score sends, by fee-waiver use and policy exposure.
The impacts of the flexible score report policy on bachelor’s completion are larger than would be expected based on the number of students enrolling in college and shifting into more selective colleges as a result of the policy. The unexplained portion of the completion effects likely results from improvements in nonacademic fit between students and the postsecondary institutions in which they enroll that are not easily assessed given the data available.
We structure the remainder of the article as follows. In the section “Background,” we situate our study within the relevant literature and describe the College Board policy shift that we examine. Then in the section “Research Design,” we detail our data and analytic strategy. In the next section, we present “Results” and then discuss “Threats to Validity” in the following section. We conclude with a discussion in the “Discussion” section.
Background
Whether and where students attend college are important drivers for college completion and subsequent labor market outcomes (Baum, Ma, & Payea, 2013; Card, 1999; Goodman, Hurwitz, & Smith, 2015; Howell & Pender, 2016). Despite the importance of these decisions, students’ processes for college search, application, and selection can be quite haphazard (Avery, Howell, & Page, 2014; Radford, 2013). Even among those who do attend college, many undermatch, primarily because they did not apply to any institutions that aligned well with their own academic qualifications (Dillon & Smith, 2013; Smith, Pender, & Howell, 2013). Although this might be surprising at first, in fact, a growing body of research in both psychology and behavioral economics reveals that individuals often veer from decisions that we would predict based on rational models of behavior. This is especially so when decision makers must parse complex options, when they are poorly informed, and when they are inexperienced and young (Casey, Jones, & Somerville, 2011; Milkman, Beshears, Choi, Laibson, & Madrian, 2012; Ross et al, 2013; Thaler & Mullainathan, 2008; Thaler & Sunstein, 2008).
The college search and selection process is rife with complex decisions, and students often lack appropriate support (Hurwitz & Howell, 2014; see Page & Scott-Clayton, 2016, for a recent review). This complexity, itself, may be a barrier to students achieving college access and success at greater rates. Given this, greater support and guidance can improve students’ postsecondary access and success by facilitating their decision-making processes (Ross et al., 2013). In addition to comprehensive supports, the behavioral economics literature has revealed that even small “tweaks” to the process can have meaningful downstream impacts (e.g., Castleman, Owen, & Page, 2015; Castleman & Page, 2014, 2015, 2016; Castleman, Page, & Schooley, 2014; Lavecchia, Liu, & Oreopoulos, 2014).
From this growing body of literature, three studies are particularly relevant to our research focus. First, Smith (2013) utilizes an instrumental variables (IVs) analytic strategy to examine the causal impact of the number of college applications a student completes on successful college enrollment. Capitalizing on exogenous variation in the adoption rates of the Common Application and the Common Application’s impact on college application behavior, Smith finds that the probability of college enrollment increases when students are prompted to submit more applications. Smith reasons that there are at least two potential mechanisms at play in the result that he observes. First, additional college applications may translate into a higher probability of being accepted. Second, additional applications may increase students’ chances of being accepted into a college that is a good fit along a number of dimensions that may be uncertain at the time of application (e.g., how much financial aid they will be offered or where their friends will be attending school). To the extent that SAT score sending is an ingredient of successful college applications, we hypothesize that we would also see increases in college access as a result of additional college score sends.
This hypothesis is also informed by recent work examining the impact of policy shifts in the number of free score sends afforded by the ACT (Pallais, 2015). In the late 1990s, the ACT shifted the number of free score sends available to test takers from three to four. Pallais finds through quasi-experimental methods that this seemingly minor shift in policy induced students to send their scores to more schools and to schools of a wider range of quality. She finds that low-income students also were more likely to attend more selective colleges as a result.
Third, Bond, Bulman, Li, and Smith (2016) find that SAT performance is hard to predict. Even controlling for prior measures such as PSAT performance, residual variation in SAT scores is substantial. Furthermore, Bond and colleagues observe that student score-sending behavior does differ before and after students know their SAT scores and that students who perform well on the SAT are more aggressive in shifting the types of institutions to which they send their scores once equipped with information on their own performance. Therefore, the ability to send scores for free even after knowing about one’s own performance may have represented a particular opportunity for those eligible students who do relatively well or better than potentially expected on the SAT. These three studies, together, point to the potential for relatively large and potentially heterogeneous ripple effects from small and inexpensive policy adjustments that enhance the college search and selection process.
In this study, we capitalize on a policy shift that was enacted by the College Board’s Board of Trustees in the summer of 2007 to “help low-income students achieve equity in score reporting opportunities.” 6 Beginning in the fall of 2007, low-income students who took the SAT using a fee waiver received four free score reports that they could utilize at any point in their high school careers, in addition to the standard four free score reports that must be used between test registration and 9 days after sitting for the exam or else are forfeited. To qualify for SAT fee waivers, students must meet income guidelines specified by the National School Lunch Program or they must face other unique circumstances, such as living in subsidized public housing or enrollment in Federal TRIO or Upward Bound programs. Students living in foster homes, homeless students, orphans, and wards of the state are also eligible for SAT fee waivers. Although students may take the SAT twice with fee waivers, they are only granted one set of four flexible score reports.
To investigate the college-related outcomes associated with this policy shift, we focus on the following three research questions:
Research Design
Data Sources and Sample
To answer our research questions, we draw on two main data sources. Our first source of data is student-level microdata from the College Board. These data include student SAT scores, the colleges to which students sent their score reports, and a rich set of demographic data, including race/ethnicity and gender and the identity of each student’s high school. Beginning with the graduating cohort of 2007, all of whom graduated from high school before the flexible score report introduction, these data also include information on whether students took the SAT using a fee waiver. For earlier cohorts, we are unable to identify individual fee-waiver usage.
We merge these records to data from the National Student Clearinghouse (NSC) that provide semester-level information on whether and where students are enrolled in college. NSC data allow us to track students into and through college. These data track students through the summer of 2015. Approximately 98% of all college students enroll in NSC participating institutions, although the actual coverage is lower than 98% due to imperfect matching and suppression of student records (Dynarski, Hemelt, & Hyman, 2015).
We utilize several rules for inclusion in our main analytic sample, and we construct several different analytic samples to ensure that our results are consistent and robust to alternate specifications. As the vast majority of students last take the SAT in either the spring of their high school junior year or in the fall of their senior year, and as our research design relies on cross-cohort comparisons, we restrict our sample to students who took the SAT at these test administration time points. This restriction allows us to remove students who may have been categorized into the wrong high school cohort. Nearly 90% of students in each cohort meet this requirement. Next, we limit our sample to students who graduated from high school prior to or in 2009 for three main reasons. First, a central outcome in this research is 6-year bachelor’s completion: Relatively few students who take the SAT with a fee waiver complete college within 4 years. Given the NSC data to which we currently have access, cohorts graduating after 2009 would be excluded from analyses investigating this outcome. Second, some higher achieving students from the 2010, 2011, and 2012 cohorts were included in the Expanding College Opportunities project (Hoxby & Turner, 2013), which had similar aims to the flexible score report initiative. To avoid possible confounding, we omit these students from our sample. Finally, and perhaps more importantly, beginning in the spring of 2009, the College Board introduced Score Choice, a second policy shock that impacted score reporting. Under Score Choice, students are afforded the option to “put their best foot forward” by strategically sending scores from the SAT administration on which they performed best. Prior to Score Choice, official score reports included test results from all SAT administrations. Ultimately, Score Choice provided strong incentives for students to withhold scores from colleges until they completed all testing, which means forgoing the use of the standard four fee waivers. Without separately conducting an analysis of the impacts of Score Choice, we risk confounding the impacts of this policy with the flexible score reporting policy for low-income students, which is our focus here. Fortunately, even with the exclusion of these later cohorts, we are able to obtain precise estimates of the impact of the flexible score-sending policy.
In response to the flexible score report policy, it is possible that students who ordinarily would not take the SAT with a fee waiver would be tempted to seek these waivers more aggressively. Shifts in the composition of fee-waiver or non-fee-waiver students after this policy shock might, therefore, bias our results. To address this potential source of bias, we identify in our sample the subset of students from high fee-waiver use high schools and the subset from high schools where no students utilize fee waivers. In high fee-waiver use high schools, the majority (or all) of SAT test takers were already using fee waivers before the new policy, so this particular source of bias is minimized. Nevertheless, as we show, our results are robust to whether we include in our sample all U.S. high school students who take the SAT or whether we restrict our examination only to students who attended high schools with no fee-waiver use or the highest fee-waiver use before the implementation of the flexible score report policy.
To verify that the differential impacts between fee-waiver and non-fee-waiver students that we document are due to the flexible score-send policy rather than an extension of differing preexisting trends between students in these two groups, we also incorporate into our analyses students from the 2004 through 2006 cohorts. As we are unable to identify students as SAT fee-waiver recipients in cohorts prior to 2007, for these longer trend analyses we focus on high schools where either all or no students from the 2007 through 2009 cohorts used SAT fee waivers. In these high schools, we assume identical participation rates for students in the 2004 through 2006 cohorts. For example, if a student from the 2005 cohort attended a high school where all SAT test takers from the 2007 through 2009 cohorts used a fee waiver, he or she was designated as also having used a fee waiver in taking the SAT.
Finally, we exclude from our main analytic sample students who did not send SAT scores to colleges or scholarship organizations. A primary justification for this decision is to maintain consistency with Pallais (2015), who makes a similar analytic decision in her examination of the shift in ACT’s score-sending policy. As Pallais argues, students who do not send ACT scores are likely to be either students who send scores from the alternate college entrance exam or students who take a college entrance exam for reasons other than college admissions. It is also possible that test takers opted to pursue a 2-year, open enrollment institution or a 4-year institution that did not require entrance exam scores for admission. In short, in the ACT context, Pallais’s logic for excluding nonscore senders in her main specifications is that the additional free score send only changes student behavior on the intensive, not the extensive margin. If a student were never planning to send scores, offering him or her the opportunity to send more scores should not convert nonscore senders into senders. Although the structure of the policy shift we examine is different, as we show, our results indeed corroborate Pallais’s conclusion that shifts in score sending are occurring on the intensive rather than the extensive margin. The fraction of students sending at least one score was not influenced by the policy shock. Given this result, we deem it appropriate to follow Pallais and conduct our analyses after conditioning on score sending.
Nevertheless, we present sensitivity analyses and placebo tests in which we refit our primary models on a sample that includes those who send no scores as well as exclusively for the sample of nonscore senders. Consistent with Pallais, our conclusions are robust to the inclusion of the nonscore senders, though the magnitudes of the parameter estimates are somewhat smaller, which is to be expected as slightly less than a quarter of students sent zero scores.
Measures
We focus on outcomes within three domains: volume and characteristics of score sending, college attendance, and college completion. For purposes of comparability, in many instances the measures on which we focus are influenced by the choices made by Pallais (2015). The college characteristics on which we focus include the SAT scores for all enrolled students, as reported within the Integrated Postsecondary Data System (IPEDS) in 2007. 7 As was done by Pallais, we treat this college-level characteristic as time invariant to avoid mistaking changes in student SAT performance over time with the policy impacts of interest. We additionally consider as an outcome the fraction of students enrolling in a Most Competitive or Highly Competitive college, as defined by the National Center for Education Statistics (NCES)–Barron’s admissions competitiveness index data files from 2008. 8
With data from the NSC, we construct student-level college enrollment and completion metrics. Although we create separate outcome measures for students enrolling at 2- and 4-year institutions, we emphasize that the distinction between these two sectors has become increasingly blurry over time. Some colleges historically considered 2-year institutions have recently introduced a small number of bachelor’s degree programs, whereas many 4-year institutions also offer associate’s degrees (Bidwell, 2014; Radwin & Horn, 2014). As relatively few SAT test takers earn associate’s degrees, our completion outcome of primary interest is bachelor’s degree attainment. For each cohort, we track students for 6 years after high school graduation, except for the 2004 high school graduation cohort, which we track for 7 years.
Analysis
We obtain all estimates of the impact of the flexible score report policy using the DID analytic framework specified by Equation 1, where FeeWvri is an indicator variable specifying whether a student took the SAT with a fee waiver, postSpring2007i is an indicator specifying whether the student last took the SAT after the formal rollout of the flexible score report policy,
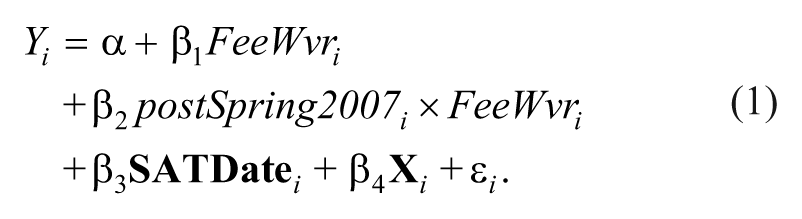
Parameter β2 in Equation 1 represents the unbiased impact of the flexible score report policy on outcome, Yi. Considering the potential effects on college enrollment and completion, we conjecture that these downstream outcomes are driven by increases in score sends that result directly from the flexible score report policy shock. We utilize identical model specifications for all outcomes. Therefore, where we have binary outcomes, our results are derived from linear probability models.
Results
Descriptive Statistics
In Table 1 (columns 1–4), we provide descriptive statistics on score-sending behavior, student demographics, SAT score performance, and collegiate outcomes, disaggregated by whether a student last took the SAT prior to the flexible score report rollout and whether he or she used a fee waiver to take the SAT. In columns 5 to 8, we provide an extended cohort view of these data, focusing on the subset of students within schools where all students or no students in the 2007 through 2009 cohorts utilized fee waivers to take the SAT. As noted previously, we assume that the fee-waiver usage of students from the 2004 through 2006 cohorts matched that of students from the same high schools in the 2007 through 2009 cohorts.
Descriptive Statistics
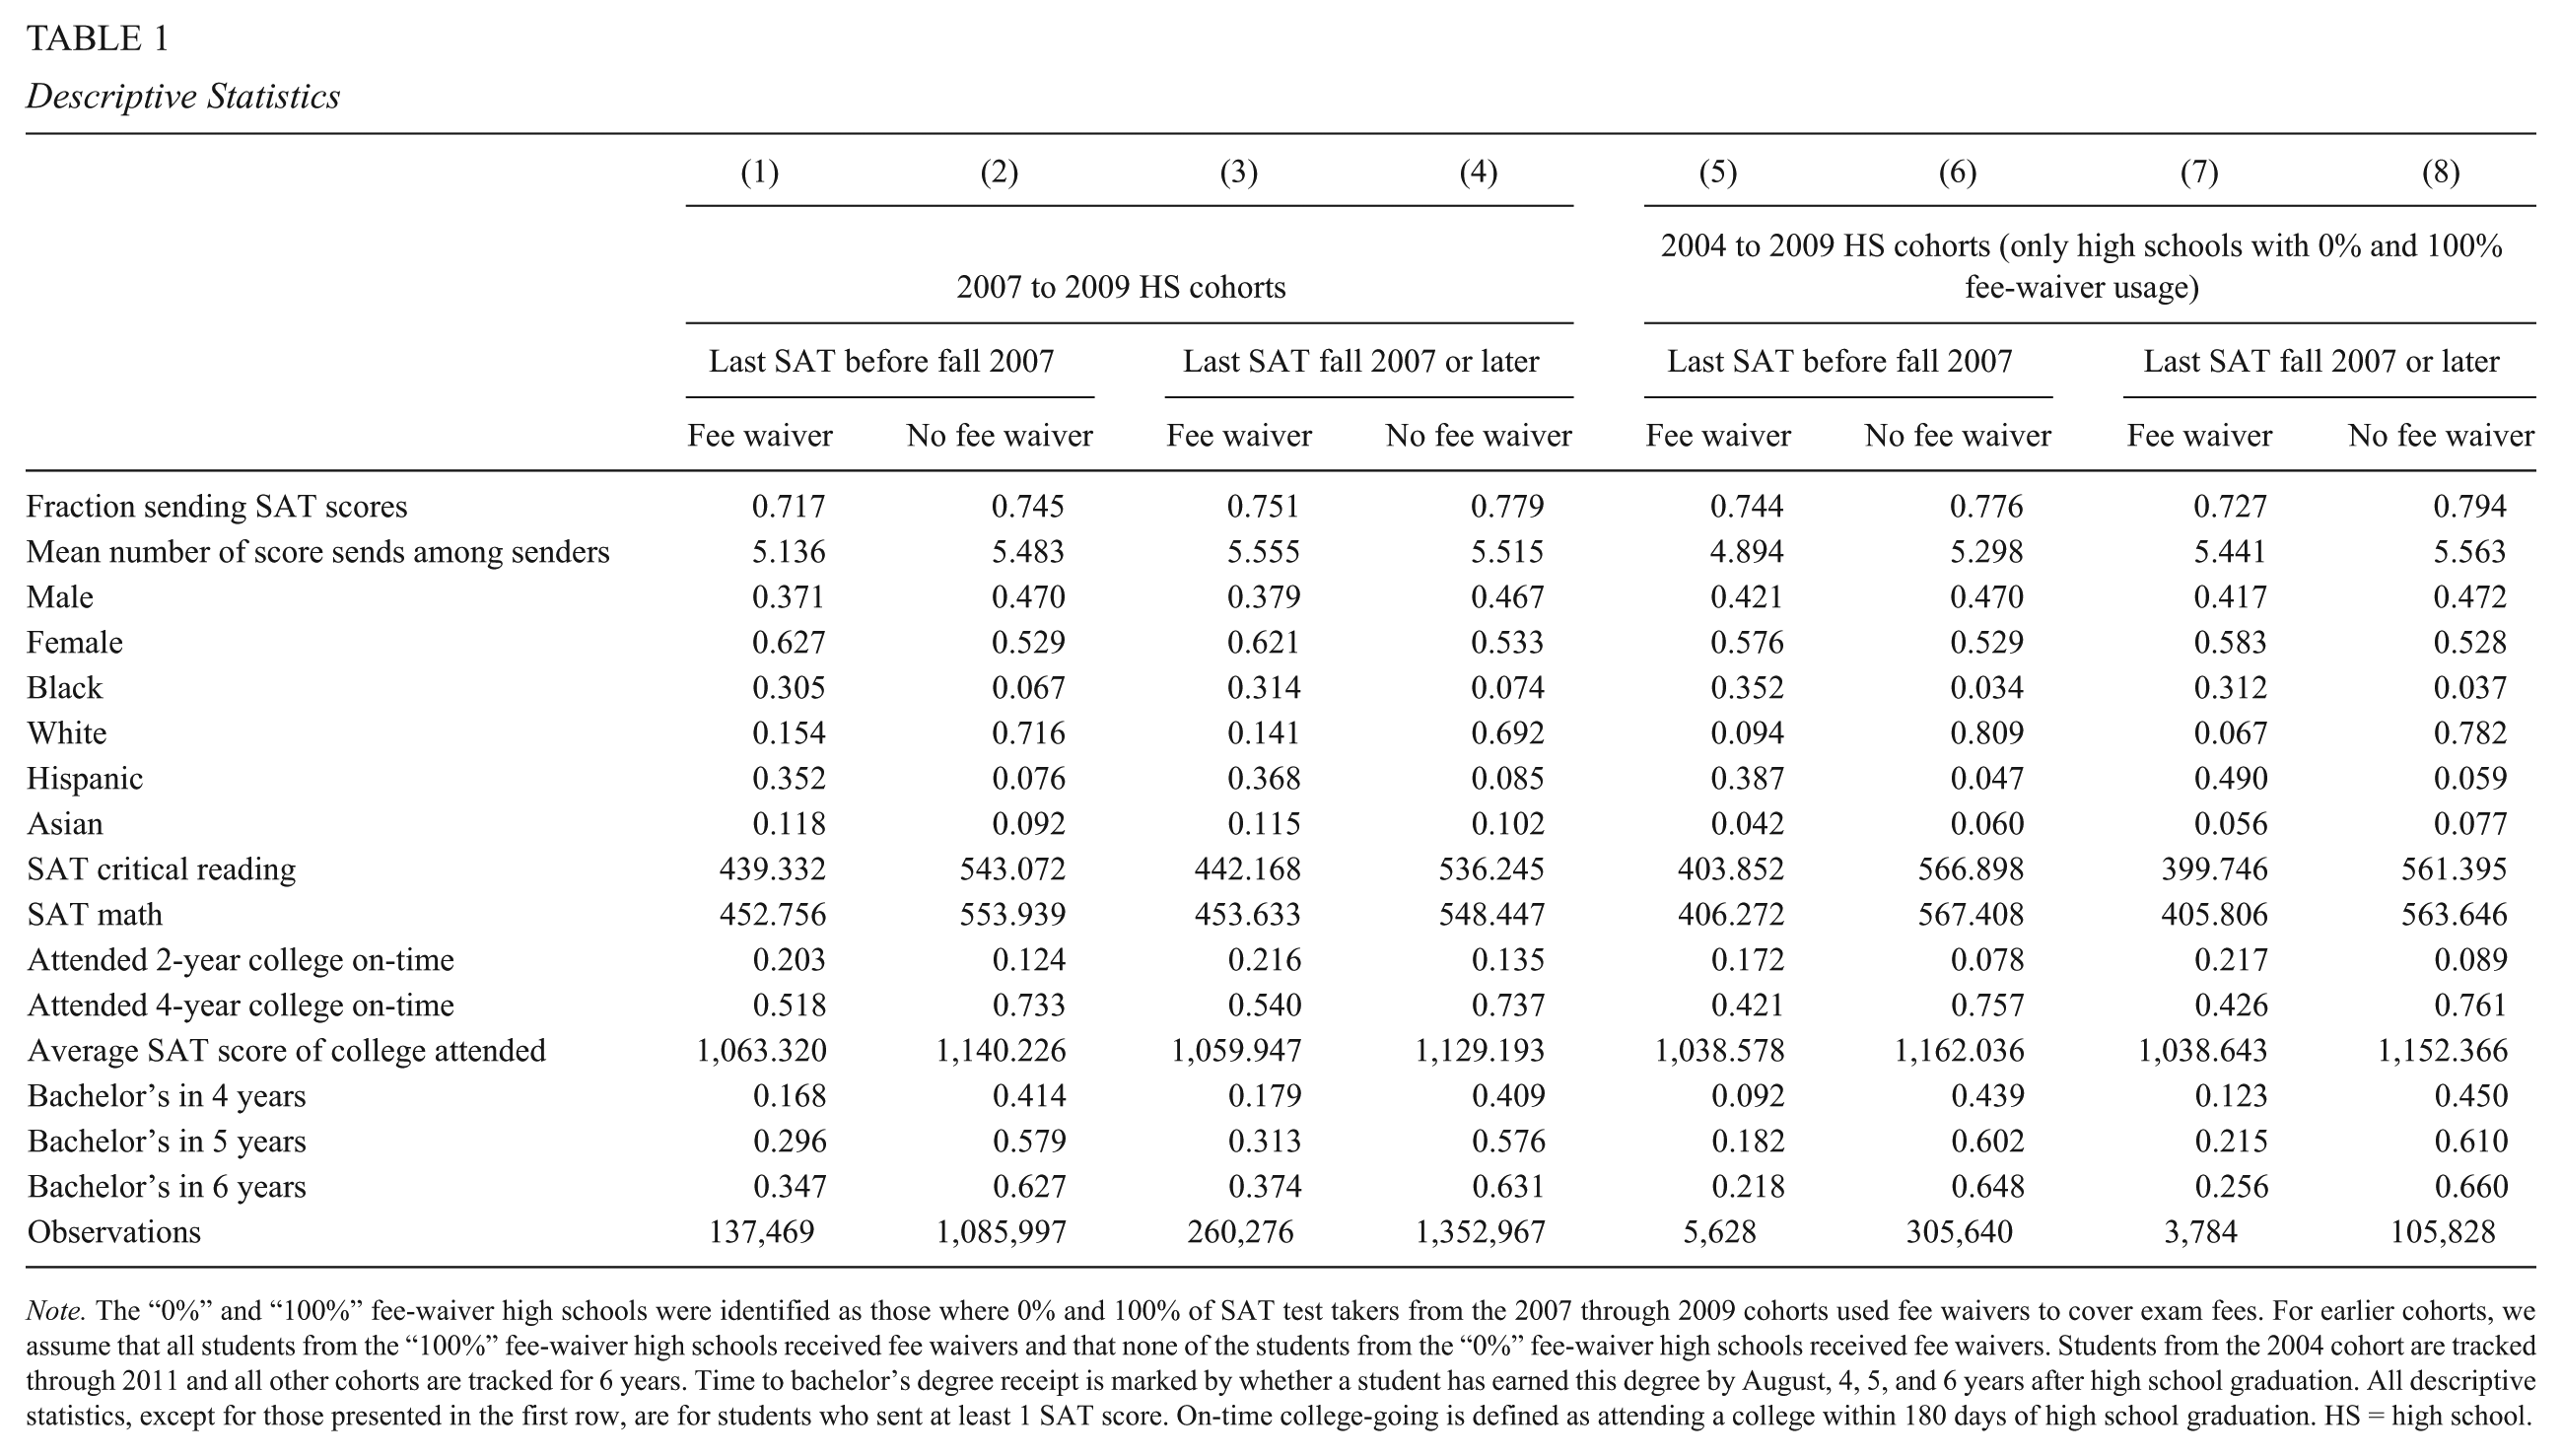
Note. The “0%” and “100%” fee-waiver high schools were identified as those where 0% and 100% of SAT test takers from the 2007 through 2009 cohorts used fee waivers to cover exam fees. For earlier cohorts, we assume that all students from the “100%” fee-waiver high schools received fee waivers and that none of the students from the “0%” fee-waiver high schools received fee waivers. Students from the 2004 cohort are tracked through 2011 and all other cohorts are tracked for 6 years. Time to bachelor’s degree receipt is marked by whether a student has earned this degree by August, 4, 5, and 6 years after high school graduation. All descriptive statistics, except for those presented in the first row, are for students who sent at least 1 SAT score. On-time college-going is defined as attending a college within 180 days of high school graduation. HS = high school.
Unsurprisingly, stark differences exist between fee-waiver users and non-fee-waiver users. In contrast to non-fee-waiver students, the majority of students using fee waivers belong to underrepresented minority groups. On the mathematics and the critical reading sections of the SAT, fee-waiver students score nearly 100 points (or a full standard deviation) lower than non-fee-waiver students. Fee-waiver students are nearly 20 percentage points less likely to a attend a 4-year college on-time (e.g., within 180 days of high school graduation); they attend colleges where the average matriculant performs worse on the SAT and is as much as 40 percentage points less likely to have earned a bachelor’s degree within 6 years of high school completion.
Despite these differences, the number of SAT score reports sent by these two groups is fairly similar. Among students from the 2007 through 2009 cohorts who last took the SAT prior to the flexible score report rollout (columns 1 and 2), the average number of score reports was 5.48 for non-fee-waiver students and 5.14 for students who took the exam using a fee waiver. After the flexible score report policy, the modest gap in score sends between these two groups vanished, and fee-waiver students modestly edged out non-fee-waiver students on this metric (columns 3 and 4). Comparing the score-sending statistics in the first four columns provides a preview of what we show through statistical models. After the policy shock, fee-waiver recipients increased their number of score reports by about 0.40 above and beyond the increase among non-fee-waiver students who were not eligible for the flexible score-send policy. 10
Impacts on Score Sending
In Table 2, we present results from fitting Equation 1 to the entire sample of score senders from the 2007 through 2009 cohorts. In addition, we present results from restricted subsamples of students from high schools with either consistently high fee-waiver use or no fee-waiver use to minimize inclusion of any students who pursued fee waivers in response to the flexible score report policy. In each of the samples, the addition of covariates and high school fixed effects minimally changes the parameter estimates. This serves as reassuring evidence that the composition of fee-waiver students and non-fee-waiver students are not changing over time in a way that might jeopardize the validity of our conclusions.
Impacts of the Four Free Flexible Score Sends on Score-Sending Behavior (2007–2009 Cohorts)
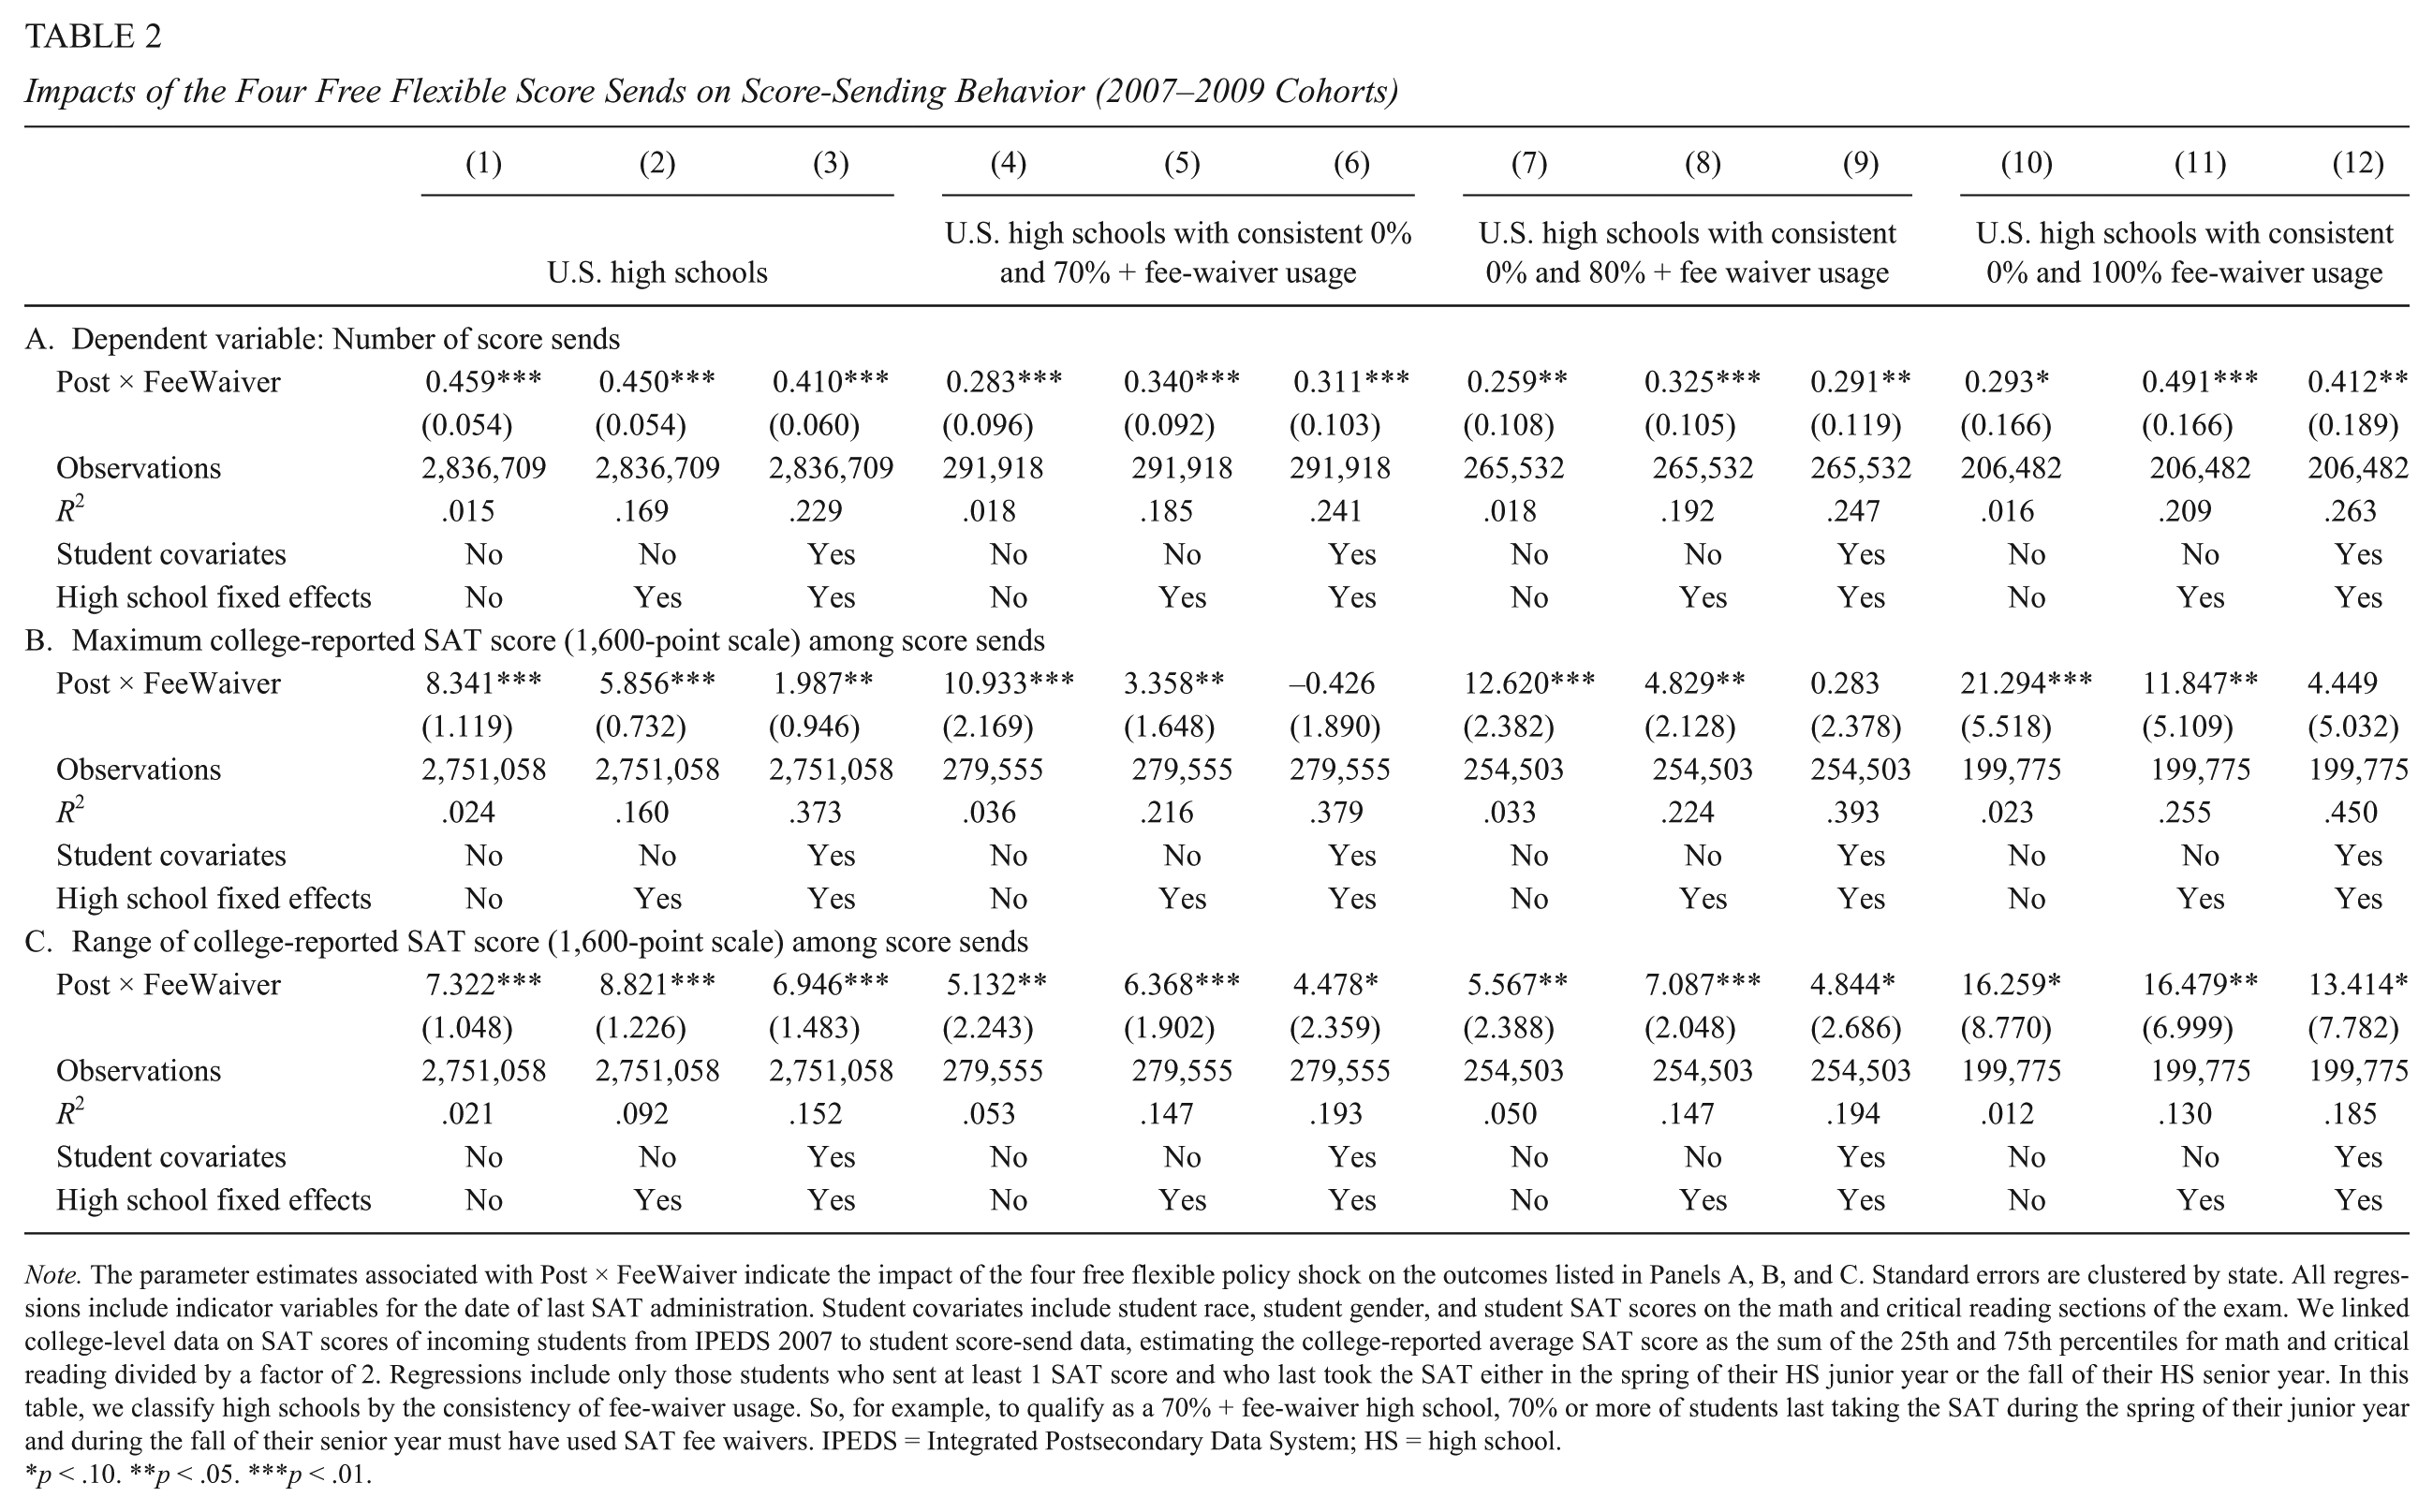
Note. The parameter estimates associated with Post × FeeWaiver indicate the impact of the four free flexible policy shock on the outcomes listed in Panels A, B, and C. Standard errors are clustered by state. All regressions include indicator variables for the date of last SAT administration. Student covariates include student race, student gender, and student SAT scores on the math and critical reading sections of the exam. We linked college-level data on SAT scores of incoming students from IPEDS 2007 to student score-send data, estimating the college-reported average SAT score as the sum of the 25th and 75th percentiles for math and critical reading divided by a factor of 2. Regressions include only those students who sent at least 1 SAT score and who last took the SAT either in the spring of their HS junior year or the fall of their HS senior year. In this table, we classify high schools by the consistency of fee-waiver usage. So, for example, to qualify as a 70% + fee-waiver high school, 70% or more of students last taking the SAT during the spring of their junior year and during the fall of their senior year must have used SAT fee waivers. IPEDS = Integrated Postsecondary Data System; HS = high school.
p < .10. **p < .05. ***p < .01.
The parameter estimates in Table 2, Panel A, indicate increases in the number of score sends from the flexible score report policy of about 0.4. Using the baseline data shown in Table 1, this increase translates to an 8% increase in score sends. Comparison of column 3 with column 12 reveals that fitted models using the entire sample of students generates a parameter estimate of the policy’s impact on score sending nearly identical to that for the subsample least susceptible to students maneuvering into the treatment group (i.e., using a fee waiver only to receive the flexible score report benefits). Any presence of students entering into the treatment group only to receive extra free score reports should lead to larger parameter estimates in the full sample than in the subsample containing only students from consistently 0% and 100% fee-waiver usage schools. We find no evidence of such strategizing.
In this table, we also offer some evidence that the characteristics of the institutions to which students sent their scores changed modestly as a result of the flexible score report policy. Panel B shows that the maximum average SAT score among all score sends increased by up to 20 points, though the significance and magnitude of this estimate are sensitive to both the sample selection and covariates incorporated into the model. As we favor models that include high school fixed effects and a comprehensive set of covariates, and estimates from these models are of the lowest magnitude, we conclude that the evidence in Table 2 does not support strong conclusions about shifts in the types of colleges students targeted with additional score sends. Despite the highly significant estimates that some models yield, we argue that even the largest point estimates in Panel B are of limited substantive significance. For example, the 20-point difference in SAT scores referenced above is equivalent to the difference in SAT scores between matriculating students at Harvard and MIT. There exists greater consistency in terms of statistical significance in Panel C, yet the changes in range between the highest and lowest SAT scores within a student’s score-send portfolio are of similar magnitudes to those in Panel B and similarly lack substantive significance. Our largest estimates in Panel B (approximately 20 SAT points) are roughly equivalent to the 0.5 ACT point boost that Pallais documents after ACT’s increase in the default number of score sends. Our estimates on range of SAT scores (Panel C) are smaller than the comparable estimates that Pallais presents of about 0.9 ACT points. 11
In Table 3, we show changes in the distribution of the number of score reports using the 2007 to 2009 sample as well as the expanded 2004 to 2009 cohort sample containing only students from 0% and 100% usage high schools. 12 We further divide the sample into SAT terciles based on the SAT scores of students in the 100% fee-waiver usage schools between 2004 and 2009. We motivate the discussion of this table by graphing the distribution of score sends for fee-waiver and non-fee-waiver students in both the pre- and postpolicy shock periods (Figure 1).
Impacts on Distribution of Number of Score Sends
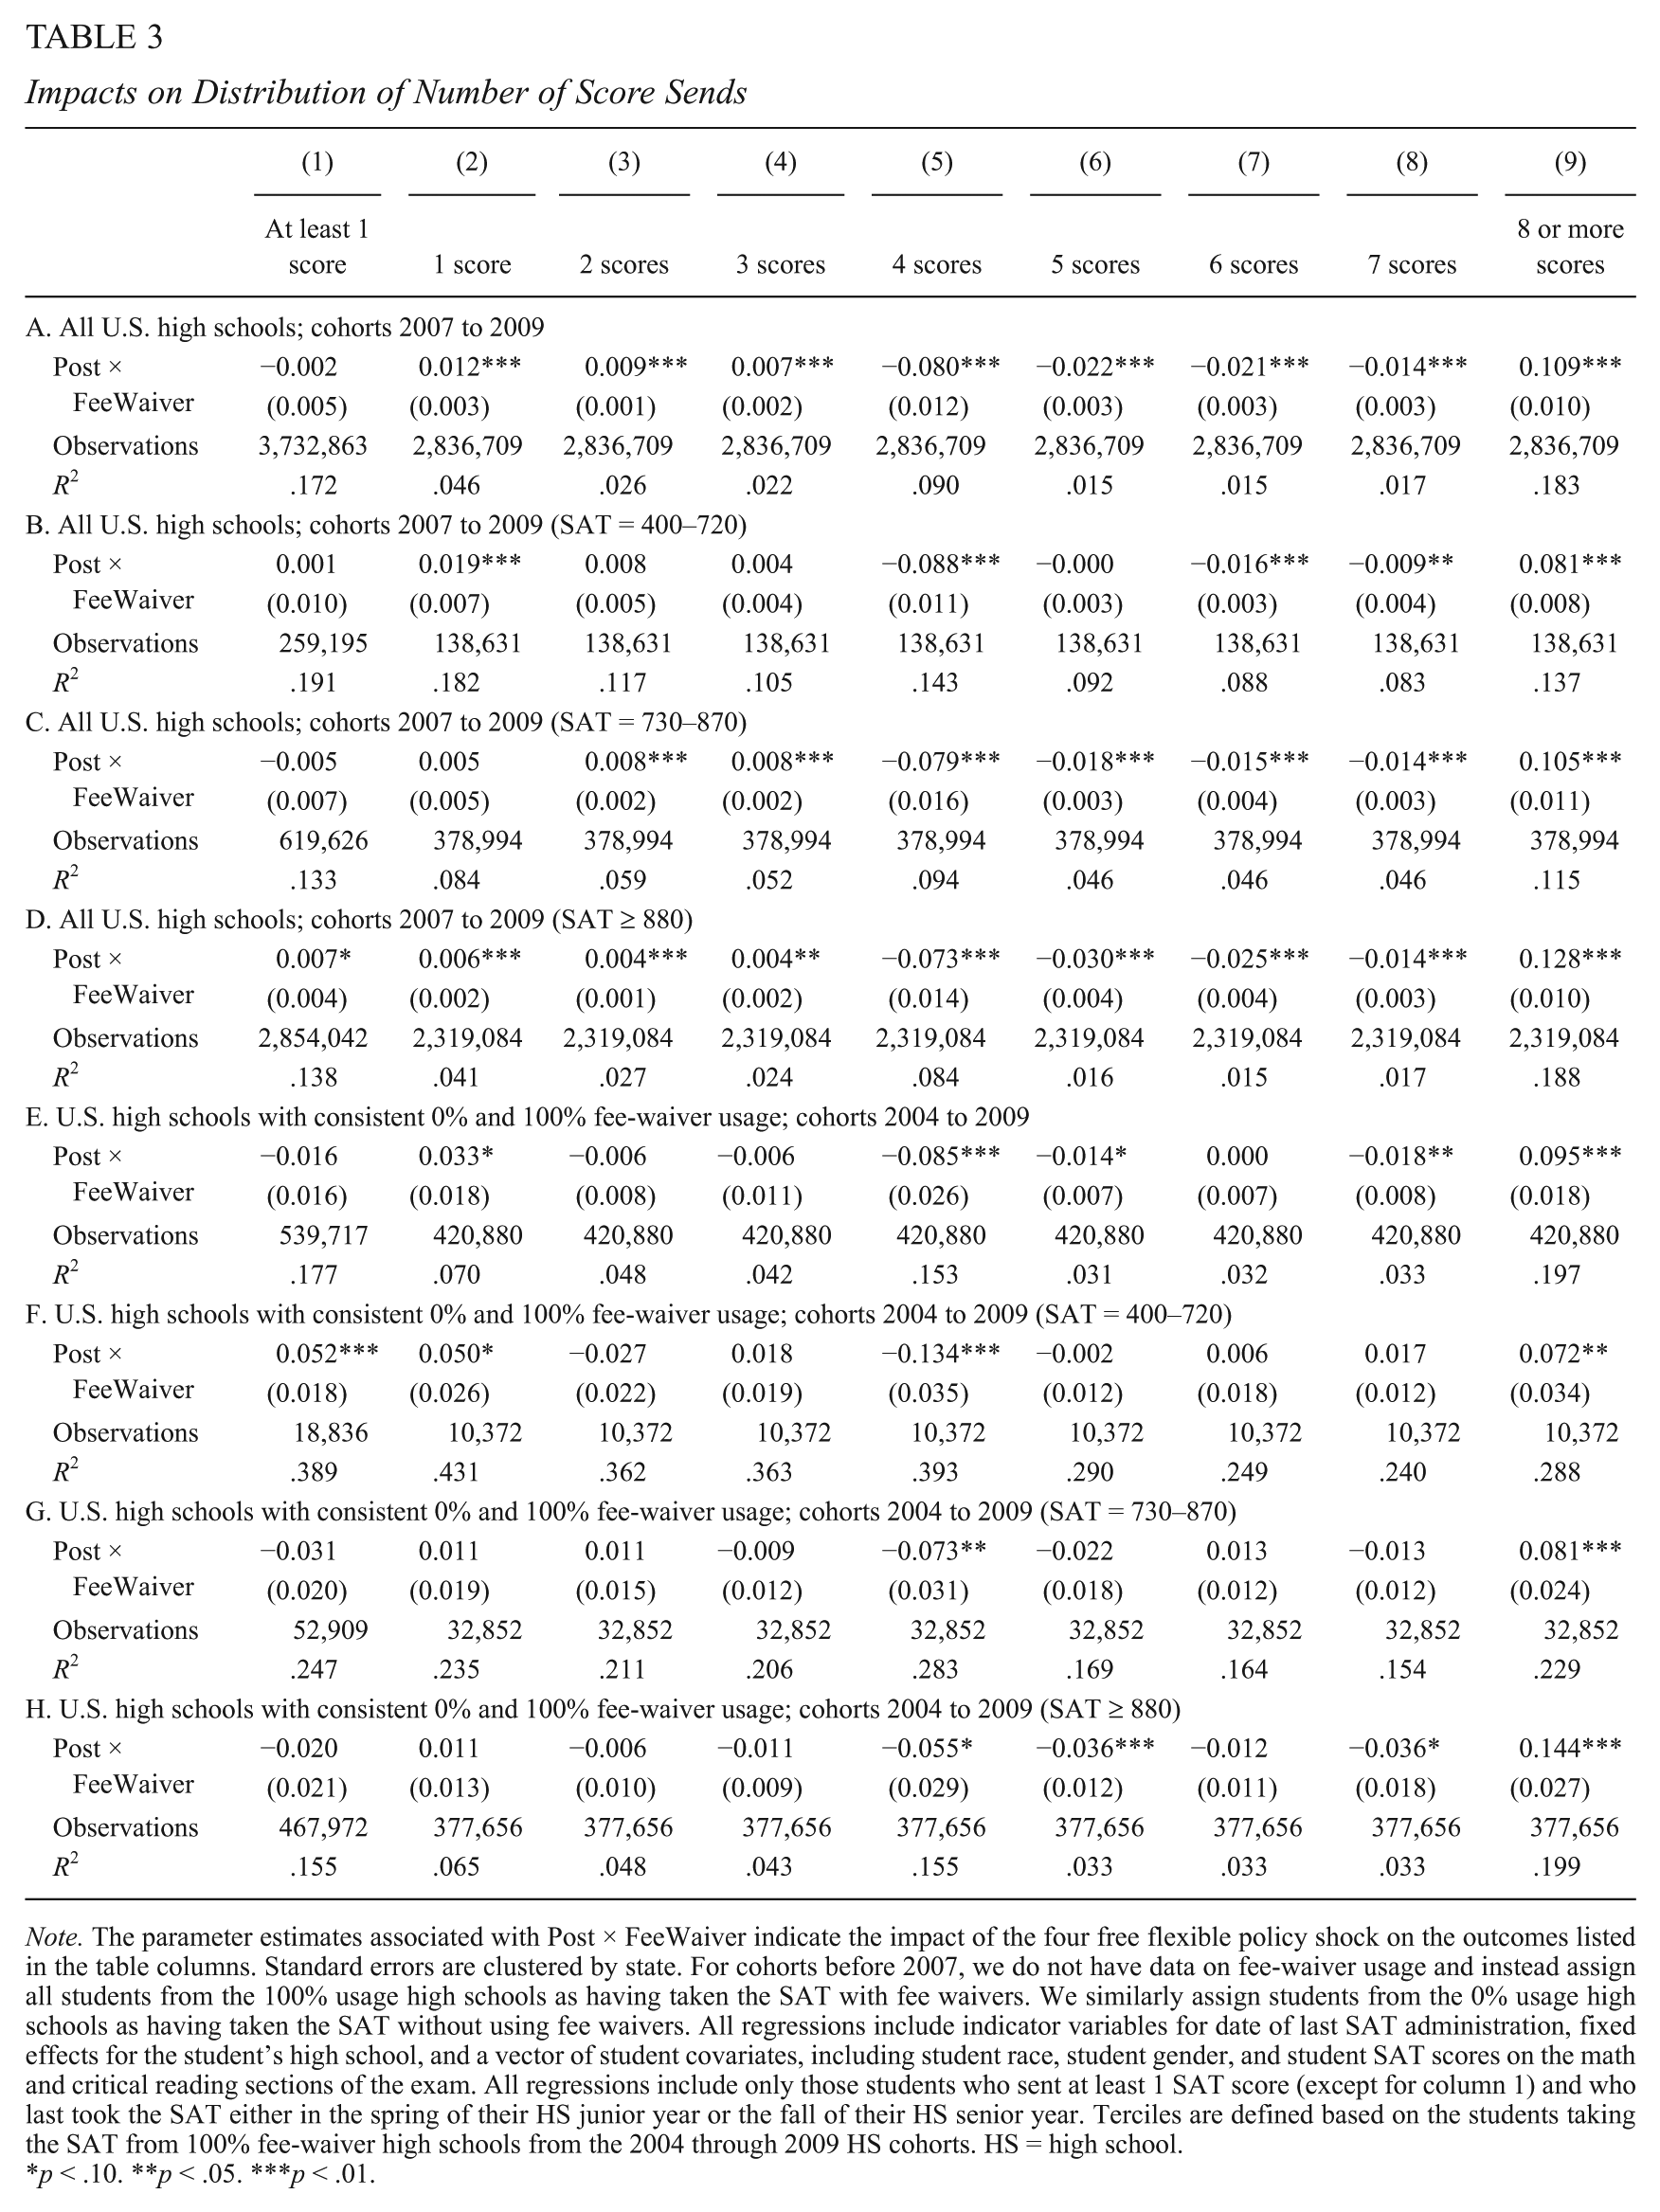
Note. The parameter estimates associated with Post × FeeWaiver indicate the impact of the four free flexible policy shock on the outcomes listed in the table columns. Standard errors are clustered by state. For cohorts before 2007, we do not have data on fee-waiver usage and instead assign all students from the 100% usage high schools as having taken the SAT with fee waivers. We similarly assign students from the 0% usage high schools as having taken the SAT without using fee waivers. All regressions include indicator variables for date of last SAT administration, fixed effects for the student’s high school, and a vector of student covariates, including student race, student gender, and student SAT scores on the math and critical reading sections of the exam. All regressions include only those students who sent at least 1 SAT score (except for column 1) and who last took the SAT either in the spring of their HS junior year or the fall of their HS senior year. Terciles are defined based on the students taking the SAT from 100% fee-waiver high schools from the 2004 through 2009 HS cohorts. HS = high school.
p < .10. **p < .05. ***p < .01.
The left panel in Figure 1 depicts a sharp decline in the fraction of fee-waiver students sending exactly four score reports after the enactment of the flexible fee-waiver policy. This decline is primarily offset by a spike in the fraction of students sending exactly 8 score reports, with smaller positive changes in the fraction of students sending more than 8 score reports. In the right-hand panel of Figure 1, we show changes in the distribution of score sends among non-fee-waiver students who did not benefit from the flexible score report policy. Among these students, there was a considerably smaller decline in the share of students sending exactly 4 score reports, balanced out by tiny increases in the fraction of students sending 5, 6, or 7 score reports. This group experienced no change in the fraction of students sending 8 score reports. In Figure 2, we show that the reshuffling of score-send counts were somewhat more pronounced among those with top tercile SAT performance, for example, students with SAT scores at or exceeding 880.
Distribution of score sends, by tercile of SAT performance, fee-waiver use, and policy exposure.
The DID parameter estimates in which we estimate changes in the distribution of score reports due only to the flexible score policy by netting out the changes among non-fee-waiver students clearly show that about 10% of fee-waiver students increased the number of score sends from four to eight. The declines in the fraction of students sending exactly four reports (Table 3, column 5) ranges from about 6 to 13 percentage points and are offset by increases in the fraction of students sending eight or more score reports of 7 to 14 percentage points. A smattering of smaller, but highly statistically significant negative coefficients also exist for models estimating outcomes of exactly 5, 6, and 7 score sends, suggesting that even students who were not simply using the default 4 score reports took advantage of the opportunity to send more scores.
Figures 1 and 2 and Table 3 also reveal that the flexible score report policy had considerably smaller, but statistically significant, positive, impacts on the percentage of students sending exactly 1, 2, and 3 scores. The flexible score report policy relaxed some of the pressure on students to send SAT scores to colleges at the time of registration. Some students may have planned to send more score reports after learning their SAT scores, but opted against such actions after discovering that their previous college aspirations were unrealistic. The fact that impacts of the highest magnitude are localized among students with the lowest SAT scores adds some credence to this conjecture. Alternatively, some students intending to send SAT scores after the window for free registration score sends had closed may simply have forgotten to follow through with their intentions.
Finally, in column 1 of Table 3, we present evidence that the change in the score-sending policy had virtually no impact on whether students sent any SAT scores, confirming our earlier decision to focus on those students who sent any scores both before and after the policy shock.
College Enrollment and Completion
In Table 4, we show DID estimates of the flexible score report’s impact on college attendance and completion using the overall sample (Panel A) and samples restricted only to those students least likely to alter their fee-waiver status in response to the policy (Panels B–D). All four panels convey similar stories. The policy shock increased on-time college-going rates, defined as enrolling in college within 180 days of high school graduation, by 2 to 4 percentage points (column 2), and all models (except for Panel D) suggest that the majority of this increase was driven by students enrolling at 4-year colleges (column 4). Consistent with the previously discussed finding that this policy shock had at most a minor effect on the characteristics of the colleges to which students sent scores, we find no statistically significant changes in the average SAT scores of the colleges in which students enrolled (column 5). This finding, however, does not allow us to discount the possibility that some students may have shifted from institutions with lower to higher average SAT scores. Students on the margin of college attendance whose decisions were ultimately tipped by the shift in the score-send policy likely enrolled in less selective institutions; this may have muted any effects of other students switching into institutions with higher average SAT scores. In column 6 of Table 4, we show evidence of a small effect on upward shifting, with students one half of a percentage point more likely to enroll in colleges in the top two Barron’s categories (Most Competitive and Highly Competitive).
Impacts of the Four Free Flexible Score Sends on College Enrollment/Completion (2007–2009 Cohorts)
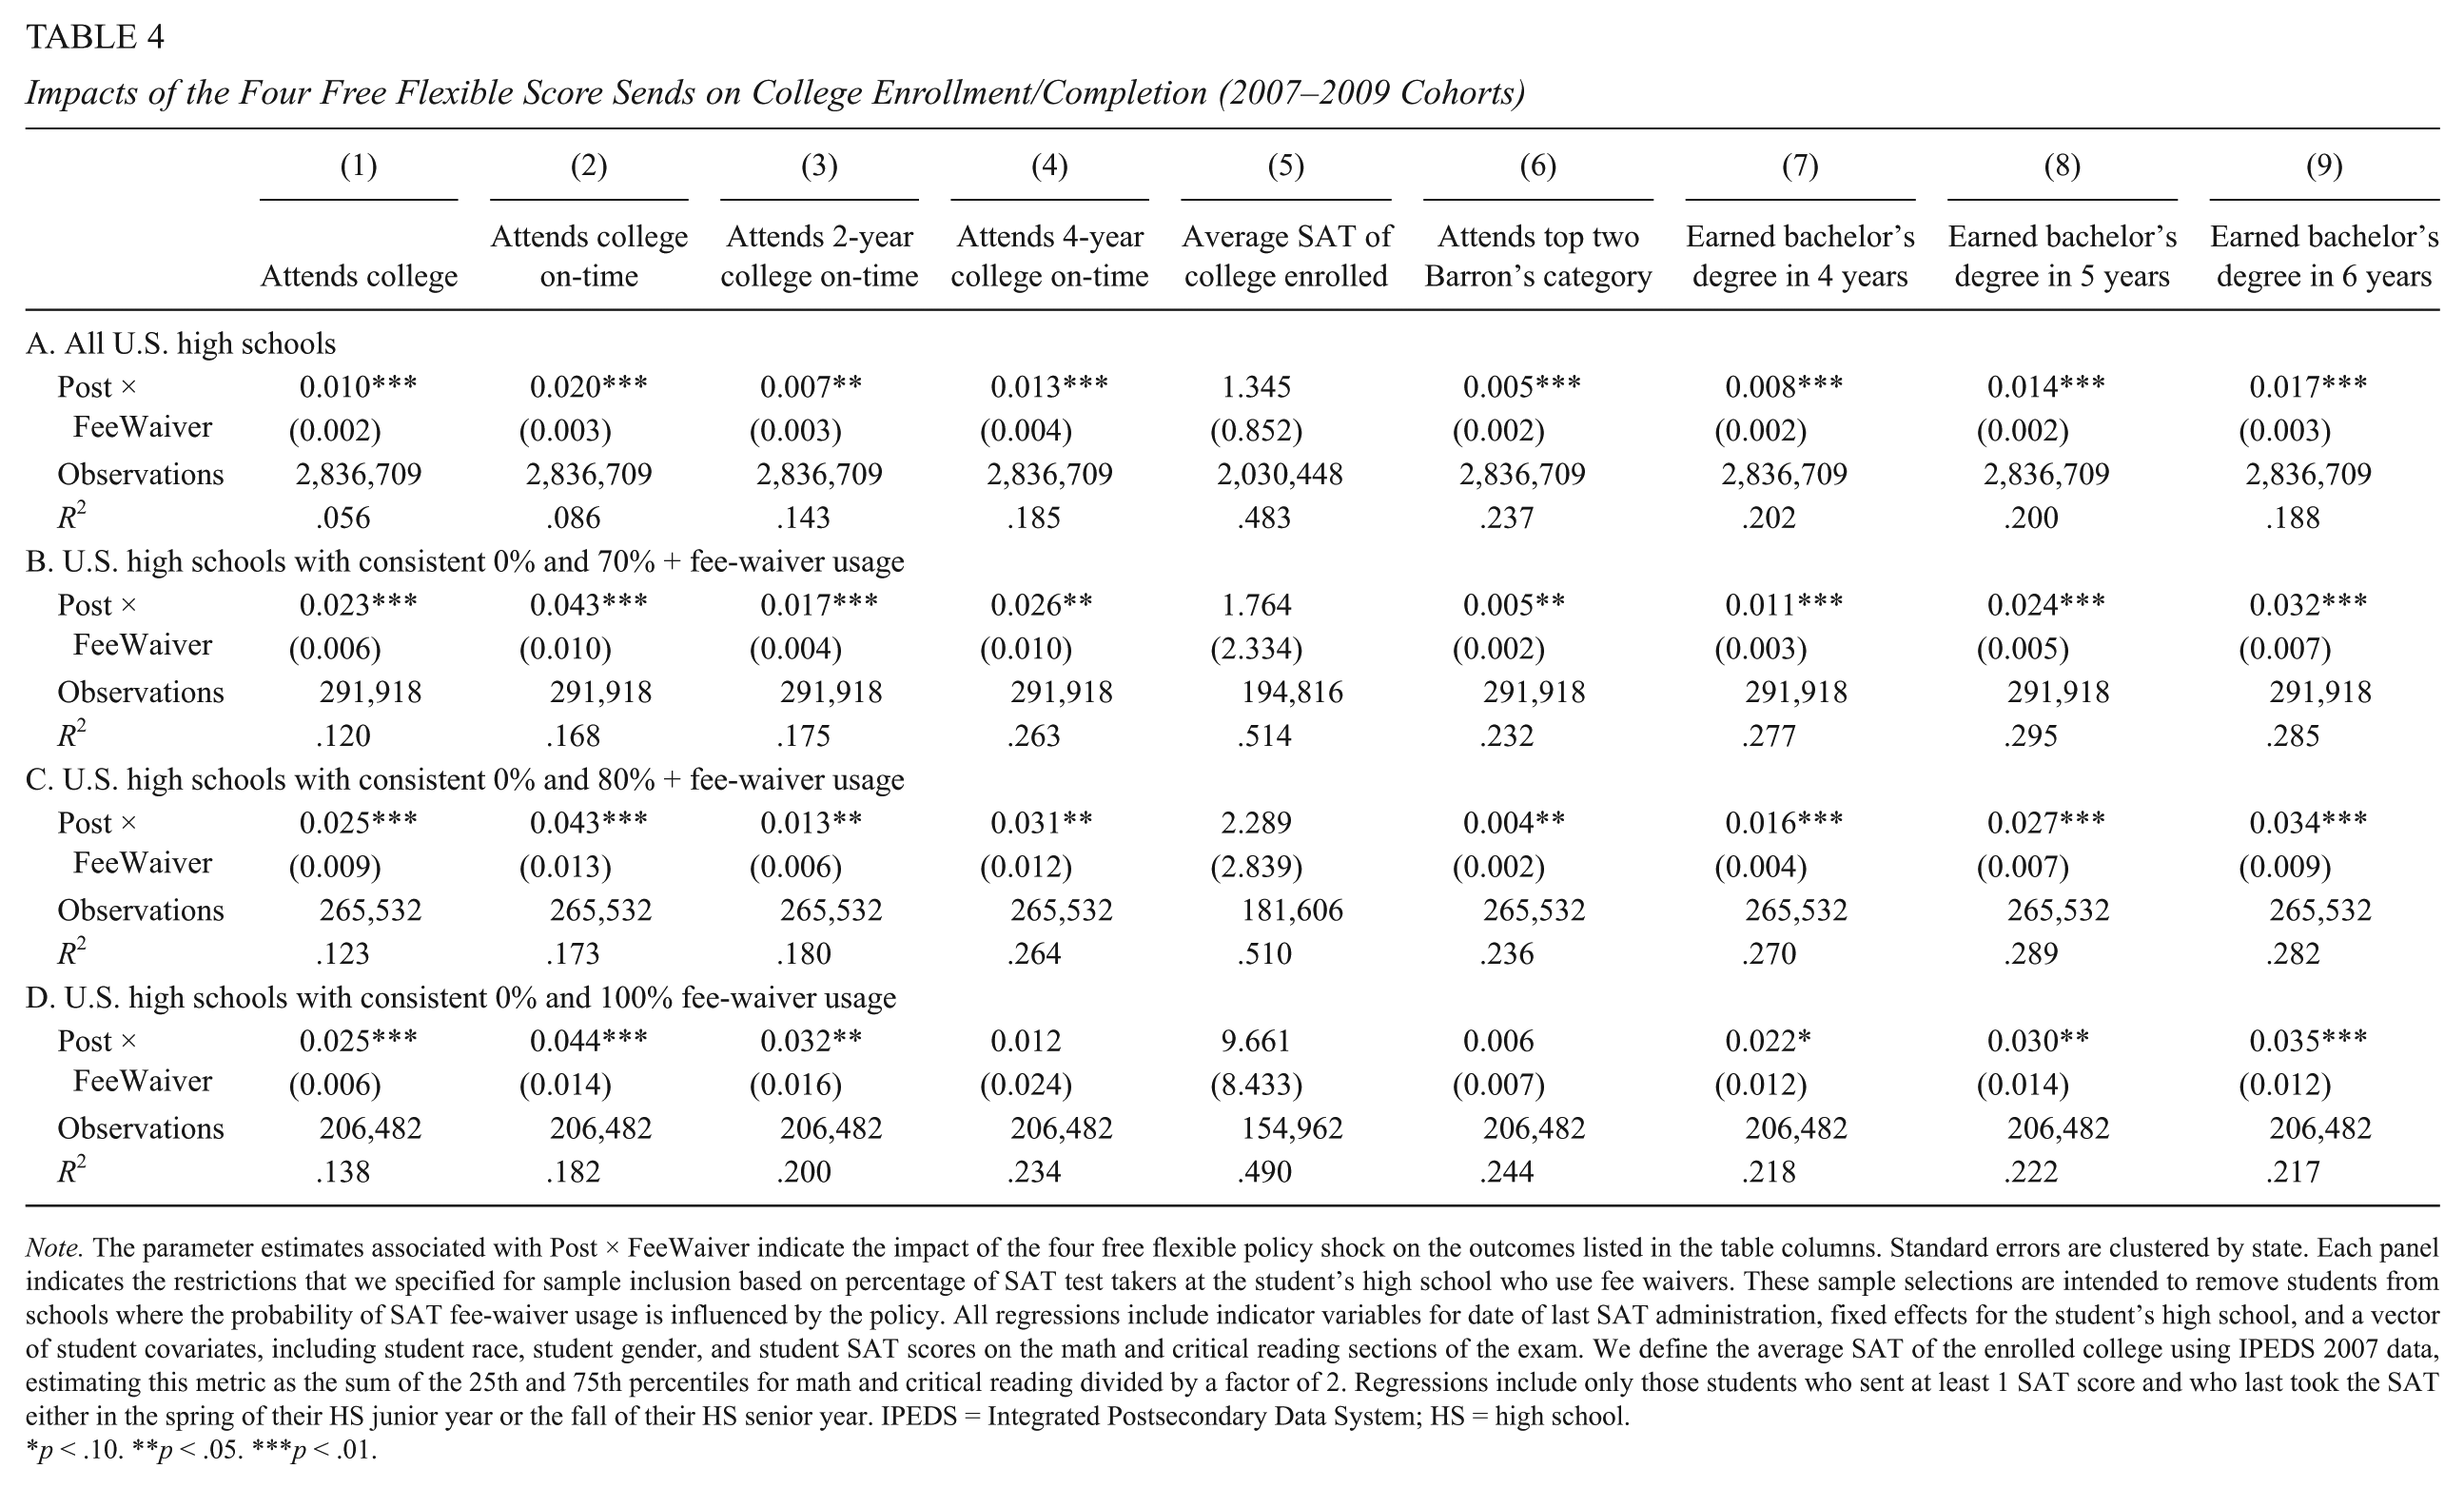
Note. The parameter estimates associated with Post × FeeWaiver indicate the impact of the four free flexible policy shock on the outcomes listed in the table columns. Standard errors are clustered by state. Each panel indicates the restrictions that we specified for sample inclusion based on percentage of SAT test takers at the student’s high school who use fee waivers. These sample selections are intended to remove students from schools where the probability of SAT fee-waiver usage is influenced by the policy. All regressions include indicator variables for date of last SAT administration, fixed effects for the student’s high school, and a vector of student covariates, including student race, student gender, and student SAT scores on the math and critical reading sections of the exam. We define the average SAT of the enrolled college using IPEDS 2007 data, estimating this metric as the sum of the 25th and 75th percentiles for math and critical reading divided by a factor of 2. Regressions include only those students who sent at least 1 SAT score and who last took the SAT either in the spring of their HS junior year or the fall of their HS senior year. IPEDS = Integrated Postsecondary Data System; HS = high school.
p < .10. **p < .05. ***p < .01.
The final three columns in Table 4 show the DID estimates on college completion. In all specifications, parameter estimates on the percentage of students earning bachelor’s degrees with 4, 5, or 6 years of high school graduation are positive and statistically significant. The magnitude of impact on bachelor’s completion within 4 years is about 1 to 2 percentage points, within 5 years is 1.4 to 3, and within 6 years is 1.7 to 3.5 percentage points.
Some of these completion effects are obviously attributable to the observed increases in on-time college attendance presented in column 2, though the completion impacts are too large to be driven only by the influx of students into the college pipeline. For the boost in completion to be determined solely by the shifts on enrollment margins, roughly 85% of the students induced to enroll would need to complete their bachelor’s degrees within 6 years. 13 If we made the generous assumption that induced students entered college with an average math and verbal combined SAT score of 880, about 43% would be expected to earn bachelor’s degrees within 6 years. 14 As no overwhelming shifts in college enrollment characteristics are evident, these surprisingly large completion impacts may reflect improvements in college nonacademic fit. With more score reports sent to colleges, fee-waiver students may benefit from an expanded set of college options once they receive college acceptances. New college options might include affordable alternatives, academic programs that are better aligned with the students’ interests, locations that students find more palatable, and other features of college fit uncertain at the time of college application (e.g., Smith, 2013). All of these factors could favorably influence completion.
In Table 5, we disaggregate college attendance and completion by terciles of student SAT performance. These results incorporate all students from the 2007 through 2009 cohorts, and we include Appendix Tables A2 and A3 (available in the online version of the journal) that separately present these parameter estimates for the 2004 through 2009 cohorts (0% and 100% fee-waiver sample) and again for the 2007 through 2009 cohorts (0% and 100% fee-waiver sample). All results are robust to the alternate sample restrictions in these online appendix tables.
Impacts of the Four Free Flexible Score Sends on Score-Sending/Enrollment/Completion (2007–2009 Cohorts), by Student SAT Scores—All High Schools
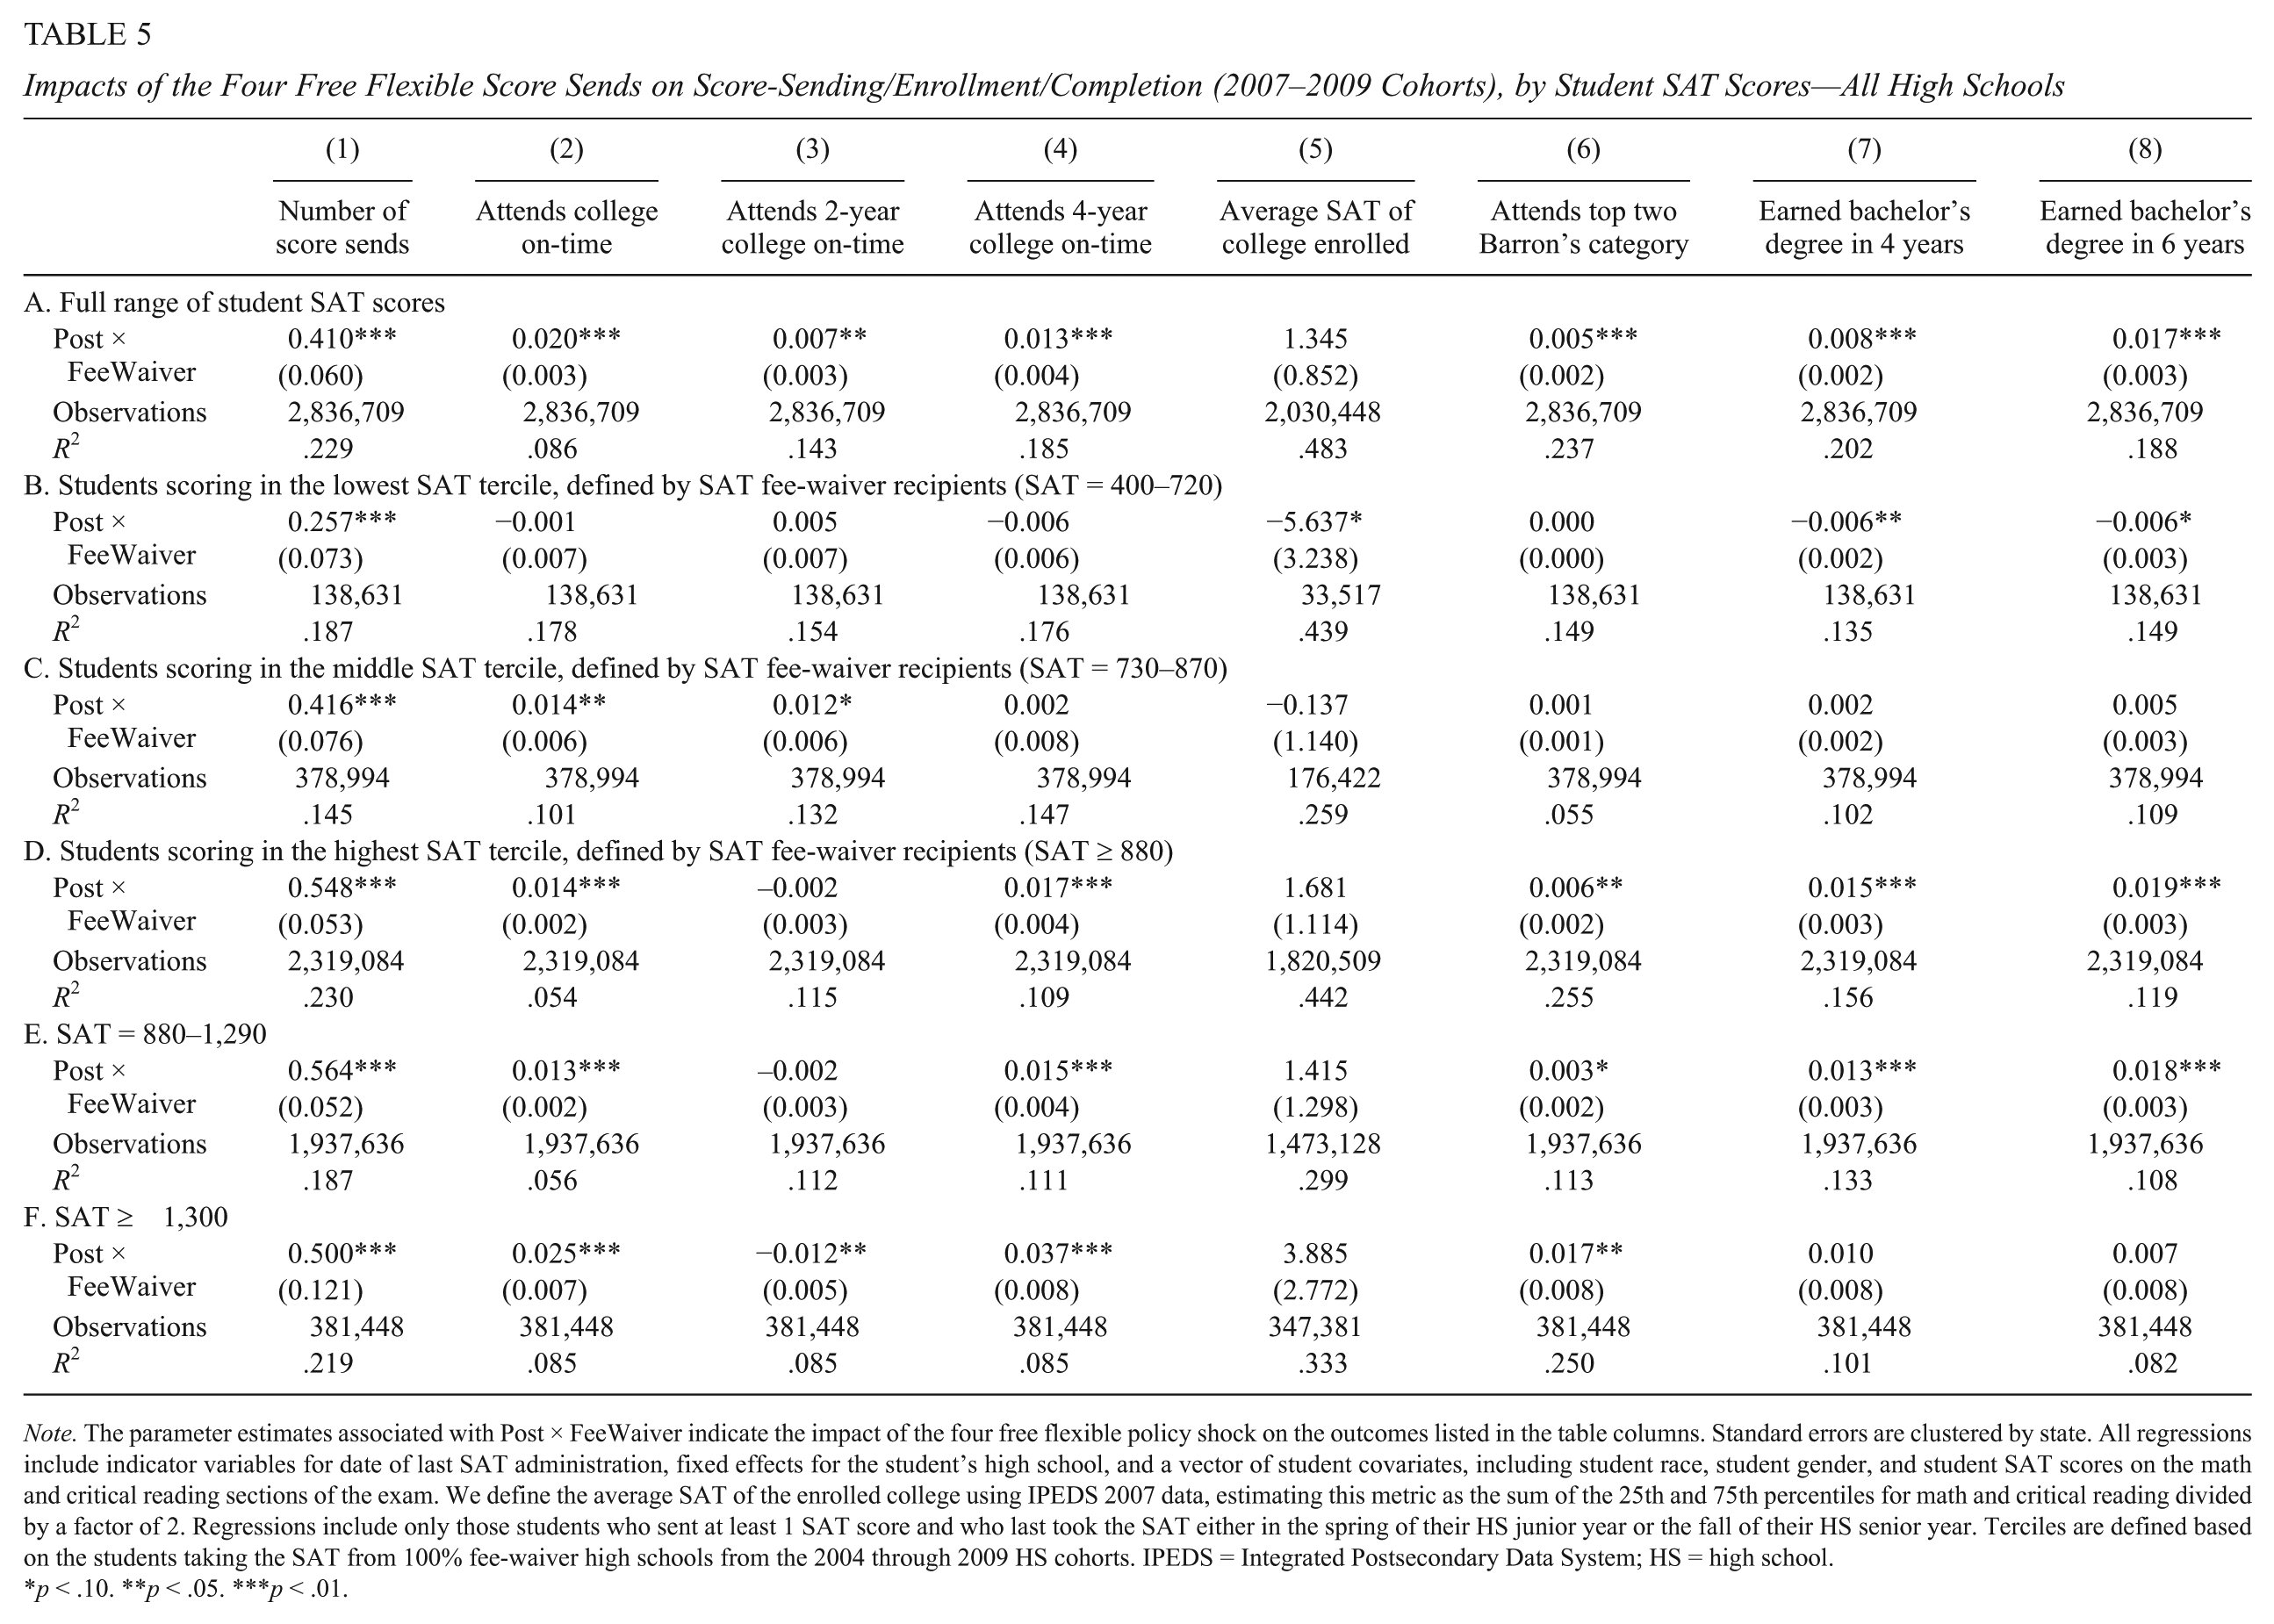
Note. The parameter estimates associated with Post × FeeWaiver indicate the impact of the four free flexible policy shock on the outcomes listed in the table columns. Standard errors are clustered by state. All regressions include indicator variables for date of last SAT administration, fixed effects for the student’s high school, and a vector of student covariates, including student race, student gender, and student SAT scores on the math and critical reading sections of the exam. We define the average SAT of the enrolled college using IPEDS 2007 data, estimating this metric as the sum of the 25th and 75th percentiles for math and critical reading divided by a factor of 2. Regressions include only those students who sent at least 1 SAT score and who last took the SAT either in the spring of their HS junior year or the fall of their HS senior year. Terciles are defined based on the students taking the SAT from 100% fee-waiver high schools from the 2004 through 2009 HS cohorts. IPEDS = Integrated Postsecondary Data System; HS = high school.
p < .10. **p < .05. ***p < .01.
In the first column of Table 5, we show an intriguing relationship between the policy’s impact on average number of score reports and student academic ability, as measured by SAT scores. Most notably, the policy impact tends to be larger among students of higher academic ability. For students in the 400 to 720 SAT score range, the flexible score report policy increased the average score reports sent by 0.26. Among students with SAT scores at or exceeding 880, the impact was more than twice as large. The policy induced these relatively higher achieving students to send approximately 0.55 more score reports to colleges, on average. Appendix Tables A2 and A3 (available in the online version of the journal) suggest that our main specifications may actually represent a lower bound on the differential policy impact between relatively higher and relatively lower achieving students. When we restrict the sample to only those high schools with consistently 0% or consistently 100% usage, we estimate average impacts on volume of score reports in the vicinity of 0.9 for relatively higher achieving students (e.g., Appendix Table A2, Panel D, column 1, available in the online version of the journal). This is on par with the intent-to-treat impact of the Expanding College Opportunity intervention on actual college applications (Hoxby & Turner, 2013, Table 1).
Perhaps unsurprisingly, we find that the overall policy impact on 4-year college-going is driven entirely by students in the highest SAT tercile (Table 5, column 4). These students have the academic qualifications for admissibility to at least some 4-year institutions that are primarily baccalaureate granting. Students with slightly lower academic qualifications (SAT scores between 730 and 870) would be less compelling candidates to 4-year institutions, and so increased score sending would be less likely to translate into a heightened probability of 4-year college attendance for such students.
As with college-going, the positive bachelor’s completion effects of the policy are limited only to the students with SAT scores at or above 880. For these relatively higher achieving students, the policy impacts on 4- and 6-year bachelor’s completion are 1.5 and 1.9 percentage points, respectively, both of which are virtually identical to the impact on 4-year college-going. For completion effects to be driven entirely by the marginal students drawn into the 4-year college pipeline, every single one of these marginal students would need to complete their bachelor’s degrees within 4 years. This scenario is highly unrealistic. Under the generous assumption that 37% of these relatively high-achieving induced students earn a bachelor’s degree in 4 years and 65% earn a bachelor’s degree in 6 years, about 40% of the overall completion effects in Table 5 remain unexplained by the shifting college enrollment behavior. 15
For the relatively higher achieving students, there was no impact on the average institutional SAT scores of the colleges where they matriculated; however, there was a modest impact of 0.6 percentage points on the probability of attending a college in the top two Barron’s selectivity categories. Students are substituting more selective colleges for less selective ones, but the magnitude of this shifting suggests only second-order contributions to the increases in bachelor’s completion rates. To give a concrete example, if about 0.6% of students shift upward into colleges where the probability of bachelor’s completion increases by one third, overall bachelor’s completion rates would only increase by 0.2 percentage points. Instead, for this group of students in particular, a substantial fraction of the bachelor’s completion impact may be driven by improvements in nonacademic fit.
The Expanding College Opportunities (ECO) Project, initiated by Caroline Hoxby and Sarah Turner (2013), has provided compelling evidence that very high-achieving low-income students engage in suboptimal college search processes and that these processes can be improved through low-cost nudges, such as the provision of free college application fee waivers and semicustomized lists of potential colleges to consider. These students who have SAT scores—or the ACT equivalent—of 1,300 (mathematics and critical reading combined) or higher would be highly desirable candidates for admission at virtually all postsecondary institutions across the nation. Expanding a student’s college search horizon to include more selective colleges, colleges that offer more generous financial aid packages and colleges that better match the student’s extracurricular and academic interests, is only effective if colleges are willing to enroll the student. As the highest achieving students are least likely to confront this issue, they stand to gain the most from expanded college opportunities.
In the bottom two panels of Table 5, we further parse the relatively higher achieving students into two groups: higher achieving non-ECO eligible students (e.g., those with SAT scores between 880 and 1,290) and ECO-eligible students with SAT scores at or above 1,300. As relatively few fee-waiver students achieve SAT scores in the 1,300+ range, estimates from this subgroup are less precise. Nevertheless, Table 5 demonstrates that ECO-eligible students experienced the largest benefits in terms of college enrollment and college choice from the flexible score report policy. These very high-achieving students experienced a 3.7 percentage point increase in the probability of enrolling at a 4-year college on-time and a 1.7 percentage point increase in the probability of enrolling at college in the top two Barron’s categories. As the baseline 4- and 6-year bachelor’s completion rates for these very high-achieving fee-waiver students were already higher than their lower achieving peers, there is less room for the policy to move the needle on these college completion metrics. 16 The completion parameter estimate for these students is about 1.4 percentage points, but estimated imprecisely. Collectively, the evidence in this table is consistent with Hoxby and Turner’s (2013) conclusions that the highest achieving low-income students are particularly receptive to nudges to improve college search and selection. Furthermore, our results show that nudges can benefit college-eligible students who are not as high performing as the ECO students.
Threats to Validity
We identify several potential threats to the validity of our findings and provide additional evidence to rule out each threat as an unlikely source of bias. The first threat impacts virtually all empirical studies that use a DID analytic framework. Namely, the integrity of the causal interpretation of our results hinges on the assumption that trends in all outcomes for the non-fee-waiver group serve as accurate counterfactuals for the trends that would have occurred among fee-waiver students had the flexible score policy not been implemented. Two major changes occurred during this study’s time frame that have the potential to disrupt parallel trends between the lower income fee-waiver students and their better-off peers who took the SAT without a fee waiver. First, the economic upheaval caused by the Great Recession had the potential to induce college-going among individuals who otherwise might have entered the labor market after high school graduation (Barr & Turner, 2013). A differential impact of the Great Recession by student socioeconomic status could jeopardize the assumption of parallel trends. Second, and closely related, enhanced participation in and generosity of the federal Pell grant program beginning in the 2009–2010 academic year (Baum & Payea, 2013) may have boosted college access or retention among the low-income students eligible to receive this grant aid.
Regarding the Great Recession, Long (2015) shows that the resulting increase in postsecondary participation primarily occurred among individuals not of traditional college age. The economic downturn induced nontraditional students to return to higher education and workforce training. These nontraditional students are not included in our analyses, thus allaying concerns over this particular potential threat. Of course, despite compelling evidence that, as a whole, traditionally aged college students did not shift into higher education as a result of the economic downturn, there is still a risk that overall patterns might conceal differing responses between higher income and lower income individuals. To investigate this further, we recreate Panel A of Table 4 for two subsets of students: those residing in states with the largest upticks in unemployment during the Great Recession and those residing in states with the mildest increases in unemployment. We use the state categorization implemented by Long (2015) to conduct these sensitivity analyses. 17 If unemployment shocks from the Great Recession differentially impacted higher income and lower income students, we might expect parameter estimates to differ between models fitted from students residing in high unemployment growth states and those fitted to students from low unemployment growth states.
In Panels A and B of Table 6, we show that model parameter estimates are nearly identical when students are separated into groups based upon the state-level severity of the Great Recession’s impact on unemployment. In column 1, we show that the flexible score report policy increased total scores sent by 0.48 in the high recession impact states and 0.32 in the low recession impact states. Both of these estimates differ significantly from zero, though they do not differ significantly from each other. The remaining columns in Panels A and B demonstrate that parameter estimates on college-going and completion are similar between the two subsamples. Collectively, these results provide evidence that the simultaneity of the Great Recession is not a compelling threat to validity in these analyses.
Threats to Validity From Great Recession and Pell Expansion (2007–2009 Cohorts)
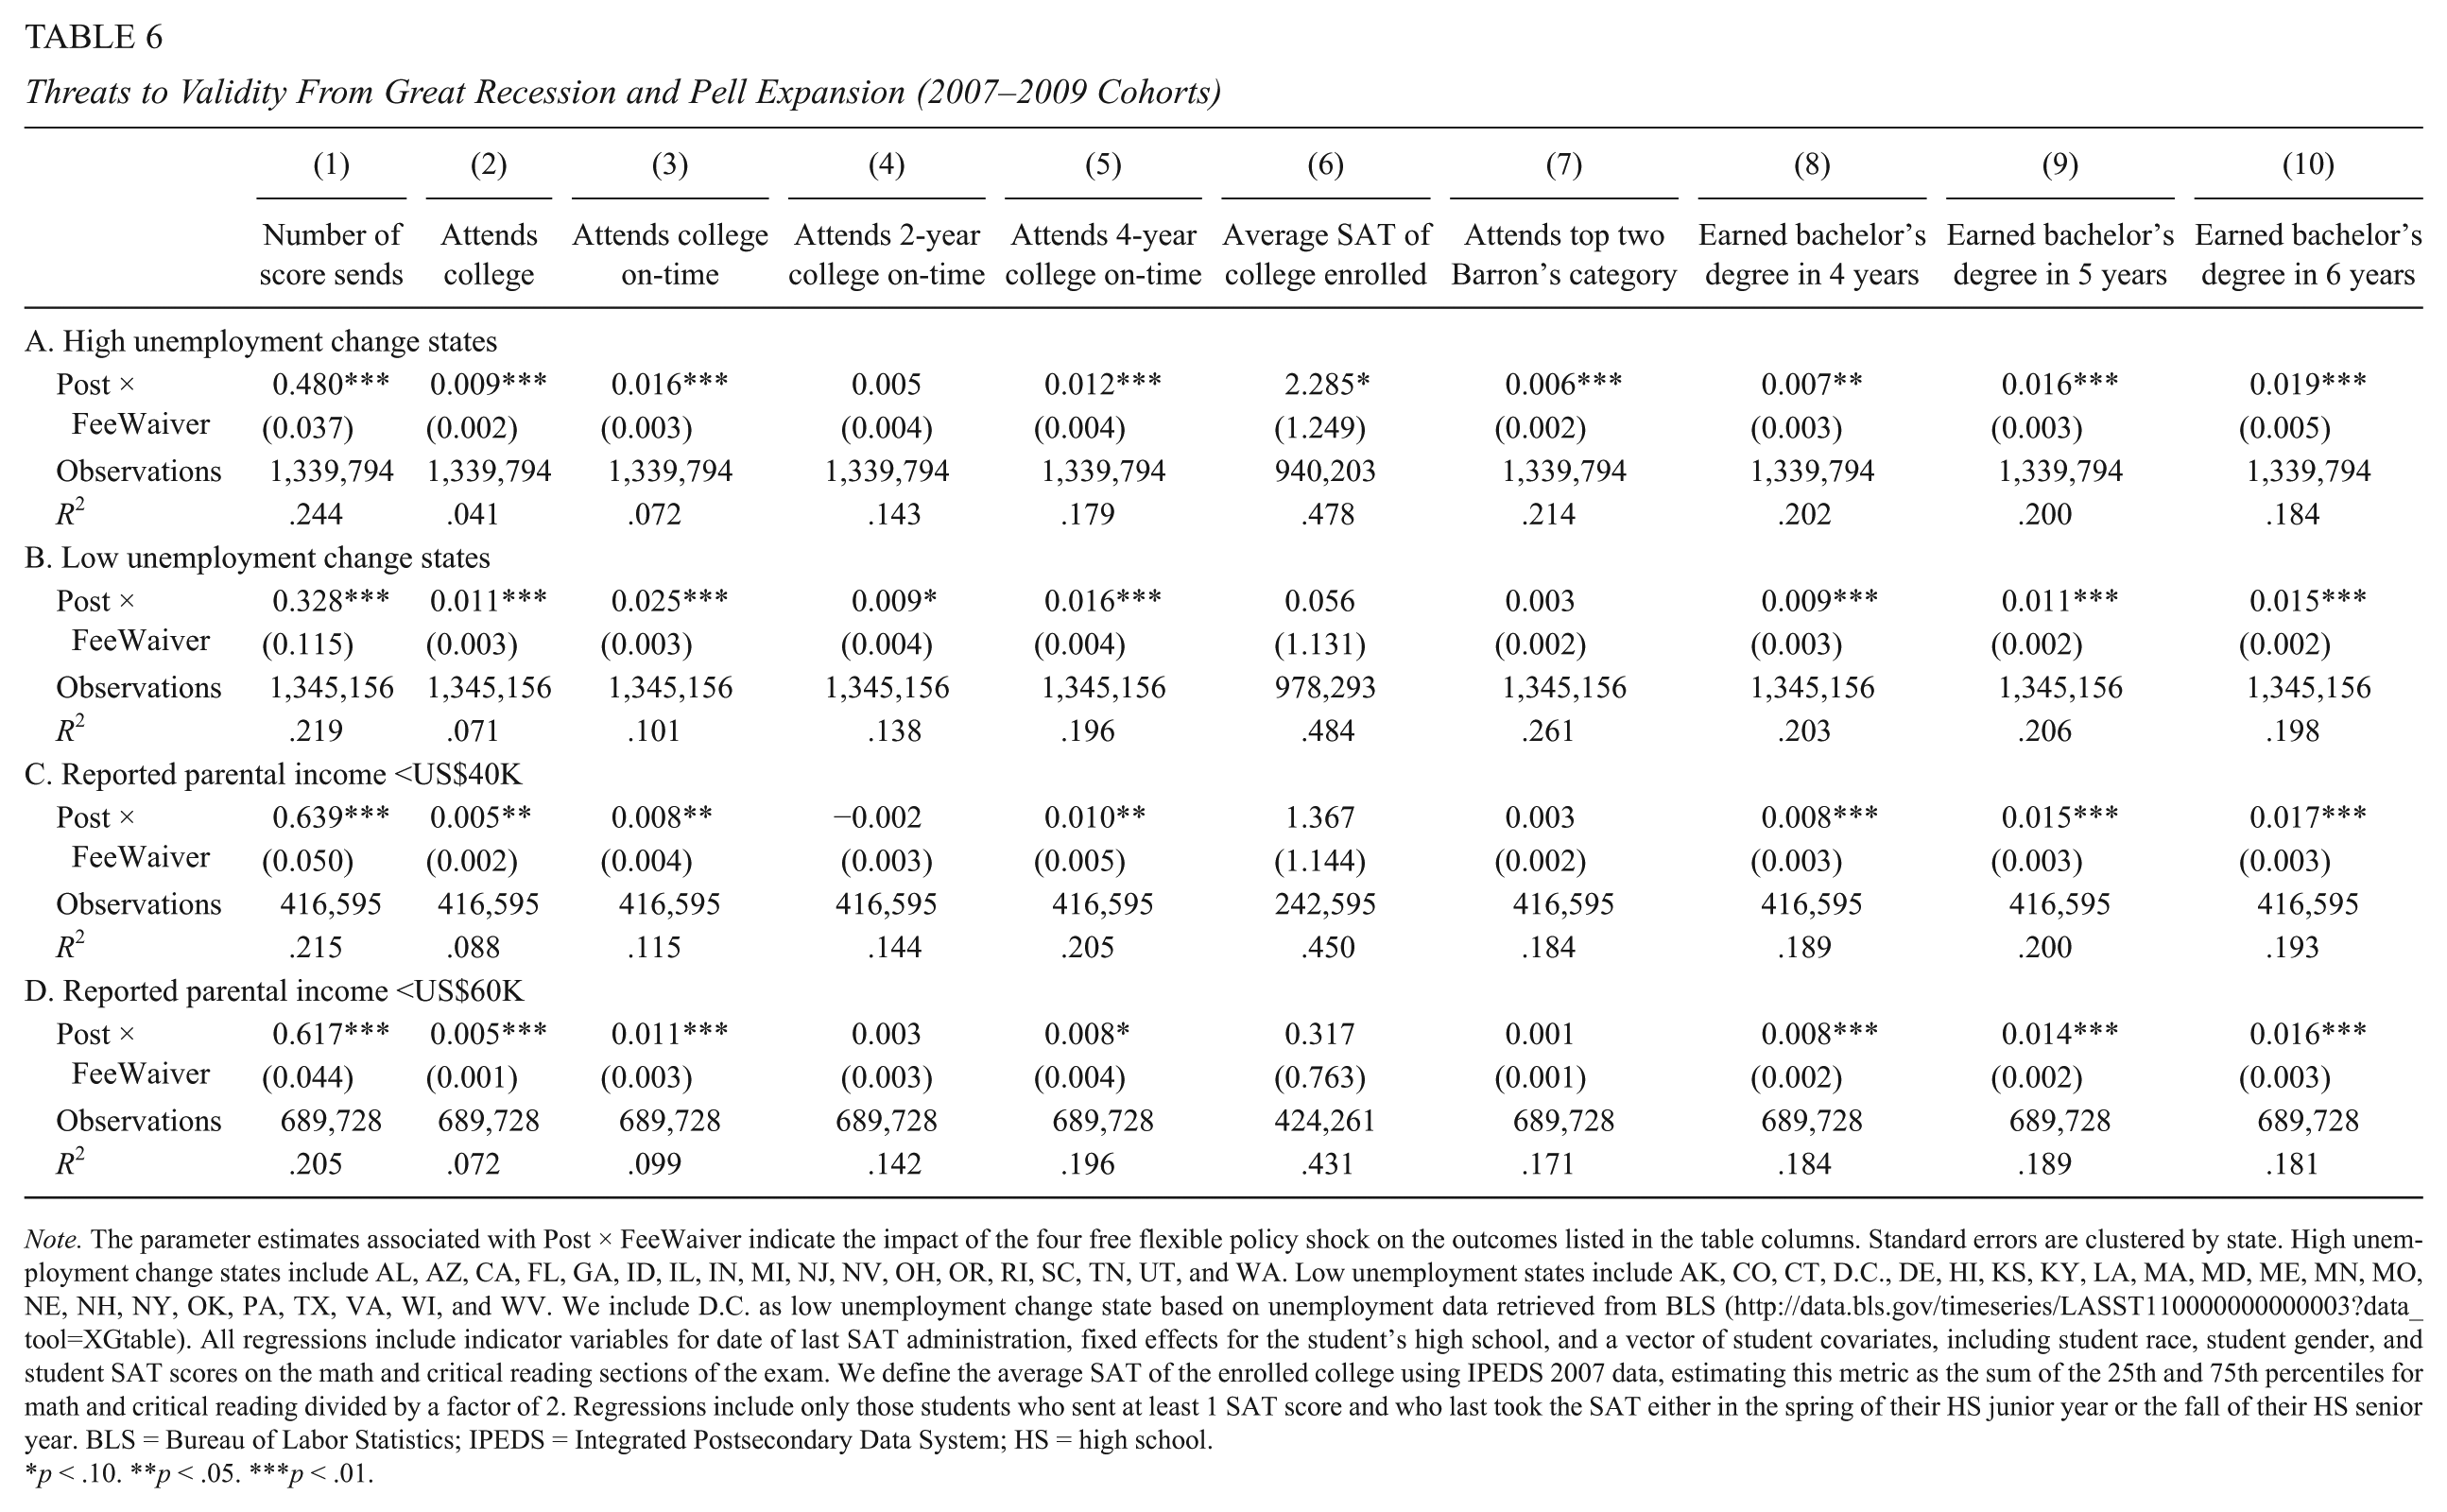
Note. The parameter estimates associated with Post × FeeWaiver indicate the impact of the four free flexible policy shock on the outcomes listed in the table columns. Standard errors are clustered by state. High unemployment change states include AL, AZ, CA, FL, GA, ID, IL, IN, MI, NJ, NV, OH, OR, RI, SC, TN, UT, and WA. Low unemployment states include AK, CO, CT, D.C., DE, HI, KS, KY, LA, MA, MD, ME, MN, MO, NE, NH, NY, OK, PA, TX, VA, WI, and WV. We include D.C. as low unemployment change state based on unemployment data retrieved from BLS (http://data.bls.gov/timeseries/LASST110000000000003?data_tool=XGtable). All regressions include indicator variables for date of last SAT administration, fixed effects for the student’s high school, and a vector of student covariates, including student race, student gender, and student SAT scores on the math and critical reading sections of the exam. We define the average SAT of the enrolled college using IPEDS 2007 data, estimating this metric as the sum of the 25th and 75th percentiles for math and critical reading divided by a factor of 2. Regressions include only those students who sent at least 1 SAT score and who last took the SAT either in the spring of their HS junior year or the fall of their HS senior year. BLS = Bureau of Labor Statistics; IPEDS = Integrated Postsecondary Data System; HS = high school.
p < .10. **p < .05. ***p < .01.
The Pell grant expansion of 2009 to 2010, which affected only the poorest of sampled students, adds another potential threat to the parallel trends assumption between fee-waiver and non-fee-waiver students. The enhanced generosity of the Pell might have induced some students into the postsecondary pipeline or it may have increased retention among already enrolled sample students. Based on the stringent requirements for receipt of SAT fee waivers, we reason that most of these students are also eligible to receive at least some Pell funds, whereas the majority of non-fee-waiver students in our counterfactual group would not be eligible for such federal aid.
We have no data on actual household income or Pell eligibility, so addressing this threat perfectly is not possible. However, the SAT student questionnaire does survey students about household income range. If we trust that students have a general sense of the range in which their household income falls, we can refit our main specifications conditioning on students self-reporting that they fall into income categories corresponding to a high likelihood of Pell receipt (i.e., a household income of less than US$40,000 per year). Figure 3 offers a preview of these model results by illustrating that increases in score sending among lower income students using SAT fee waivers increased markedly compared with lower income students who did not use fee waivers. Increases in on-time 4-year college-going and BA completion among the lowest income fee-waiver students were larger than the corresponding increases among the lowest income students who took the SAT without fee waivers.
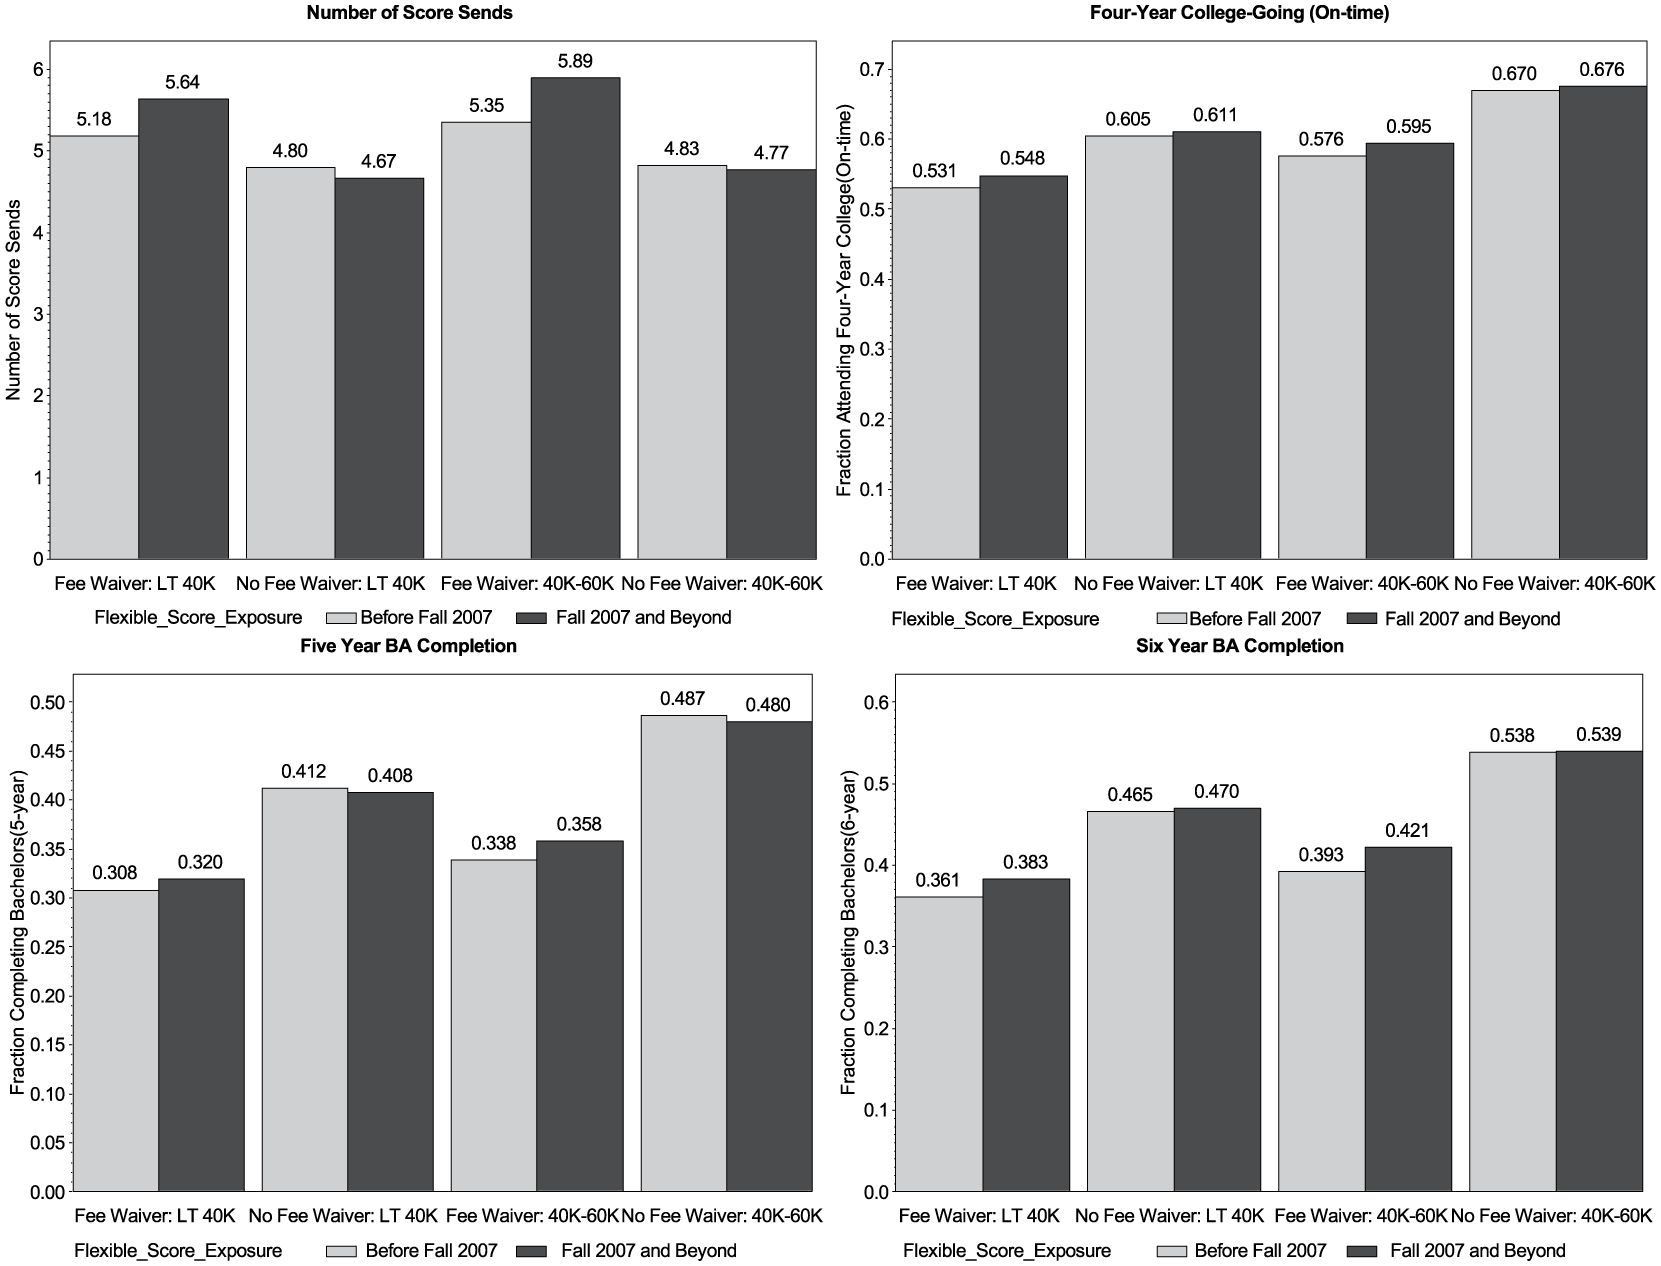
Score sending and college-going among students self-identifying as low-income.
In the bottom two panels of Table 6, we separately fit our DID models to students with self-reported household income less than US$40,000 (Panel C) and self-reported household income less than US$60,000, including those with incomes less than US$40,000 (Panel D). As students with parental incomes less than US$40,000 should have benefited from Pell expansion regardless of whether they used SAT fee waivers, low-income, non-fee-waiver test takers might serve as a more persuasive counterfactual if the Pell expansion did generate different trends in college-going or college choice between low-income and high-income students. 18 The parameter estimates on college-going and completion are similar in Panels C and D to those throughout the rest of the article, suggesting that Pell grant expansion is an unlikely driver of our results.
As a final sensitivity check to the parallel trends assumption, we show the results of models fitted to the subset of students who did not utilize any score sends. Recall from Table 3 that the flexible score report policy did not shift students from nonsenders to score senders. These nonsenders instead likely submit ACT scores to colleges, apply to colleges not requiring college entrance examinations, or, in some instances, may fail to engage in the college application process at all. This group of nonscore senders serves as the foundation for the placebo test results shown in Panel A of Table 7. 19 If the downstream ripple effects shown earlier in the article reflected growth in 4-year college attendance and bachelor’s completion among fee-waiver students relative to non-fee-waiver students unrelated to the flexible score report policy, we would expect to observe similar ripple effects among non-score-sending students. As we show in Panel A of Table 7, none of the parameter estimates on 4-year college-going or bachelor’s completion are significant, reinforcing that the ripple effects are in fact a direct result of the policy’s clear influence on student score-sending volume.
Sensitivity Analyses Using Nonscore Senders and Full Sample (2007–2009 Cohorts)
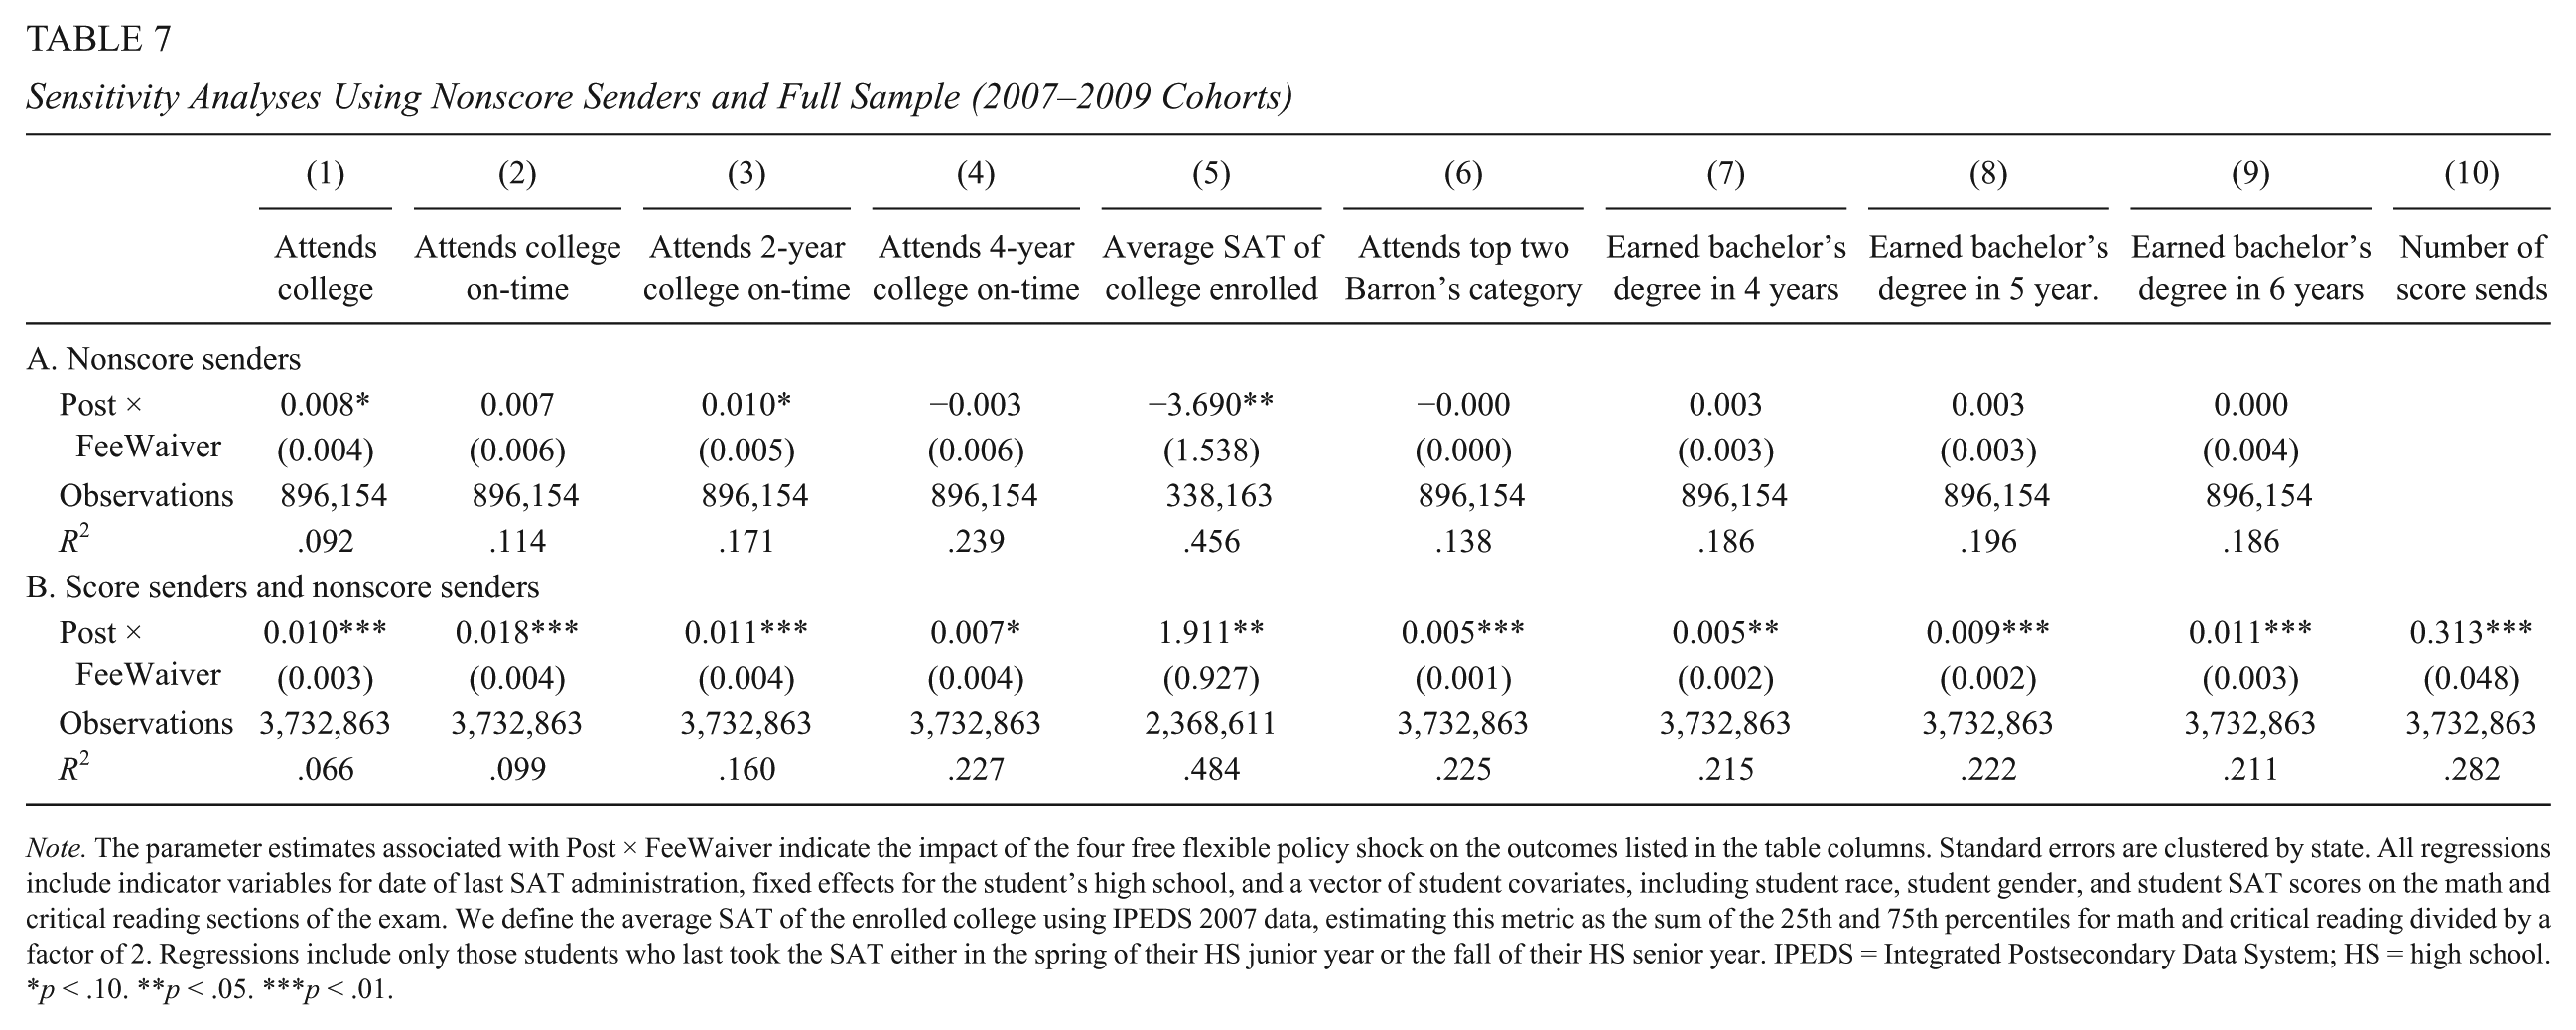
Note. The parameter estimates associated with Post × FeeWaiver indicate the impact of the four free flexible policy shock on the outcomes listed in the table columns. Standard errors are clustered by state. All regressions include indicator variables for date of last SAT administration, fixed effects for the student’s high school, and a vector of student covariates, including student race, student gender, and student SAT scores on the math and critical reading sections of the exam. We define the average SAT of the enrolled college using IPEDS 2007 data, estimating this metric as the sum of the 25th and 75th percentiles for math and critical reading divided by a factor of 2. Regressions include only those students who last took the SAT either in the spring of their HS junior year or the fall of their HS senior year. IPEDS = Integrated Postsecondary Data System; HS = high school.
p < .10. **p < .05. ***p < .01.
Unrelated to the assumption of parallel trends, it is also possible that the flexible score report policy induced students to take the SAT, perhaps in lieu of or in addition to the ACT. The direction of bias from this threat is ambiguous. An influx of higher achieving students using SAT fee waivers would likely yield upwardly biased estimates, whereas the bias would be downward if the composition of induced students was primarily students who otherwise would not have taken any college entrance exam.
In Table 8, we test whether the flexible score report policy increased the fraction of high school seniors taking the SAT. Increased SAT participation rates in high fee-waiver usage high schools without comparable increases in high schools with zero usage might raise suspicion of bias. To formally test for this, we simply collapse individual SAT test-taking data into a high school by cohort data set, and regress the fraction of seniors (from the Common Core of Data) taking the SAT on cohort fixed effects and an interaction between an indicator for whether the high school fell into the high fee-waiver usage category and an indicator for whether the cohort was exposed to flexible score report policy. 20 None of the Table 8 parameter estimates on this interaction term are statistically significant or of a magnitude to suggest test taking increases in response to the policy. As such, we dismiss this as a source of bias.
Threats to Validity From Increased SAT Test-Taking Rates
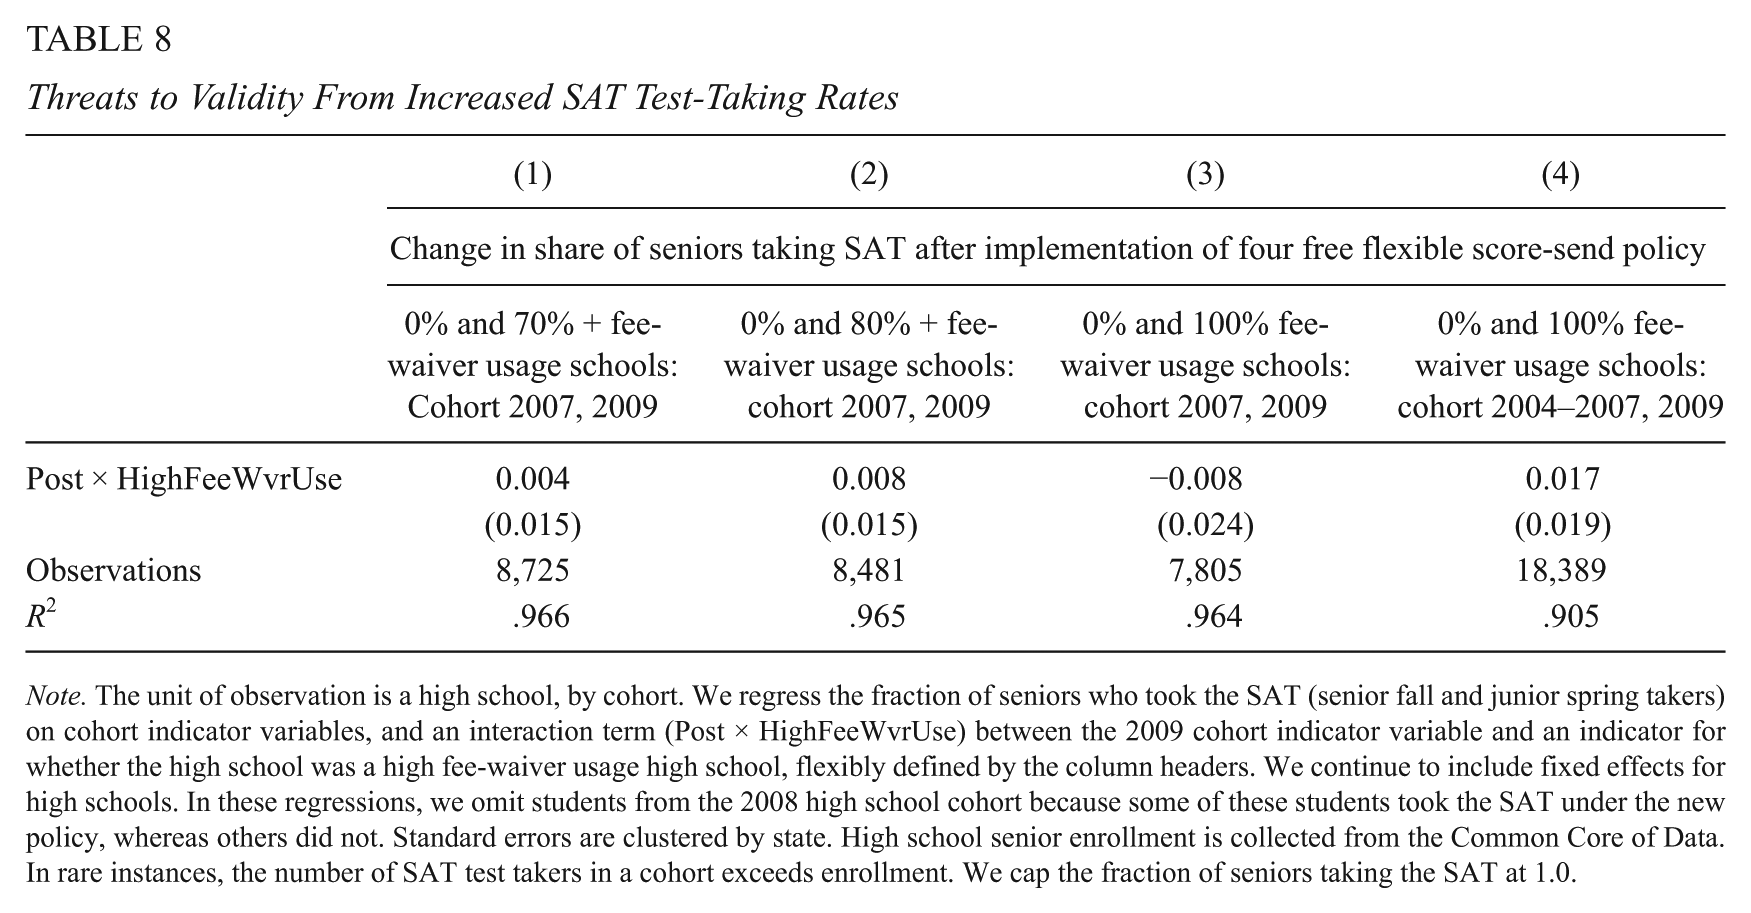
Note. The unit of observation is a high school, by cohort. We regress the fraction of seniors who took the SAT (senior fall and junior spring takers) on cohort indicator variables, and an interaction term (Post × HighFeeWvrUse) between the 2009 cohort indicator variable and an indicator for whether the high school was a high fee-waiver usage high school, flexibly defined by the column headers. We continue to include fixed effects for high schools. In these regressions, we omit students from the 2008 high school cohort because some of these students took the SAT under the new policy, whereas others did not. Standard errors are clustered by state. High school senior enrollment is collected from the Common Core of Data. In rare instances, the number of SAT test takers in a cohort exceeds enrollment. We cap the fraction of seniors taking the SAT at 1.0.
Discussion
In this study, we investigate the impact of an exogenous shift in the College Board’s score-sending policy focused on low-income students who took the SAT with a fee waiver. Beginning in the fall of 2007, the College Board provided these low-income test takers with a “treatment package” that consisted of four additional free score sends that could be utilized over a longer time horizon. This policy shock had an immediate impact on student SAT score sending, which Smith (2016) reveals as a reasonable although imperfect proxy for actual college applications. Relating this policy shift to previous literature that causally links the number of college applications to college enrollment (Smith, 2013), we predict and indeed find that the seemingly minor policy change yielded downstream ripple effects on initial college access and ultimate bachelor’s degree attainment. Across a host of different sample specifications and using a DID estimation strategy, we estimate impacts on on-time college enrollment between 2 and 4.4 percentage points, and impacts on 6-year bachelor’s degree attainment of 1.7 to 3.5 percentage points.
A comparative strength of this analysis is our ability to follow students over a long time horizon and to consider not only college access but also college completion outcomes. This provides stable ground for back-of-the envelope calculations of the potential returns to this simple and inexpensive policy change. Given the impacts cited above, we estimate that, from each high school cohort, the number of bachelor’s degree recipients increases by about 3,000 as a result of the policy change at a total cost that has an upper bound of approximately US$2.4 million, or about US$800 per additional bachelor’s degree recipient. 21 The typical bachelor’s degree recipient enjoys a lifetime earnings premium of nearly US$300,000 over the typical high school graduate (Baum & Ma, 2014). Although this figure is not causally estimated, for at least two reasons, we might expect this to be an underestimate of the overall returns to bachelor’s degree attainment. First, Card (1999) reports that causal estimates of the effect of education on earnings are typically 20% to 40% larger than observed differences. Second, the lifetime earnings premium does not capture the many other public and private benefits that accrue as a result of higher education (Baum et al., 2013). Even so, given the low-cost nature of the policy shift, earnings premiums of substantially lower magnitudes would still translate into a favorable return on investments from the flexible score report policy.
Over the past four decades, several crucial pieces of work have contributed greatly to our understanding of college selection and college choice. Economists like Long (2004) and Manski and Wise (1983) have helped to uncover how students select into colleges as well as the transformation of this selection process over time. More recently, Hoxby and Avery (2013) have drawn attention to the differential college search, application, and enrollment behavior by socioeconomic status, even among the highest achieving high school students. Suboptimal behavior at all stages of the college selection process has been carefully documented in the literature and has concerned policymakers and practitioners alike. Despite great strides in understanding the nuances and complexity of the student college-choice process, influencing this process has proven to be more challenging, until recently.
Several recent studies have demonstrated that reshaping students’ postsecondary trajectories is not only achievable but often can be accomplished with fairly small policy tweaks. Direct-to-student interventions, such as the Expanding College Opportunity (ECO) project, demonstrate that informational packets containing eight college application fee waivers to selective colleges favorably influenced college choice (Hoxby & Turner, 2013). An onerous financial aid application system has also been implicated in suppressing college-going. Bettinger, Long, Oreopoulos, and Sanbonmatsu (2012) show that Free Application for Federal Student Aid (FAFSA) assistance, paired with college cost estimates, increased college-going and persistence. Recent statewide initiatives to replace high school standardized tests, which often held no stakes for individual students, with either the SAT or ACT, have similarly increased college-going rates as well as academic match (Goodman, 2013; Hurwitz, Smith, Niu, & Howell, 2015; Hyman, 2016; Klasik, 2013). Light-touch reminders and assistance can facilitate students’ timely transition from high school to college (Castleman & Page, 2015). Finally, and paradoxically, some of the obstacles driving suboptimal college search and selection may be erected by the colleges themselves. Not only do application “micro barriers” like admissions essays and application fees reduce application volume, they also negatively impact enrollment of students from underrepresented groups such as Black and Hispanic students (Smith et al., 2015).
Our work builds on these previous studies and contributes to this burgeoning literature. We have uncovered another relatively simple and inexpensive avenue for increasing college access and improving choice. Through the ripple effects we document, we demonstrate promising evidence that simple measures have the power to influence not only how students approach college selection but also whether they ultimately complete.
Footnotes
Acknowledgements
We are grateful to the College Board and the Center for Education Policy Research at Harvard University for providing data access and financial support to make this research possible. We thank Christopher Avery, Jon Fullerton, George Loewenstein, Jessica Howell, and Jon Smith for helpful suggestions on earlier versions of this article.
Authors’ Note
The views expressed in this article do not reflect the views or opinions of the College Board. All errors are our own. Authorship order was determined alphabetically. Michael Hurwitz is a full-time employee of the College Board. Data for this study were provided by the College Board. College Board officials reviewed the results of the study prior to dissemination of our findings.
Declaration of Conflicting Interests
The author(s) declared no potential conflicts of interest with respect to the research, authorship, and/or publication of this article.
Funding
The author(s) disclose receipt of the following financial support for the research, authorship, and/or publication of this article: The study was supported by a research grant from The College Board to the Center for Education Policy Research at Harvard University.
Notes
Authors
MICHAEL HURWITZ is the senior director of Policy Research at the College Board. His current research focuses on college access and college completion.
PREEYA P. MBEKEANI is an advanced doctoral student in Quantitative Policy Analysis in Education at the Harvard Graduate School of Education and a doctoral fellow in the Multidisciplinary Program in Inequality and Social Policy at the Harvard Kennedy School of Government. Her research focuses on education policy and inequality related to college access and success of first-generation and low-income students.
MARGARET M. NIPSON is a research manager at the Center for Education Policy Research at Harvard University. Her work focuses on helping education agencies leverage data for improved decision making.
LINDSAY C. PAGE is an assistant professor of research methodology and a research scientist at the Learning Research and Development Center at the University of Pittsburgh. Her research focuses on quantitative methods and their application to questions regarding the effectiveness of educational policies and programs across the preschool to postsecondary spectrum.
References
Supplementary Material
Please find the following supplemental material available below.
For Open Access articles published under a Creative Commons License, all supplemental material carries the same license as the article it is associated with.
For non-Open Access articles published, all supplemental material carries a non-exclusive license, and permission requests for re-use of supplemental material or any part of supplemental material shall be sent directly to the copyright owner as specified in the copyright notice associated with the article.