
Abstract
STEM deserts, similar to education deserts, are rural, suburban, and urban areas where students have limited access to school-based STEM curriculum and coursework opportunities. Using administrative data from the Houston Independent School District following a state policy change to high school graduation requirements, this study develops measures of STEM deserts and identifies the students most likely to live in them. Findings reveal that Black and Asian/Pacific Islander students, students from non-English-speaking households, and those from lower socioeconomic neighborhoods are disproportionately likely to live in STEM deserts compared to White students, students from English-speaking households, and those from higher socioeconomic neighborhoods.
Keywords
STEM deserts, like education deserts—geographic areas with constrained educational opportunities (Hillman, 2016)—can be defined as rural, suburban, or urban settings with fewer school-based options to engage with STEM curricula and coursework. This is a critical topic for scholarly inquiry because some suggest living in a STEM desert influences curriculum choices and post-high school plans, with potential economic and national security implications (Randazzo, 2017). Although the concept is not new, STEM deserts have yet to be measured in a localized, student-specific way. Existing efforts, such as the National Math and Science Initiative’s (2019) state-level STEM dashboard and Karlin et al.’s (2020) mapping of engineering programs across commuting zones, provide valuable insights but are limited by their use of aggregate data and focus on large geographic units.
Geographic inequalities in educational opportunity do not emerge randomly but are shaped by long-standing structural forces, including residential segregation and the spatial concentration of socioeconomic advantage and disadvantage (Massey & Rugh, 2021). These spatial patterns may also intersect with racial and ethnic inequalities (Reardon et al., 2019) that influence students’ access to schooling and STEM opportunities throughout the educational pipeline (McGee, 2021). Understanding STEM deserts therefore requires considering how structural inequalities, including those by race/ethnicity and social class, influence the geography of STEM learning options.
Although scholarship on STEM deserts is nascent, research on education deserts offers relevant insights. Hillman (2016) found that education deserts—areas with limited college options—often have more Hispanic residents and fewer college-educated individuals. Such geographic variation in access to educational opportunities may affect students’ academic decisions; Suhonen (2014) showed that students living near universities with specific fields of study are more likely to major in those fields. Although not explicitly focused on geography, Holzman et al. (2024) found that attending a Texas school with more advanced courses is associated with higher advanced course enrollment, highlighting how available opportunities shape choices. These findings suggest that access to nearby STEM curricular opportunities may similarly influence students’ academic trajectories and decisions to study STEM.
Context
STEM deserts are particularly relevant as states adopt high school graduation policies allowing students to earn STEM-specific diplomas or endorsements—similar to high school majors—that signify a student’s curricular concentration and expertise in STEM (Erwin et al., 2023). Texas introduced such a policy with House Bill 5 (HB5), mandating that high school students choose one of five endorsements: STEM, business and industry, public services, arts and humanities, and multidisciplinary (HB5, 2013). Each endorsement includes distinct paths—course sequences students complete to earn the endorsement. For STEM, these paths include math, science, computer science, career and technical education, and interdisciplinary studies. Notably, STEM is the most rigorous endorsement, requiring Algebra II, chemistry, and physics, and is most aligned with selective college admissions (Holzman & Lewis, 2020).
Schools are not required to offer all endorsements or paths, resulting in disparities in STEM access. For instance, in the first year of implementation, 43 of 47 Houston Independent School District (HISD) high schools offered the STEM endorsement, but only three provided all STEM paths. This uneven distribution may produce geographic inequalities in STEM opportunities. To understand these disparities, we develop measures of STEM deserts in the context of HB5 to examine how geography shapes access to STEM learning.
Data and Methods
Using administrative data from HISD (N = 28,083), we developed measures to identify students more likely to live in a STEM desert—defined as having limited opportunities to choose a STEM path or take STEM courses within a 2-mile as-the-crow-flies radius of home (for details on the data and sample, see the Appendix narrative and Tables A1 and A2 available on the journal website). For each student, we counted the number of unique STEM paths and courses available within this radius. For example, if Schools A and B were within 2 miles of a student’s home and both schools offered math and science paths but only School A additionally offered computer science, then the student would have access to three unique STEM paths. Based on these counts, we created two dichotomous desert measures based on the bottom quartile of the distributions: (a) STEM path desert (access to two or fewer unique STEM paths within a 2-mile radius of home) and (2) STEM course desert (access to 58 or fewer unique STEM courses within a 2-mile radius of home). Using the previous example, a student would be classified as living in a STEM path desert if across all schools within 2 miles, the only available paths were math and science. These measures could be used to define STEM deserts in states with or without endorsement systems. In addition to the outcomes, the data set included sociodemographic variables, such as race/ethnicity and home language.
To explore patterns and disparities, we analyzed summary statistics and mapped STEM deserts and neighborhood socioeconomic status (SES) in HISD (for details on the SES index and other measures, see the Appendix available on the journal website). Logistic regression models with sociodemographic controls were then used to predict who lived in a desert.
Results
Figure 1 maps census tracts in HISD, shading them based on the share of students living in a STEM path desert (the course desert map is similar in appearance; see Appendix Figure A1 available on the journal website). Darker shades indicate a higher percentage of students with limited nearby options to specialize in STEM. Figure 2 maps neighborhood SES quintiles of each tract, with darker shades representing greater disadvantage. A comparison of the maps suggests that STEM deserts are concentrated in lower SES areas, potentially requiring students in these neighborhoods to travel farther to access schools with robust STEM opportunities.
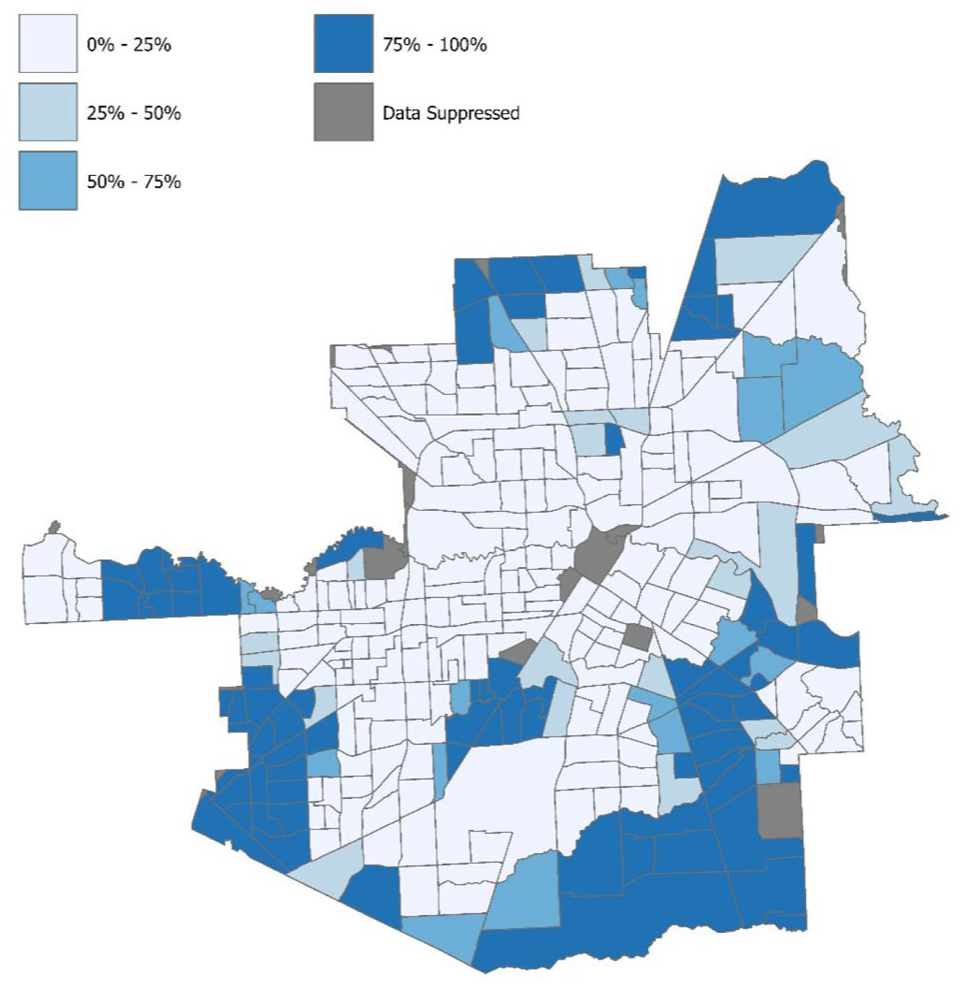
Percentage of students living in a STEM path desert by census tract in the Houston Independent School District.
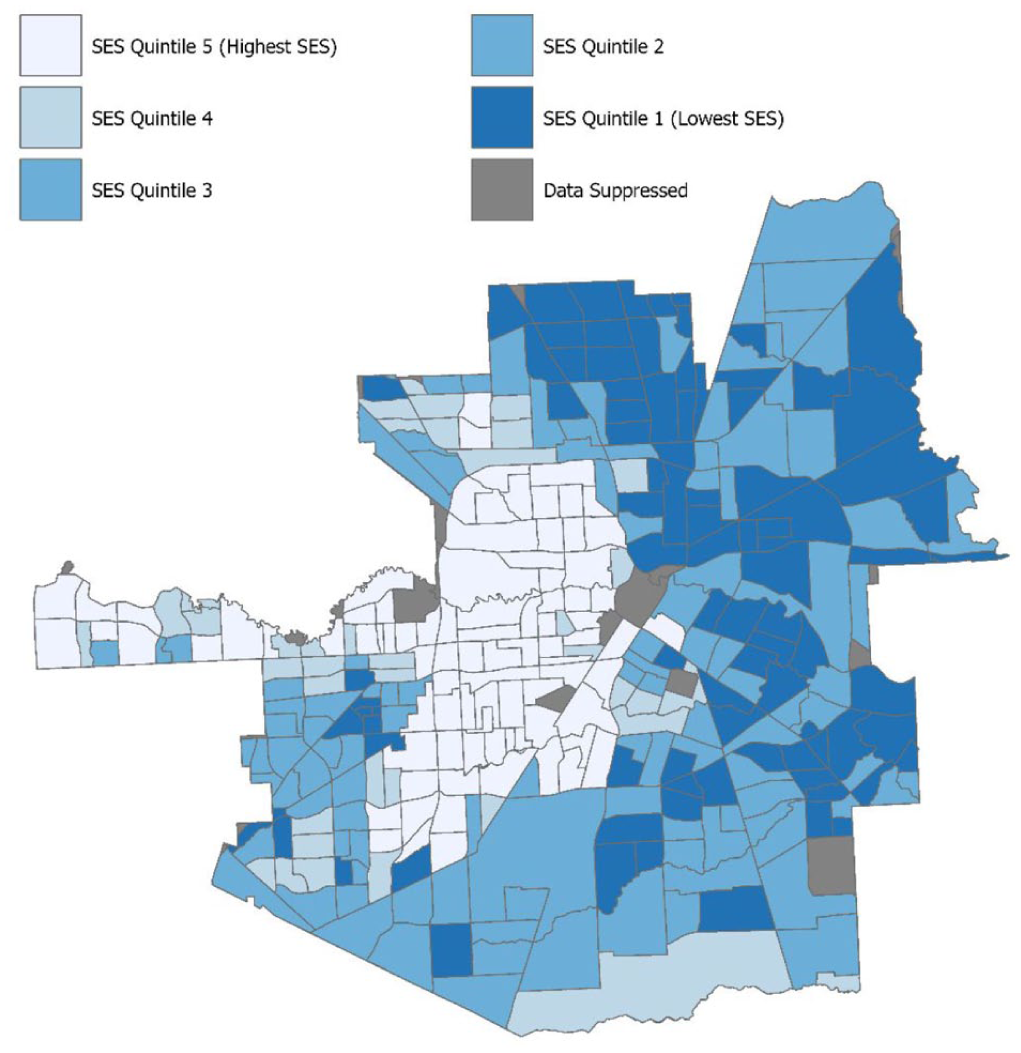
Socioeconomic status by census tract in the Houston Independent School District.
The regression results differed between the two STEM desert definitions (see Appendix Table A3 available on the journal website) but indicated that historically marginalized groups had fewer STEM opportunities. Black students were 11 percentage points to 12 percentage points more likely and Asian/Pacific Islander students 3 percentage points to 6 percentage points more likely to live in a STEM desert than White students. Similarly, students from non-English-speaking households were 1 percentage point to 5 percentage points more likely to reside in a STEM desert than those from English-speaking households. Additionally, a 1 SD increase in neighborhood SES was associated with a 1 percentage point to 2 percentage point reduction in the likelihood of living in a STEM desert.
Discussion
This study developed measures of STEM deserts and found that in an urban school district, Black and Asian/Pacific Islander students, students from non-English-speaking families, and those in lower SES neighborhoods were more likely to face limited STEM learning options. These disparities are consistent with broader evidence that structural inequalities, including those shaped by race and ethnicity, contribute to differences in educational opportunity across communities (Reardon et al., 2019) and limit access to STEM pathways (McGee, 2021). This is especially concerning in the context of HB5. The unequal distribution of STEM paths and courses may force students interested in STEM to travel longer distances to access more options or settle for their zoned school, potentially forgoing their ideal course sequence. States adopting policies like HB5 should consider the geography of STEM learning options when deciding where to allocate funding, hire teachers, expand transportation, place magnet schools, disseminate information, and implement practices to broaden STEM access for marginalized youth. This study represents a first step in understanding STEM deserts, and future research should further explore the geography of STEM opportunities.
Supplemental Material
sj-pdf-1-edr-10.3102_0013189X261424909 – Supplemental material for Who Lives in a STEM Desert?
Supplemental material, sj-pdf-1-edr-10.3102_0013189X261424909 for Who Lives in a STEM Desert? by Brian Holzman, Bethany Lewis, Jinhua Zhao and Hao Ma in Educational Researcher
Footnotes
Note
We thank leaders and staff at the Houston Independent School District for their feedback and collaboration on this research project and Rice University’s Houston Education Research Consortium for providing access to the data. We are also grateful for comments from workshop participants at the Houston Education Research Consortium. This material is based on work supported by the National Science Foundation under Grant No. 1842378. Opinions reflect those of the authors and do not necessarily reflect those of the granting agency. Results, conclusions, and errors are our own.
Brian Holzman designed the study, cleaned and analyzed the data, and wrote the article. Bethany Lewis led the literature review and assisted with study design, data cleaning/analysis, and writing. Jinhua Zhao assisted with the literature review and writing. Hao Ma assisted with the writing.