
Abstract
We study a decade of achievement gaps for fifth-, eighth-, and 10th-grade students in Norway using administrative population data. Norway is a wealthy and egalitarian country with a homogeneous educational system, yet achievement gaps between students at the 90th and 10th percentiles of parental income and between students whose parents have at least a master and at most a high school degree are found to be large (0.55–0.93 and 0.70–0.99 SD), equivalent to about 2 to 2.5 years of schooling, and increasing by grade level. Achievement gaps by parental income, but not by parental education, increased over the time period, underscoring the different ways these two socioeconomic status components relate to achievement and the potential for policy to alter gaps.
Keywords
Inequitable chances for educational success are an endemic concern in democratic societies, with unfulfilled potential having lasting consequences for individuals, families, and the society at large (OECD, 2017). Indeed, large socioeconomic achievement gaps are evident in every country where it has been studied, and gaps may be widening (e.g., Chmielewski, 2019). Yet the most comprehensive studies and vigilant discussions so far have focused on the United States (e.g., Hanushek et al., 2020; Reardon, 2011b). Although most wealthy nations have experienced increasing economic disparity over the last decades, the United States is peculiar in the size and scope of its widening wealth gaps. Compounding this, among wealthy nations, the United States has exceptionally few public supports for those at the low end of the income distribution. In addition, human and financial capital are deeply entangled, no more so than in the United States, and empirically unraveling the two in that context is, at best, challenging.
Juxtaposed with these unusual aspects of the U.S. economy, is a critical larger question evoked by the work of Reardon (2011b) and others: Are increasing achievement gaps a global phenomenon in wealthy nations or isolated to the United States? The answer to this question has implications for understanding underlying mechanisms as well as great practical significance for understanding the state of the global economy. Although there are studies that have used international large-scale assessments to study achievement gaps (e.g., Broer et al., 2019; Chmielewski, 2019; Chmielewski & Reardon, 2016), there is considerable variance in both the size and direction of trend for the same countries. This may be due to varying samples and definitions of socioeconomic measures, making it difficult to compare results.
Our study adds to the literature in three important ways. First, following demonstrations of the power of using high-quality population-level data to investigate national inequalities (e.g., Chetty et al., 2017), we are the first to take advantage of such data to study trends in national socioeconomic achievement gaps, making it possible to overcome many data limitations in existing studies. We use Norwegian population-level data that include national test scores and grades for students over time as well as precise measures of parental income and parental education. This allows for the opportunity to disentangle the consequences of sample and differences in the measurement of socioeconomic background and the gap estimation method used in previous studies for estimates of the levels and trends in student achievement gaps. Also, it is possible to investigate how compositional changes related to immigration affect achievement gaps.
Second, although achievement gaps have mostly been studied using low-stakes assessments such as TIMSS and PISA, we study both low-stake (national test scores) and high-stake (grades) outcomes for students. Grades received at the end of compulsory education determine entry into upper secondary track and possibly also school within track. These higher-stakes outcomes give us a sense of how low-stakes test gaps are translating into real-world gaps.
Third, Norway, a wealthy welfare state, provides a particularly interesting place to study achievement gaps in a global context. Norway has relatively low income inequality and an extensive social support system, including universal health care, a strong social security net, and early education that is universal and heavily subsidized. The school system mainly consists of comprehensive public schools (including Grade Levels 1–10, ages 6–16), free of charge with a common curriculum, no tracking, and no grade promotion or retention. Less than 4% of students attend private schools. The two key components of socioeconomic status (SES), parental income and parental education, are only modestly correlated, unlike the United States, allowing distinct achievement-gap trends to be uniquely estimated for the two in ways not possible in the United States. Thus, the context of Norway provides insight into both mechanisms behind and possible solutions to underlying causes of rising educational disparity.
Evidence on Socioeconomic Achievement Gaps and Trends Over Time
The 90/10 income achievement gap, the difference in test scores between students from families at the 90th and 10th percentiles of the income distribution, was introduced in a seminal paper by Reardon (2011b). The study, using 19 nationally representative U.S. studies covering 50 years, found large achievement gaps with significant increases over time. Achievement gaps for children born in 2001 were roughly 75% larger than for students born in the 1940s and had steadily increased since the 1970s (Reardon, 2011b). Reardon also studied achievement gaps by parental education, finding a relatively stable relationship in the same time period. Following this study, achievement gaps have continued to be a central focus of educational studies, particularly with increased access to achievement gap data at the school level, such as the ECLS-K and the Stanford Education Data Archive (Reardon et al. 2018).
A recent study by Hanushek et al. (2020) directly challenged Reardon’s assertion that achievement gaps between rich and poor in the United States had grown. Using data from PISA, TIMSS, and NAEP, they found no increase in achievement gaps in reading and mathematics for the same period studied by Reardon (2011b), leading the Hetchinger report to write about the “Reardon-Hanushek clash over 50 years of achievement gaps” (Barshay, 2019). Hashim et al. (2020), using two alternative approaches to inferring income-based achievement gaps, even found that gaps were narrowing between cohorts born around 1980 and those born in 2000. Reardon (2021) discussed the findings of these articles and reanalyzed data from Reardon (2011b), concluding that gaps have grown, although perhaps less than originally reported.
Contrasting findings have also been found for studies of school readiness gaps in the United States. Reardon and Portilla (2016) found narrowing income achievement gaps for kindergarteners from 1998 to 2010 using data for the United States from ECLS-K:1998, ECLS-K:2010, and ECLS-B. In contrast, Wolf et al. (2017) used the same data and time period and found increasing achievement gaps between poor and nonpoor students when stratifying by neighborhoods. Kuhfeld et al. (2020) found decreasing school readiness gaps by race and school poverty status in the succeeding time period, 2010–2017, using the Growth Research Database at NWEA including over 2 million kindergarten students.
There are also mixed findings in studies using large-scale assessments to study trends in socioeconomic achievement gaps within and across countries. Most comprehensive is a recent study by Chmielewski (2019), combining 30 international large-scale assessments over the past 50 years to study achievement gaps by SES (composite measure of parental education, parental occupation, and number of books in the home). Results suggested that achievement gaps have largely increased, although there is substantial cross-national variation in both levels and trends. Broer et al. (2019) studied achievement gaps by SES from 1995 to 2015 using TIMSS data and also found large variation between countries in whether achievement gaps have been growing or shrinking over time. In an earlier study, Chmielewski and Reardon (2016) used data mainly from PIRLS and PISA and found considerable variation across countries in income achievement gaps, relating these to features of the educational system and broader social inequality and segregation.
Achievement gaps have also been studied in countries other than the United States. For example, Saw (2016) used TIMSS to document a rapid growth in achievement gaps by parental education in Malaysia, and Salmela-Aro and Chmielewski (2019) related educational policy changes to trends in SES achievement gaps over time in Finland. A related literature has focused on trends in race/ethnic achievement gaps and their relation to school segregation (see e.g., Blatt and Votruba-Drzal, 2021; Kuhfeld et al., 2021; Reardon et al., 2019, 2022).
Different Approaches Yielding Different Answers?
Studies on achievement gaps require data linking student test scores to measures of student socioeconomic background. For nationally and internationally representative studies, student background characteristics are mostly self-reported, either by the parent or the student, with measures of parental education more commonly available than income. This is particularly true for international assessment studies, which often have no measures of parental income. Student sample, the type of socioeconomic measure used, and gap estimation method are all potential explanations for why researchers draw contrasting conclusions about the levels and trends of socioeconomic achievement gaps. In the following, we use Reardon (2011b) and Hanushek et al. (2020) to illustrate this point.
First, studies might not represent the same student populations due to different timing and sampling designs. Although both Reardon (2011b) and Hanushek et al. (2020) drew on high-quality representative studies, they used test scores from different sources, making it difficult to compare results directly. To study changes over time, previous studies have either conflated test scores across age groups and controlled for student test-taking age (e.g., Chmielewski, 2019; Hanushek et al., 2020; Reardon, 2011b), used data on one age group (e.g., Chmielewski & Reardon, 2016; Reardon & Portilla, 2016), or used a proxy of a single cohort of students (OECD, 2018).
Second, socioeconomic measures can suffer from measurement error, particularly when these variables are created from coarsened data (income or education reported in categories, subsequently converted to percentiles or years of schooling) that suffer from nonresponse and attrition (Meyer et al., 2015; Meyer & Nittag, 2019) and are self-reported by parents or students who often have only a vague idea of their parents’ income. Furthermore, even if parent-reported, prior research often uses cross-sectional income measures, potentially capturing transitory rather than persistent income (Michelmore & Dynarski, 2017). Reardon (2011b) and Hanushek et al. (2020) both used such data, and although Reardon (2011a), Ho and Reardon (2012), and Reardon and Ho (2015) alleviated some of these concerns, more accurate measures for estimating achievement gaps are preferable.
Third, measuring achievement gaps is an exercise in summarizing the joint distribution of achievement and income or education (e.g., a measure of the disparity in the distribution of a given achievement score rank-ordered by the achievement gap measure). The choice of summary measure used and how it is estimated may matter. Reardon (2011b) regression-estimated achievement gaps at the 10th and 90th percentiles by predicting achievement at these percentiles. Hanushek et al. (2020), instead, estimated the difference between average student achievement above the 75th and below the 25th percentile of their SES measure. Using both approaches simultaneously allows for an analysis of the importance of estimation procedure.
Fourth, results could differ because of different outcome measures. Both Hanushek et al. (2020) and Reardon (2011b) used achievement scores from different sources, requiring them to harmonize measures across assessments and tests and over time. Although Hanushek et al. used measures that are psychometrically linked over time, using the same achievement test outcomes alleviates any concerns about the validity of this approach.
Finally, various measures of socioeconomic background are not necessarily interchangeable. For instance, whereas Reardon (2011b) used parental income as the main measure, Hanushek et al. (2020) instead used an SES index on student-reported parental education and home possessions as their measure. Composite SES measures aim to jointly capture the human, financial, social, and/or cultural capital factors of SES. The benefit of such a measure is potentially being able to capture the broader socioeconomic context in which children learn and develop. In contrast, studying unique components of such an index serves a complementary purpose and may potentially reveal differential dynamics of contributing factors.
Two key indicators of family economic and social status are parental income and education (Duncan & Magnuson, 2003). Although often working in tandem to determine the socioeconomic position of families, relations between the two can vary as a function of sociopolitical context and historical shifts (e.g., global and historical variations in economic returns to education; Goldin & Katz, 2007). Parental income and parental education are only modestly correlated in Norway, for example (.41–.46 in our data), compared with the United States (>.7 after 2000; Reardon, 2011b). This relatively weak association in Norway is important because it allows for examining their independent contributions to achievement gaps in ways not possible in the United States. And from both a conceptual and policy perspective, there is good reason to consider their unique contributions to achievement because income and education can affect child learning and growth through distinct pathways (Duncan et al., 2014).
The effects of parental income (and financial capital, more generally) on children operate through family investments in learning opportunities (e.g., high-quality child care and schooling, out-of-school-time activities) and resources (e.g., books, puzzles, and toys). In addition, low family income not only constrains investments in children’s potential but also increases the chances that children will be exposed to environmental risks that undermine learning, such as family economic stress, toxins, and unsafe neighborhood conditions, and other adverse childhood experiences (e.g., Evans, 2004; Giovanelli et al., 2016). The effects of parental education (and human capital, more generally), on the other hand, appear to operate through socialization pathways, such as the messages children receive about educational aspirations and variations in conversational and interaction styles through which parents provide learning enrichments (e.g., Magnuson, 2007).
These distinctions in the pathways by which income and education affect children’s learning are important justifications for examining these two indicators of socioeconomics separately when estimating achievement gaps. Doing so could provide insight into the mechanisms behind and possible solutions to achievement disparity. Moreover, although family income and parent education are potential direct targets for public policy, aggregate socioeconomic status is not (Duncan & Magnusson, 2003).
The Present Study: Key Strengths
With each of these common sampling, measurement, and methodological issues in mind, the present study offers some key strengths for understanding historical change, or the lack thereof, in achievement gaps. Most importantly, we rely on population data, leaving speculations about sampling issues aside. Moreover, we are able to study the same achievement measures across cohorts as well as the same cohorts longitudinally over time in consistent samples, and we have precise register-based achievement measures that are psychometrically validated (test scores) or regulated by national curriculum-based competency measures (grades). This also allows us to apply both estimation methods to make direct comparisons of the two. Finally, we have separate register-based measures for parental income and education that are consistent over time.
Methods
Data
We use data from national registries covering the entire Norwegian population of fifth, eighth, and 10th graders from 2007 to 2018 (cohort birth years 1991–2008) and their parents/guardians. The data allow us to examine (a) changes in gaps over time (i.e., between-cohorts comparisons for, e.g., fifth grade) and (b) within-cohorts achievement patterns across grades (i.e., how a cohort performs in fifth, eighth, and 10th grades). The total sample used in the analyses includes 1,103,081 children/adolescents. Data are obtained from Statistics Norway and include the education, income, and population registries, linked by anonymized personal identification numbers.
Measures
National achievement tests and grades
We used compulsory national test scores in reading and mathematics from fifth and eighth grades. The tests were administered by the Directorate of Education and Training and validated by experts in test development and psychometrics and are designed to capture the full range of skills in these subjects covering the competency goals from lower primary (Grades 1–4) in the fifth-grade test and upper primary (Grades 5–7) in the eighth-grade test. The test results are mainly used to collect information about students’ basic skills and to track school development over time. Results are conveyed to teachers and parents but have no direct consequence for students apart from the aim of adapted education. Students also take compulsory national assessments in ninth grade. These are the same as for eighth grade in each calendar year and are used to measure within-persons progression. About 96% of all students in Norway take the test; students with special needs and those following introductory language courses may be exempt. Data from 2007 and onward are available as a score summing up correct responses. Additionally, from 2014, a scaled score based on a two-parameter item response theory (IRT) model is available. In the present study, we standardized the summed test scores within test and year and conducted robustness checks with scaled scores from 2014 and onward.
We also included grades received at the end of compulsory schooling (10th grade), representing the accumulated curriculum-based competence detailed in the National Curriculum (LK06) from 2006, which is used to apply to study track in upper secondary education. Students receive teacher-assessed grades in all subjects in addition to one to two written and one oral externally assessed exam grades, where subject is determined by random selection (Eurydice, 2021). For reading, we averaged all nonmissing grades received in the subject Norwegian, denoted “GPA Norwegian” (typically three teacher-assessed grades and potentially one to three exam grades). For mathematics, we averaged all nonmissing grades received in the subjects mathematics and science, denoted “GPA STEM” (typically one teacher-assessed grade for each subject and potentially one to two exam grades). Except for the mathematics written exam, average teacher-assessed and exam grades in these subjects are stable across the period we study (Statistics Norway, 2022a, 2022b). Both measures are standardized within year.
Parental income and education
Parental income and education are both determined by the child’s mother and father, regardless of whether they are in the same household. For less than 3% of the sample, we observed only one parent in the data. Parental income is measured as the sum of mothers’ and fathers’ average disposable income (consumer price index adjusted to 2007 levels, with only the sum for one parent if the other parent is missing) in the 3 years prior to each test, where income is averaged over nonmissing years of income data. The 3-year period allows for a measure of persistent rather than transitory income (Michelmore & Dynarski, 2017). Parental education is the highest degree obtained by a parent in the year prior to each test: elementary, lower secondary, upper secondary (basic education), upper secondary (final year), bachelor’s, master’s, or PhD. Very few students have missing information on parental education or income. Measuring income and education close to the time of test ensures that fewer students, particularly those with immigrant backgrounds, are lost due to missing data. Additionally, this ensures that results are more comparable to studies using assessments that measure test score, parental income, and other components of SES simultaneously (Chmielewski, 2019; Hanushek et al., 2020; Reardon, 2011b).
Figure 1 displays the trend in the distribution of parental income measured at the 90th, 50th, and 10th percentiles and parental education measured by the share in selected categories over the time period we study. Figure A25 in the Appendix (available on the journal website) displays the 90/50 and 50/10 income ratios over time. We see a clear pattern of rising income inequality, with the 90th percentile increasing more than the 50th percentile and the 50th percentile increasing more than the 10th percentile. We also see a pattern of increasing parental education as the share with bachelor’s degrees is rising and the share with a high school degree only is decreasing. Years of highest parental education and family income (winsorizing at the third and 97th percentiles to avoid outliers) were correlated .44 across all years, gradually increasing from .41 in 2007 to .46 in 2018.
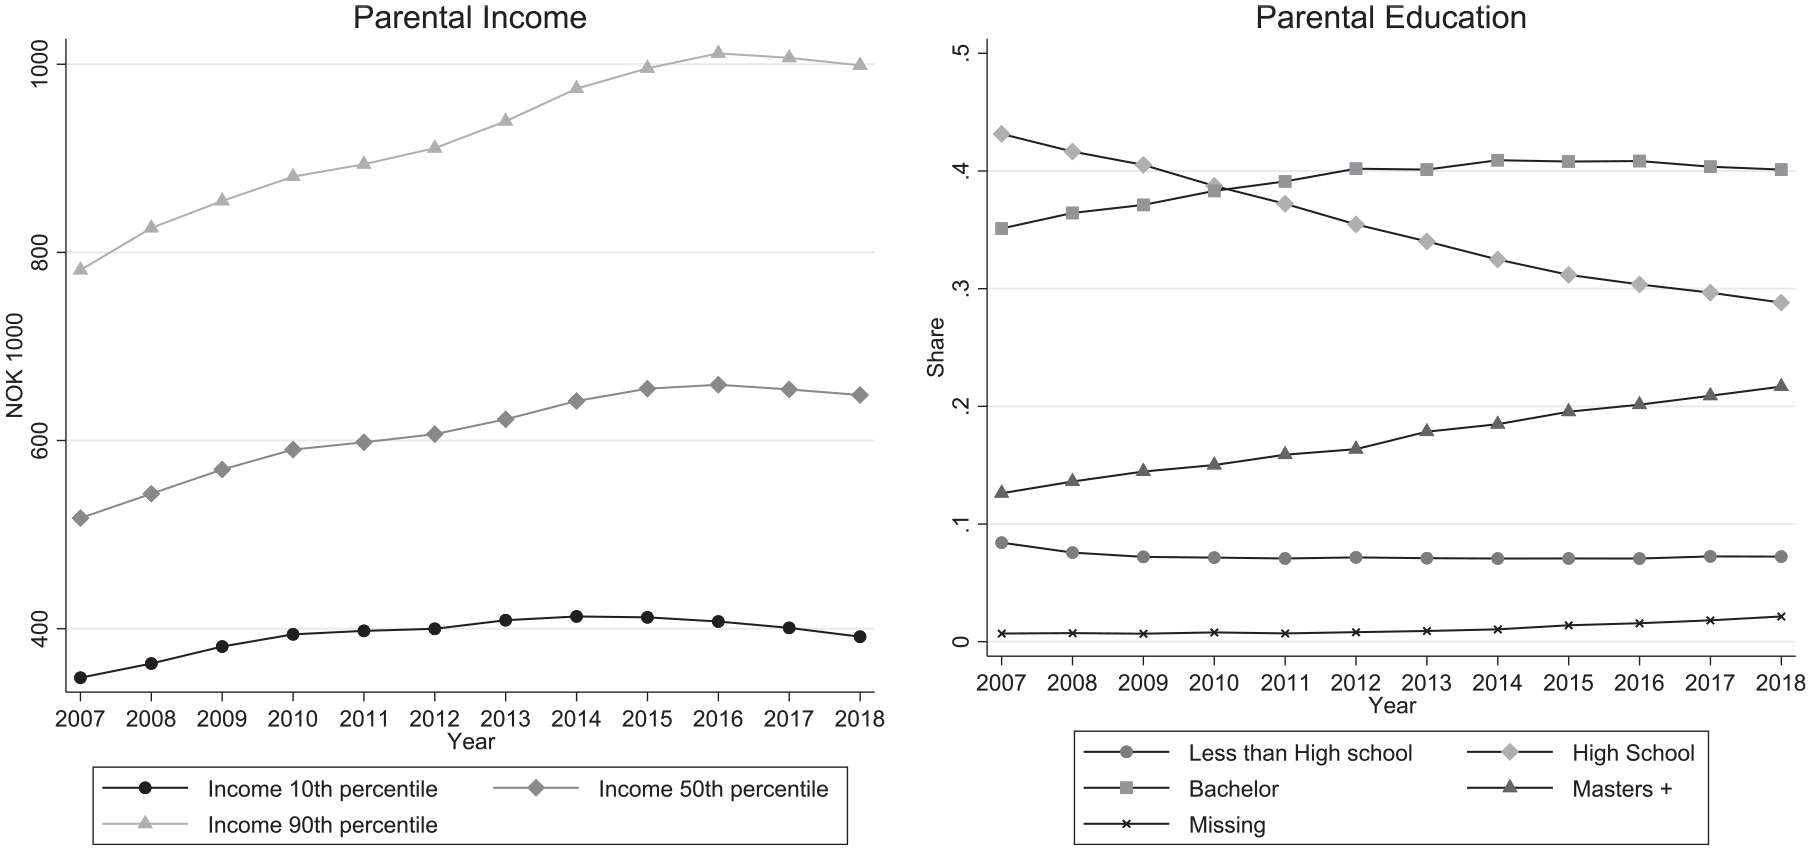
Parental income (left) and parental education (right).
Analyses
Our main approach for calculating achievement gaps by parental income follows Reardon (2011b) in regression-estimating achievement gaps at the 10th and 90th percentiles. For achievement gaps by parental education, we estimate mean achievement differences between two specific groups defined by education level: having parents with at least a master’s degree versus having parents with no more than a high school degree. For detail on the estimation approach, see Appendix A (available on the journal website), including a comparison of the Reardon (2011b) and Hanushek et al. (2020) estimation methods to investigate the importance of estimation procedure.
Results
Achievement Gap by Parental Income
In our first set of analyses, we examined level and changes in socioeconomic achievement gaps defined by parental income. In Figure 2, we show the 90/10 achievement gap by parental income measured in standard deviations separately for reading (left) and mathematics (right), for fifth, eighth, and 10th grades, respectively, across the years 2007 to 2018.
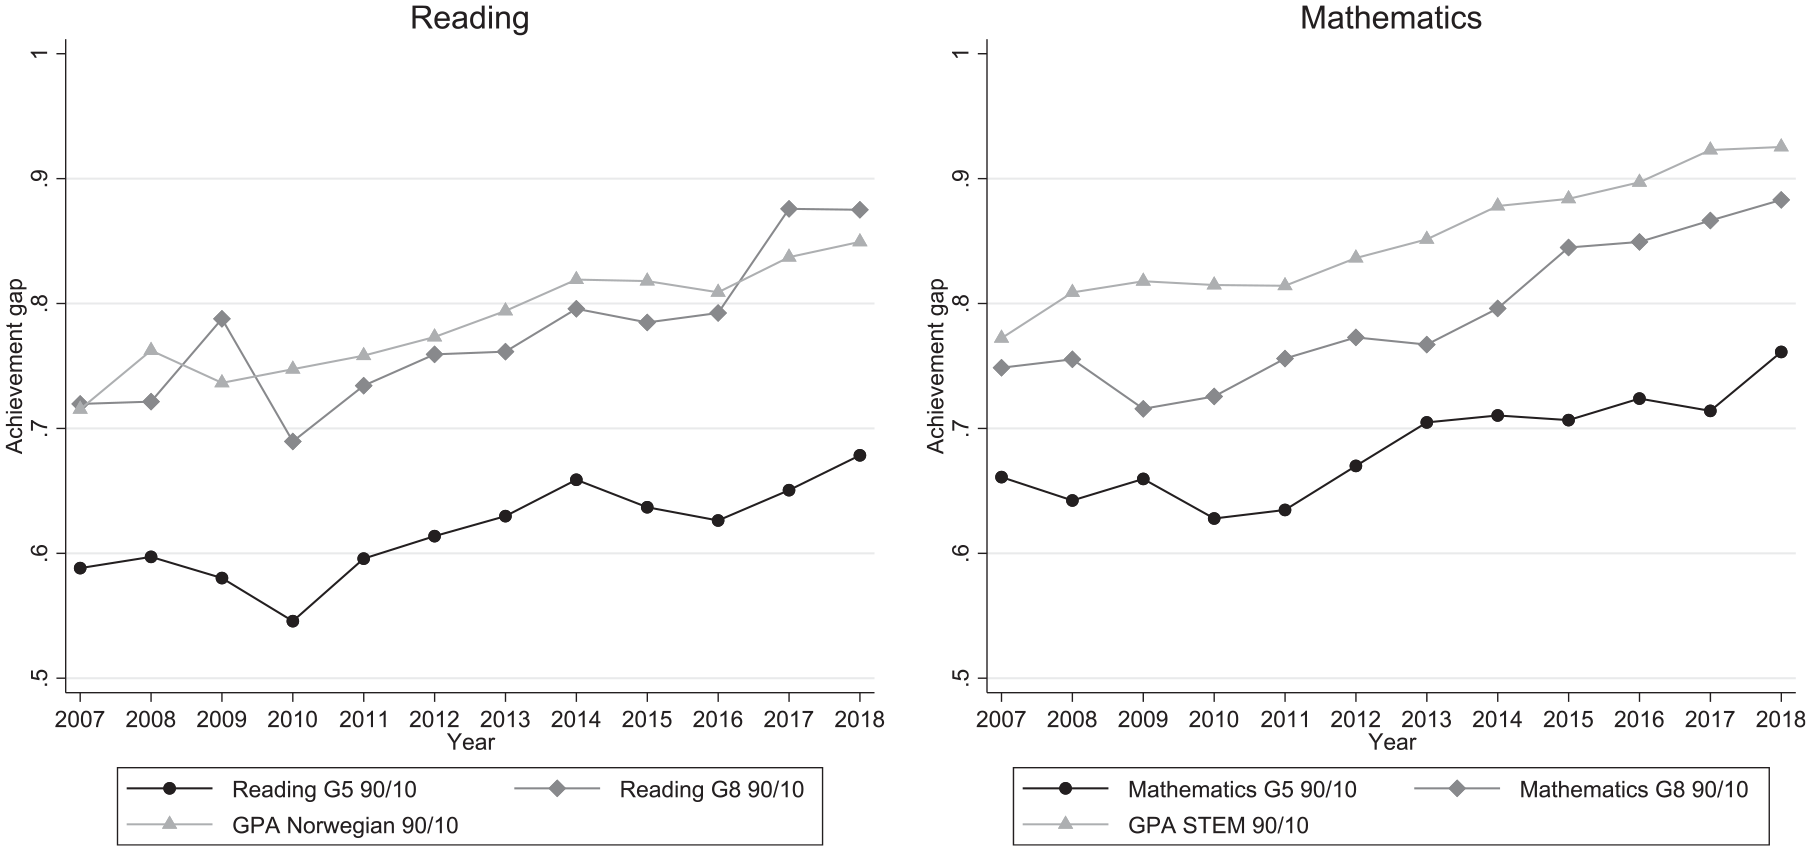
Parental income achievement gaps.
There are several notable findings from these graphs. Income achievement gaps were substantial, they were larger for older students, and they increased over time. In 2007, the achievement gap for reading for fifth graders was .59, with a gradual increase to .68 in 2018, that is, an increase of 10% of a standard deviation over the 11-year period. For eighth graders, the income achievement gap in reading was .72 in 2007 and increased with a similar rate to .88 in 2018. Both the size of the gap and the increase over time were similar for Norwegian GPA for 10th graders. For fifth-grade mathematics, the gap increased from .66 to .76, and it increased from .75 to .88 for eighth graders. The largest income achievement gap, in absolute terms, was for GPA STEM, increasing from .77 to .93.
To put these gaps in context, the scaled test scores of equivalent tests allow us to estimate changes across a year, which can be used as a benchmark for the practical importance of the estimated effects. The average within-persons change in scaled test score from eighth grade to ninth grade was equivalent to .36 SD and .38 SD (between-persons) in math and reading, respectively. The substantive interpretation is that the 90/10 income achievement gap in reading for, say, eighth graders in 2007 was equivalent to about 2 years of schooling, a substantial difference.
It is also notable that income achievement gaps were higher for mathematics than for reading, both for fifth grade and for GPA in 10th grade (about 8% of a standard deviation in both cases). These differences were quite stable over time. Finally, in Appendix A (available on the journal website), we demonstrate that the estimation methods by Reardon (2011b) and Hanushek et al. (2020) produced very similar estimates (Figure A1, (available on the journal website).
Achievement Gap by Parental Education
In our second set of analyses, we changed our focus to socioeconomic achievement gaps defined by parental education. Thus, in Figure 3, we show the achievement gap by parental education measured in standard deviations separately for reading (left) and mathematics (right). The lines display results comparing achievement between children whose parents have at least a master and at most a high school degree (MA/HS), for fifth- and eighth-grade test scores, and for GPA, respectively, approximating a 90/20 achievement gap.
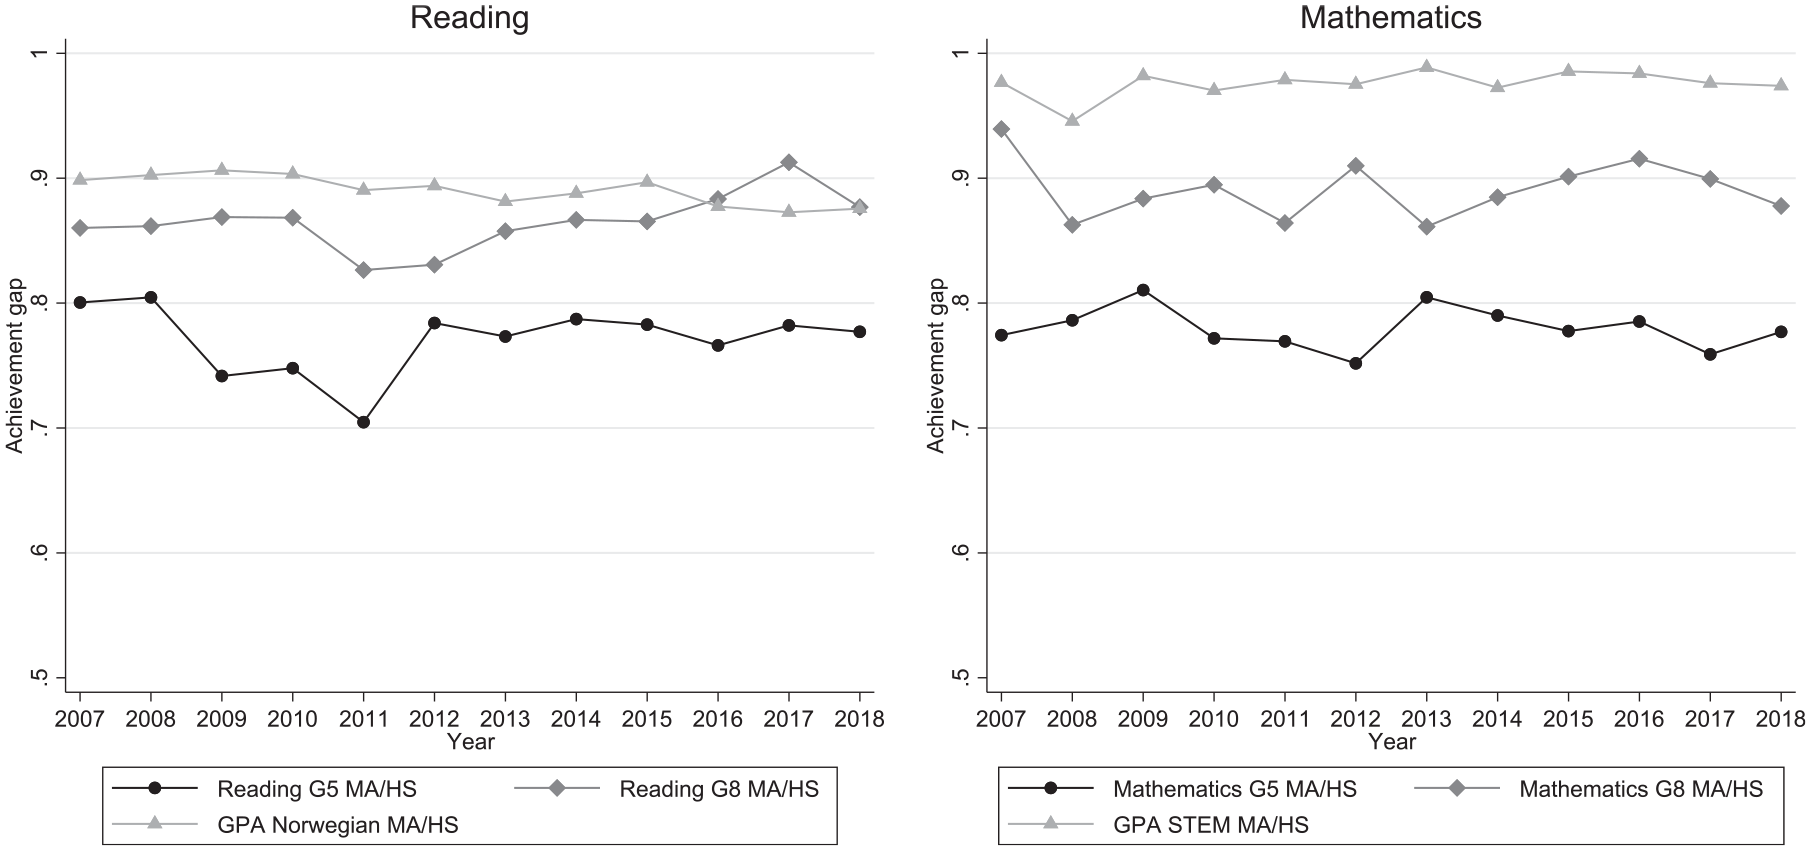
Parental education achievement gaps.
The most striking finding is that the achievement gaps by parental education did not increase over time. This was true across all grades, across both math and reading, and for both estimation methods (for results comparing these figures to the Reardon, 2011b, estimation method, see Appendix A, available on the journal website). For example, for mathematics in fifth grade, the size of the MA/HS gap hoovers around .8 of a standard deviation across all years. However, two findings are consistent with achievement gaps by parental income. First, achievement gaps by parental education increased by grade level. The MA/HS gaps increasing from about .8 SD to .9 SD from fifth to eighth grade in reading. Second, the gaps were mostly larger for mathematics than for reading, at least at higher grade levels.
Finally, when we compared the 90/10 achievement gaps for income and education (Figure 3 and Figure A2 in the Appendix, available on the journal website, both using the Reardon, 2011b, estimation method; for details, see Appendix A, available on the journal website), we found that they are larger for education. Taking reading in fifth grade as an example, the achievement gap by parental income increases from about .6 SD to .7 SD, and the achievement gap by parental education is stable at about .9 SD. The same comparison is true across grades and outcomes.
Changes at the Top or Bottom?
The increasing achievement gaps by parental income between the 10th and 90th percentiles may be a function of decreasing test scores at the 10th percentile of parental income, increasing test scores at the 90th percentile, or both. To investigate this further, Figures 4 and 5 compare the 90th and 10th percentiles to the median (the 90/50 and 50/10 parental income achievement gaps) for reading and mathematics, respectively. Although we see a stable 90/50 achievement gap at about .35 for reading and .4 for mathematics, the 50/10 achievement gaps are increasing throughout the whole period. We see the same pattern in Figure A3 in the Appendix (available on the journal website), where we graph the trend separately for the 90th and 10th percentiles and where point estimates show achievement relative to the mean.
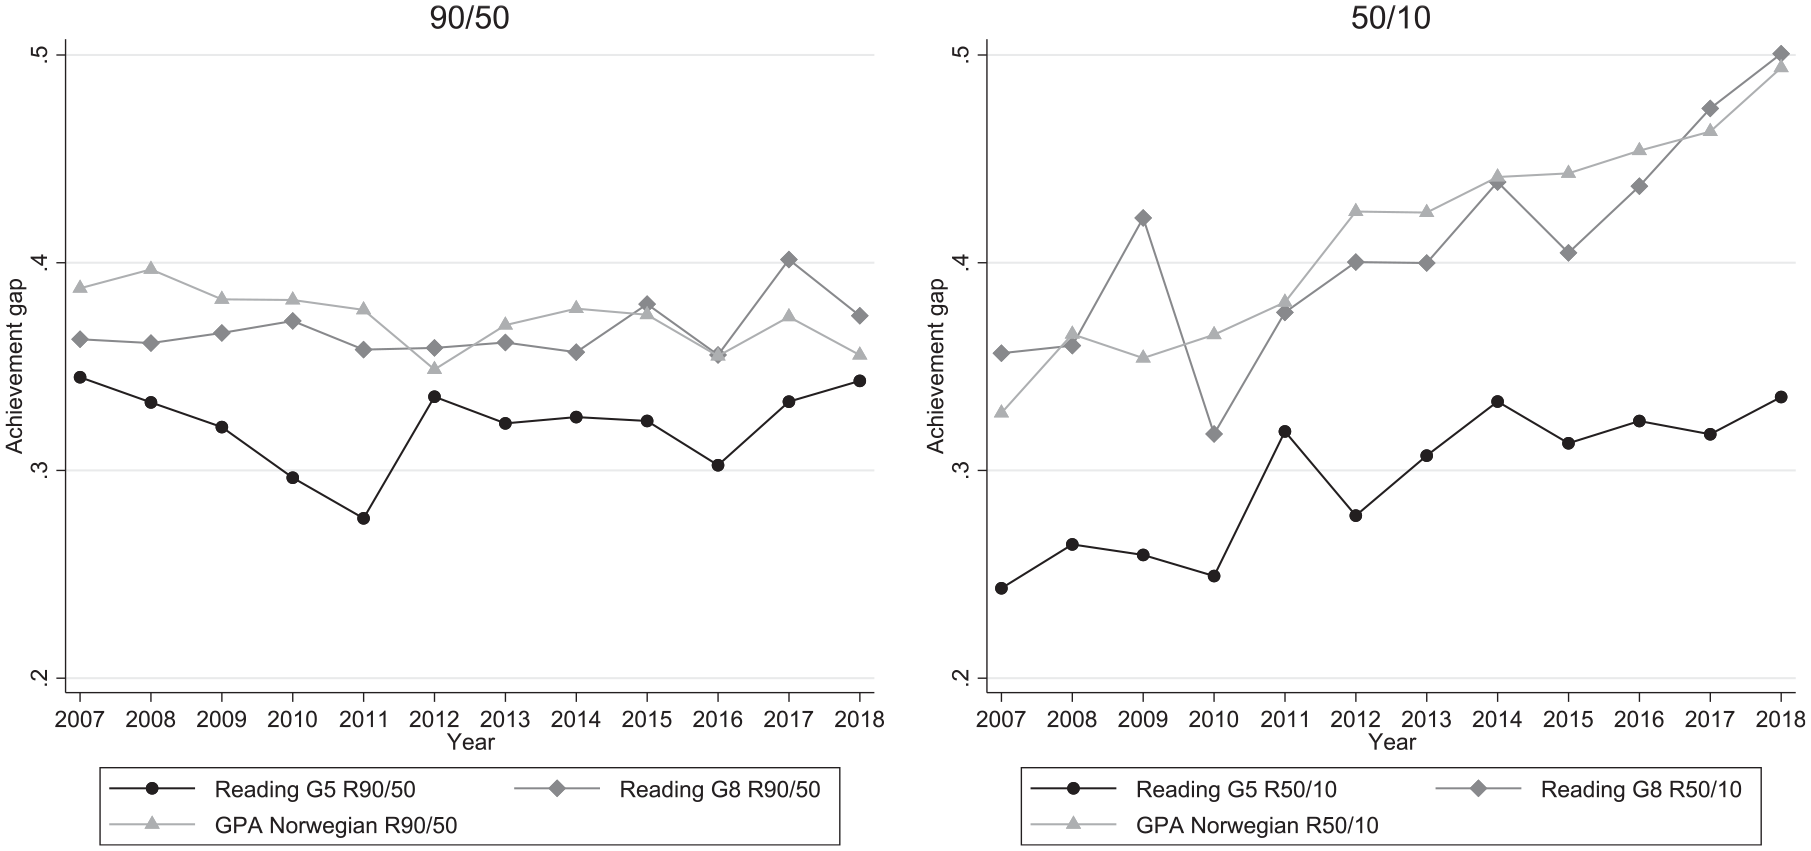
Parental income achievement gaps for reading, 90/50 and 50/10.
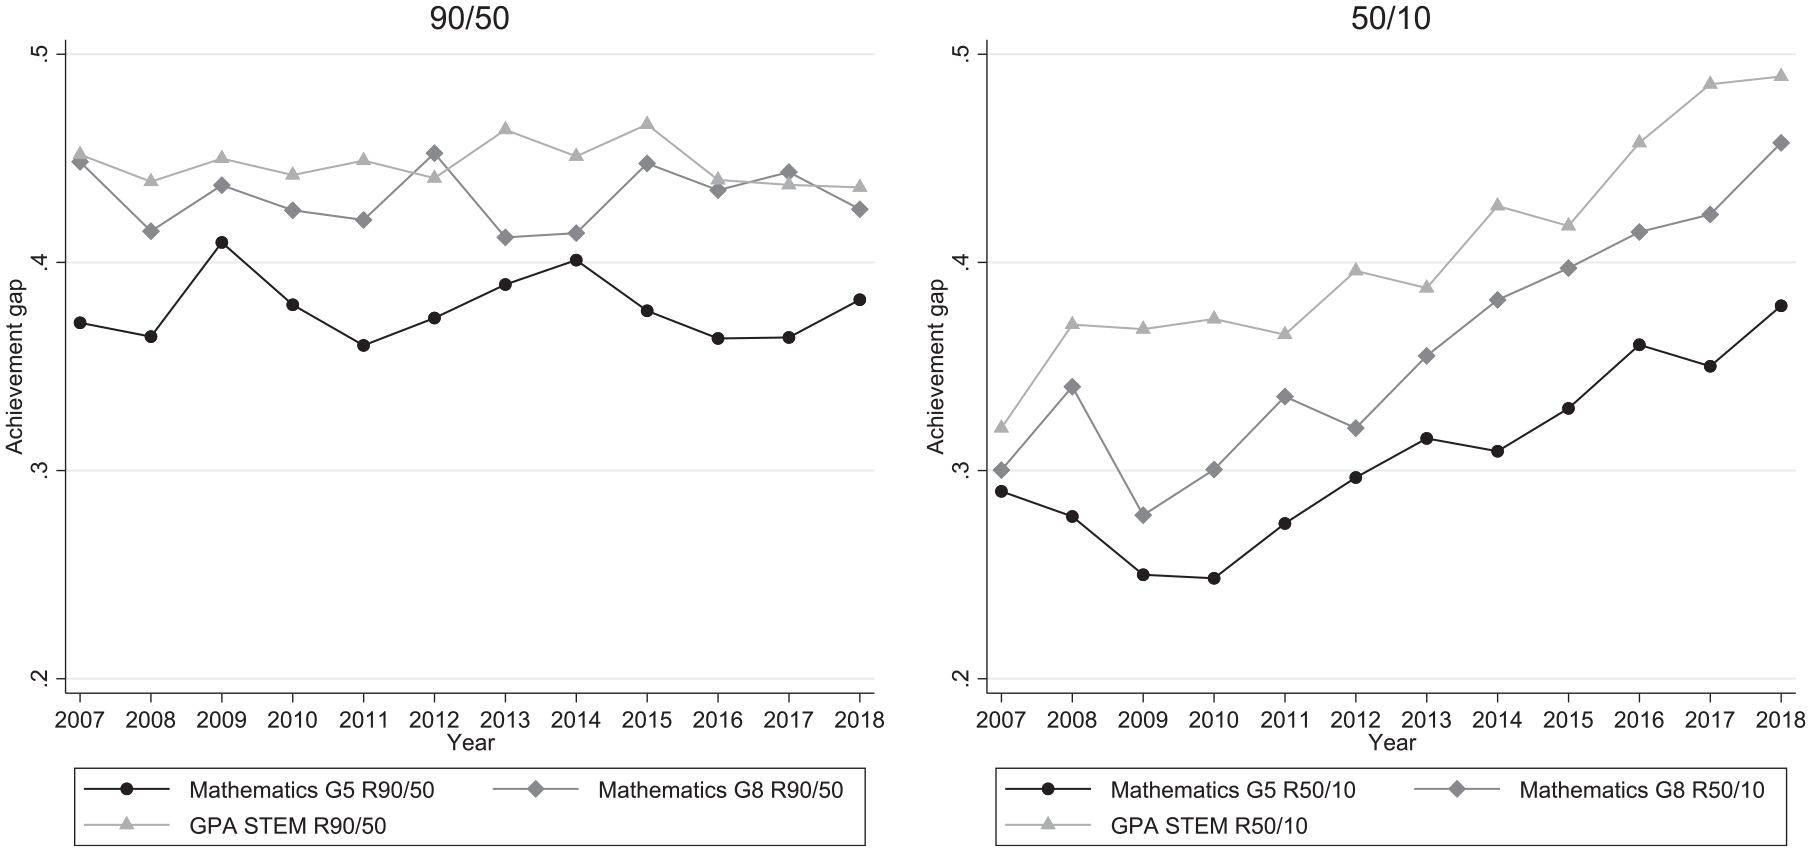
Parental income achievement gaps for mathematics, 90/50 and 50/10.
A similar investigation for achievement gaps by parental education shows that gaps are stable due to both MA and HS decreasing over time, consistent with more negative selection into both categories over time (Appendix B, Figure A4, available on the journal website). When we instead estimate achievement at the 90th and 10th percentiles, taking compositional changes into account, the separate trends show neither convergence nor divergence in the gaps (Appendix B, Figure A5, available on the journal website).
Robustness Checks
We conducted a number of robustness checks for our results that all support our main conclusion. These are detailed in Appendix A-I (available on the journal website). In sum, we found that our results are consistent when comparing estimation methods by Reardon (2011b) and Hanushek et al. (2020), using IRT-scaled test scores, accounting for missing test scores, studying the same sample of children over time, and accounting for immigration. We also present alternative gap specifications, partial associations of parental income and education, the distribution of our outcome variables over time, and the nonparametric functional form of the parental income and parental education achievement relation.
Discussion
There are three main findings in our study. First, even in a fairly egalitarian country with a homogeneous educational system, achievement gaps by both parental income and parental education are large, equivalent to about 2 to 2.5 years of schooling. Second, the gaps are increasing with student grade level, increasing by about 10 percentage points from fifth grade to eighth grade, with a similar increase to 10th grade. This increase is consistent with OECD (2018), which found large and growing gaps for Norway from age 10 to ages 25 to 29. Third, for income gaps, but not for education gaps, there has been an increase in gaps over time, equivalent to about 3 to 4 months of schooling. When we decompose the change for income, we observe that achievement remains high and stable for the 90th percentile and that achievement is decreasing over time for the 10th percentile.
How do the gaps we observe for Norway compare to the United States and other countries? Such comparisons, as noted previously, are not straightforward but give us some idea of how the magnitude of our estimates compare to the magnitude in estimates in studies that are somewhat comparable. Our estimates are consistent with, but in general smaller than, those reported from the United States. For example, Reardon (2011b) reported income gaps that increase from about 0.75 SD in 1940 to about 1.25 SD in 2000, and Reardon and Portilla (2016) reported income achievement gaps for kindergarteners (ages 5–6) above 0.99, substantially above gaps for our lowest grade level. In an international comparison, Chmielewski and Reardon (2016) found the income achievement gap in Norway to be 0.75 of a standard deviation in the PIRLS 2001 data, compared with 1.25 of a standard deviation in the United States, using same-age data from the ECLS-K.
Our estimates for achievement gaps by parental education are also slightly smaller than those reported from the United States. Using the Reardon (2011b) 90/10 estimation method, more appropriate for comparisons, we found gaps ranging from 0.86 to 1.15 SD (Appendix A, Figure A2, available on the journal website). Reardon (2011a) found achievement gaps by parental education in the United States to be stable over time largely above 1 SD, with some signs of a slight increase in the end of the period.
While not directly comparable, the socioeconomic (SES) achievement gaps reported by Chmielewski (2019) for the United States are estimated to be between 1.1 and 1.2 for the period 1950 to 2000, whereas trends for other countries are largely above 1.0. Hanushek et al. (2020), measuring the difference between average performance above the 75th and below the 25th percentiles, found that gaps in the United States increased from .84 to .91 from 1961 to 2001. Similar estimates for our data, using parental education as our gap measure, yield gaps in the range of .51 and .87, again, largely lower than the U.S. estimates and in line with Broer et al. (2019) and OECD (2018), which showed that Norway has large gaps but that they are relatively smaller than those for the United States.
Despite smaller absolute achievement gaps in Norway compared to those found in the United States, it is notable that the gaps we observe in Norway are disturbingly large, given the sociopolitical context in which they have arisen. If income disparities (being about twice as large in the United States compared to Norway; OECD, 2021) relate to income achievement gaps, the relative difference in achievement gaps between the two countries is smaller than what one might expect. This is particularly evident if we compare the education, social security, and health-care system in Norway with those of the United States, expected to reduce inequality. From a developmental perspective, however, even in a more egalitarian society, there may be strong associations between student achievement and the resources that families have available to their children, whether measured by parent income or education.
The Difference Between Income and Education
We find that achievement gaps by parental income in Norway increased by about .10 SD between 2007 and 2018, whereas achievement gaps by parental education remained stable in the same time period. Parental income and education in Norway are considerably less correlated in Norway than in the United States, but increasingly so over time. In Appendix H (available on the journal website), we estimate the partial associations of parental income and education, showing that although achievement gaps by parental education only slightly decrease, achievement gaps by parental income are substantially reduced. However, the partial achievement gaps by parental income are still increasing, suggesting that compositional changes in education cannot account for the increase in achievement gaps by parental income.
The conclusions we draw from these findings is that achievement by parental income has increased in Norway over time and that parental income and parental education may not be interchangeable measures of SES. This has important implications for both research and policy. First, achievement gaps across countries and contexts are restricted by samples, test score indicators, and SES measures and may not be directly comparable across studies. When conclusions differ, as is the case with the ongoing U.S. debate between Reardon (2011b, 2021) and Hanushek et al. (2020) on whether achievement gaps in the United States have increased in the past 50 years, it is unclear what methodological choice is leading to contrasting conclusions. Our results suggest that the achievement gap measure is a crucial difference and that both U.S. studies can in fact be correct because they may not be measuring the same gap.
Second, the fact that income gaps are increasing in Norway while education gaps have remained stable underscores the different ways these two—related but distinct—SES components may influence child achievement and, in turn, the different ways policy may or may not be able to alter gaps. With this in mind, we speculate about the possible mechanisms behind the growing achievement gap related to income. Although both Reardon (2011b) and our study found increasing achievement gaps by parental income and stable achievement gaps by parental education, the increase in the United States resulted from an increase for the 90th percentile. Reardon concluded that the change at the top could be due to families being more likely to invest in their young children’s development or improving test scores. Our results, on the other hand, show that the increase resulted from a decrease for the 10th percentile relative to the median.
We propose two potentially supplementary explanations for this change. The first concerns mechanisms of investment and environmental risks. The investments affordable to the low earners may have changed due to, for example, higher living costs at the expense of investments in educational opportunities. Alternatively, if the amount of investments has remained stable, the educational opportunities that money can buy or the returns to these investments may have decreased. These changes could affect achievement through both investment and environmental risk pathways. The second concerns group composition, which we have not investigated beyond educational attainment and immigrant background. When we estimate the partial associations of parental income and education or estimate achievement gaps taking immigrant background into account, the achievement gaps for income are still increasing over time, but the increase is smaller. Other compositional changes among those below the 10th income percentile may also contribute to the increasing trend.
If achieving more equitable student outcomes is a policy goal, one approach would be to narrow parental income differences, especially through policies designed to increase incomes on the lower end of the distribution (e.g., Troller-Renfree et al. 2022). This is particularly relevant if changes are working though investment or environmental risk mechanisms relating to income. Such policies operate indirectly to raise student outcomes. An alternative is to implement targeted interventions that seek to improve education outcomes for students with lower educational performance or at risk of lower performance (Duncan & Magnuson, 2005). This is particularly relevant if compositional changes are driving the increasing trend. Such interventions may, however, be less easy to implement in societies such as Norway that take a universal approach to education policies, although reallocations based on where lower income students live is more common.
The increase in achievement gaps by parental income indicates that income has become more predictive of student achievement over time, which, in turn, predicts increased future income and earnings. The change we observe is occurring alongside an increase in income inequality, child poverty (Barth et al., 2021), and school segregation by income (Wessel, 2015). Because educational outcomes predict future education and earnings, the increasing achievement gap by parental income may increase future income inequality and segregation as well. The change is also occurring alongside increasing evidence that the expansion of universal early childhood education and care (ECEC) is helping narrow achievement gaps in the country. A recent study by Zachrisson et al. (2021), for example, found that the expansion of ECEC reduced achievement gaps as a function of parental education on national fifth-grade tests in 2012–2018, while much less so as a function of parental income. Our analyses suggest that despite any narrowing function ECEC may be having, the net national gap trends in Norway remain stable or are even increasing. This is a provocative juxtaposition in light of the popularity of ECEC for improving equity in academic success, suggesting ECEC alone may not be enough to overcome cumulative forces of inequity due to socioeconomic position. This additionally evokes the question of whether we would also see increases for parental education achievement gaps without the narrowing effects ECEC.
Strengths and Limitations
The main strength of our analysis is that we can study the whole population, and use precise measures of both student achievement and parental income and education from administrative data. In addition, we are able to measure student performance outcomes for the same individuals over time.
There are four main limitations to our work. First, item-level test data are not available, preventing us from correcting for measurement error (as done, e.g., by Reardon, 2011b). However, our robustness checks with scaled IRT scores are identical to those using the standardized raw score, and we do not, therefore, consider this to be a critical threat to the validity of our results. Second, we are only able to measure achievement as far back as 2007, limiting our ability to compare estimates with studies using older data and to study a longer time trend. Third, we do not have a composite SES measure, limiting the direct comparison of estimates to, for example, Hanushek et al. (2020). Fourth, although both parental income and education are accurately measured, education is a categorical variable, affected by compositional changes in the share and the characteristics of those taking various degrees. We are therefore cautious in our interpretation of level differences between achievement gaps by parental income and education.
Conclusion
In this study, we show that there are considerable socioeconomic achievement gaps even in a relatively egalitarian society like Norway, with a progressive social welfare system and where schools are mainly public and governed largely by national standards for funding and content. We also demonstrate the advantages of using national administrative data both to study trends in these gaps over time and to identify achievement gaps by two key indicators of family economic and social status: parental income and education. Finding large and persistent (even increasing) achievement gaps in Norway suggests that there are substantial limitations to what an educational system in an affluent welfare state with relatively little income inequality can achieve in equalizing opportunity. To rephrase Reardon (2011b, p. 111), because the children of the poor do worse in school and those who do worse in school are more likely to remain poor, we risk that an egalitarian society becomes more unequal and economically polarized.
Supplemental Material
sj-pdf-1-edr-10.3102_0013189X221142596 – Supplemental material for The Widening Achievement Gap Between Rich and Poor in a Nordic Country
Supplemental material, sj-pdf-1-edr-10.3102_0013189X221142596 for The Widening Achievement Gap Between Rich and Poor in a Nordic Country by Astrid Marie Jorde Sandsør, Henrik Daae Zachrisson, Lynn A. Karoly and Eric Dearing in Educational Researcher
Footnotes
Notes
Authors
References
Supplementary Material
Please find the following supplemental material available below.
For Open Access articles published under a Creative Commons License, all supplemental material carries the same license as the article it is associated with.
For non-Open Access articles published, all supplemental material carries a non-exclusive license, and permission requests for re-use of supplemental material or any part of supplemental material shall be sent directly to the copyright owner as specified in the copyright notice associated with the article.