
Abstract
This brief describes how several commonly used per-pupil funding measures derived from federal data include passthrough funding in the numerator but exclude students attached to this funding from the denominator, artificially inflating per-pupil ratios. Three forms of passthrough funding for students not educated by the school district where they reside are included in district-level funding totals: payments to private schools (V91), payments to charter schools (V92), and payments to other school systems (Q11). We illustrate this error in Pennsylvania and New Jersey and use data from all 46 impacted states to show how racial and economic funding gaps are understated as a result.
Researchers and policymakers analyzing national school-funding patterns typically use enrollment and fiscal data from the Common Core of Data’s Local Education Agency Finance Survey (the F-33 survey) to generate per-pupil funding figures. 1 However, inconsistencies in how “passthrough” funding and enrollments are reported in these data can erroneously inflate per-pupil funding ratios. Traditional public-school districts (TPSDs) in 46 states reported some form of passthrough funding in 2018–19: payments to private schools (V91), payments to charter schools (V92), and payments to other school systems (Q11). Although these funds are included in revenue and expenditure totals for the TPSDs passing them to other school systems (Table A1), the students funded with these dollars are excluded from enrollment totals for those districts. Because the numerator includes dollars for students excluded from the denominator, commonly used per-pupil funding ratios are artificially inflated as a result. We define artificial inflation as the difference between per-pupil finance ratios derived from F-33 data and per-pupil finance ratios derived from F-33 data after passthrough funding (V91, V92, and Q11) has been excluded from the numerator.
Although some researchers adjust their data to address this issue (e.g., Blagg et al., 2022), many do not (e.g., Batdorff et al., 2014; Morgan & Amerikaner, 2018). Drawing on illustrative data from Pennsylvania and New Jersey in 2018–19, supplemented with data from all impacted states in the online appendix, we document inaccuracies in per-pupil finance ratios derived from F-33 data and show how failing to properly account for passthrough funding can bias funding comparisons, especially by race and poverty. We then recommend procedures researchers can use to address these issues and call for the National Center for Education Statistics (NCES) to improve data collection. All affected states are listed in Table A1. Additional details on our data and methods as well as supplemental data for affected states are included in the Online Appendices.
Pennsylvania Example
A total of $4.1 billion in passthrough funding was included in district-level revenue and expenditure totals for Pennsylvania TPSDs (Table A1), but students receiving passthrough funding were excluded from F-33 enrollment variables reported for these districts (Online Appendix B). For example, the largest source of passthrough funding was from charter school tuition ($2.1 billion), and the 143,259 charter students funded by tuition are excluded from TPSD enrollment variables. Table 1 provides data on TPSDs with the greatest and lowest artificial inflation per pupil, illustrating how the magnitude of inflation varies by district and source of passthrough funding.
Most and least artificially inflated TPSDs in Pennsylvania, 2018–19
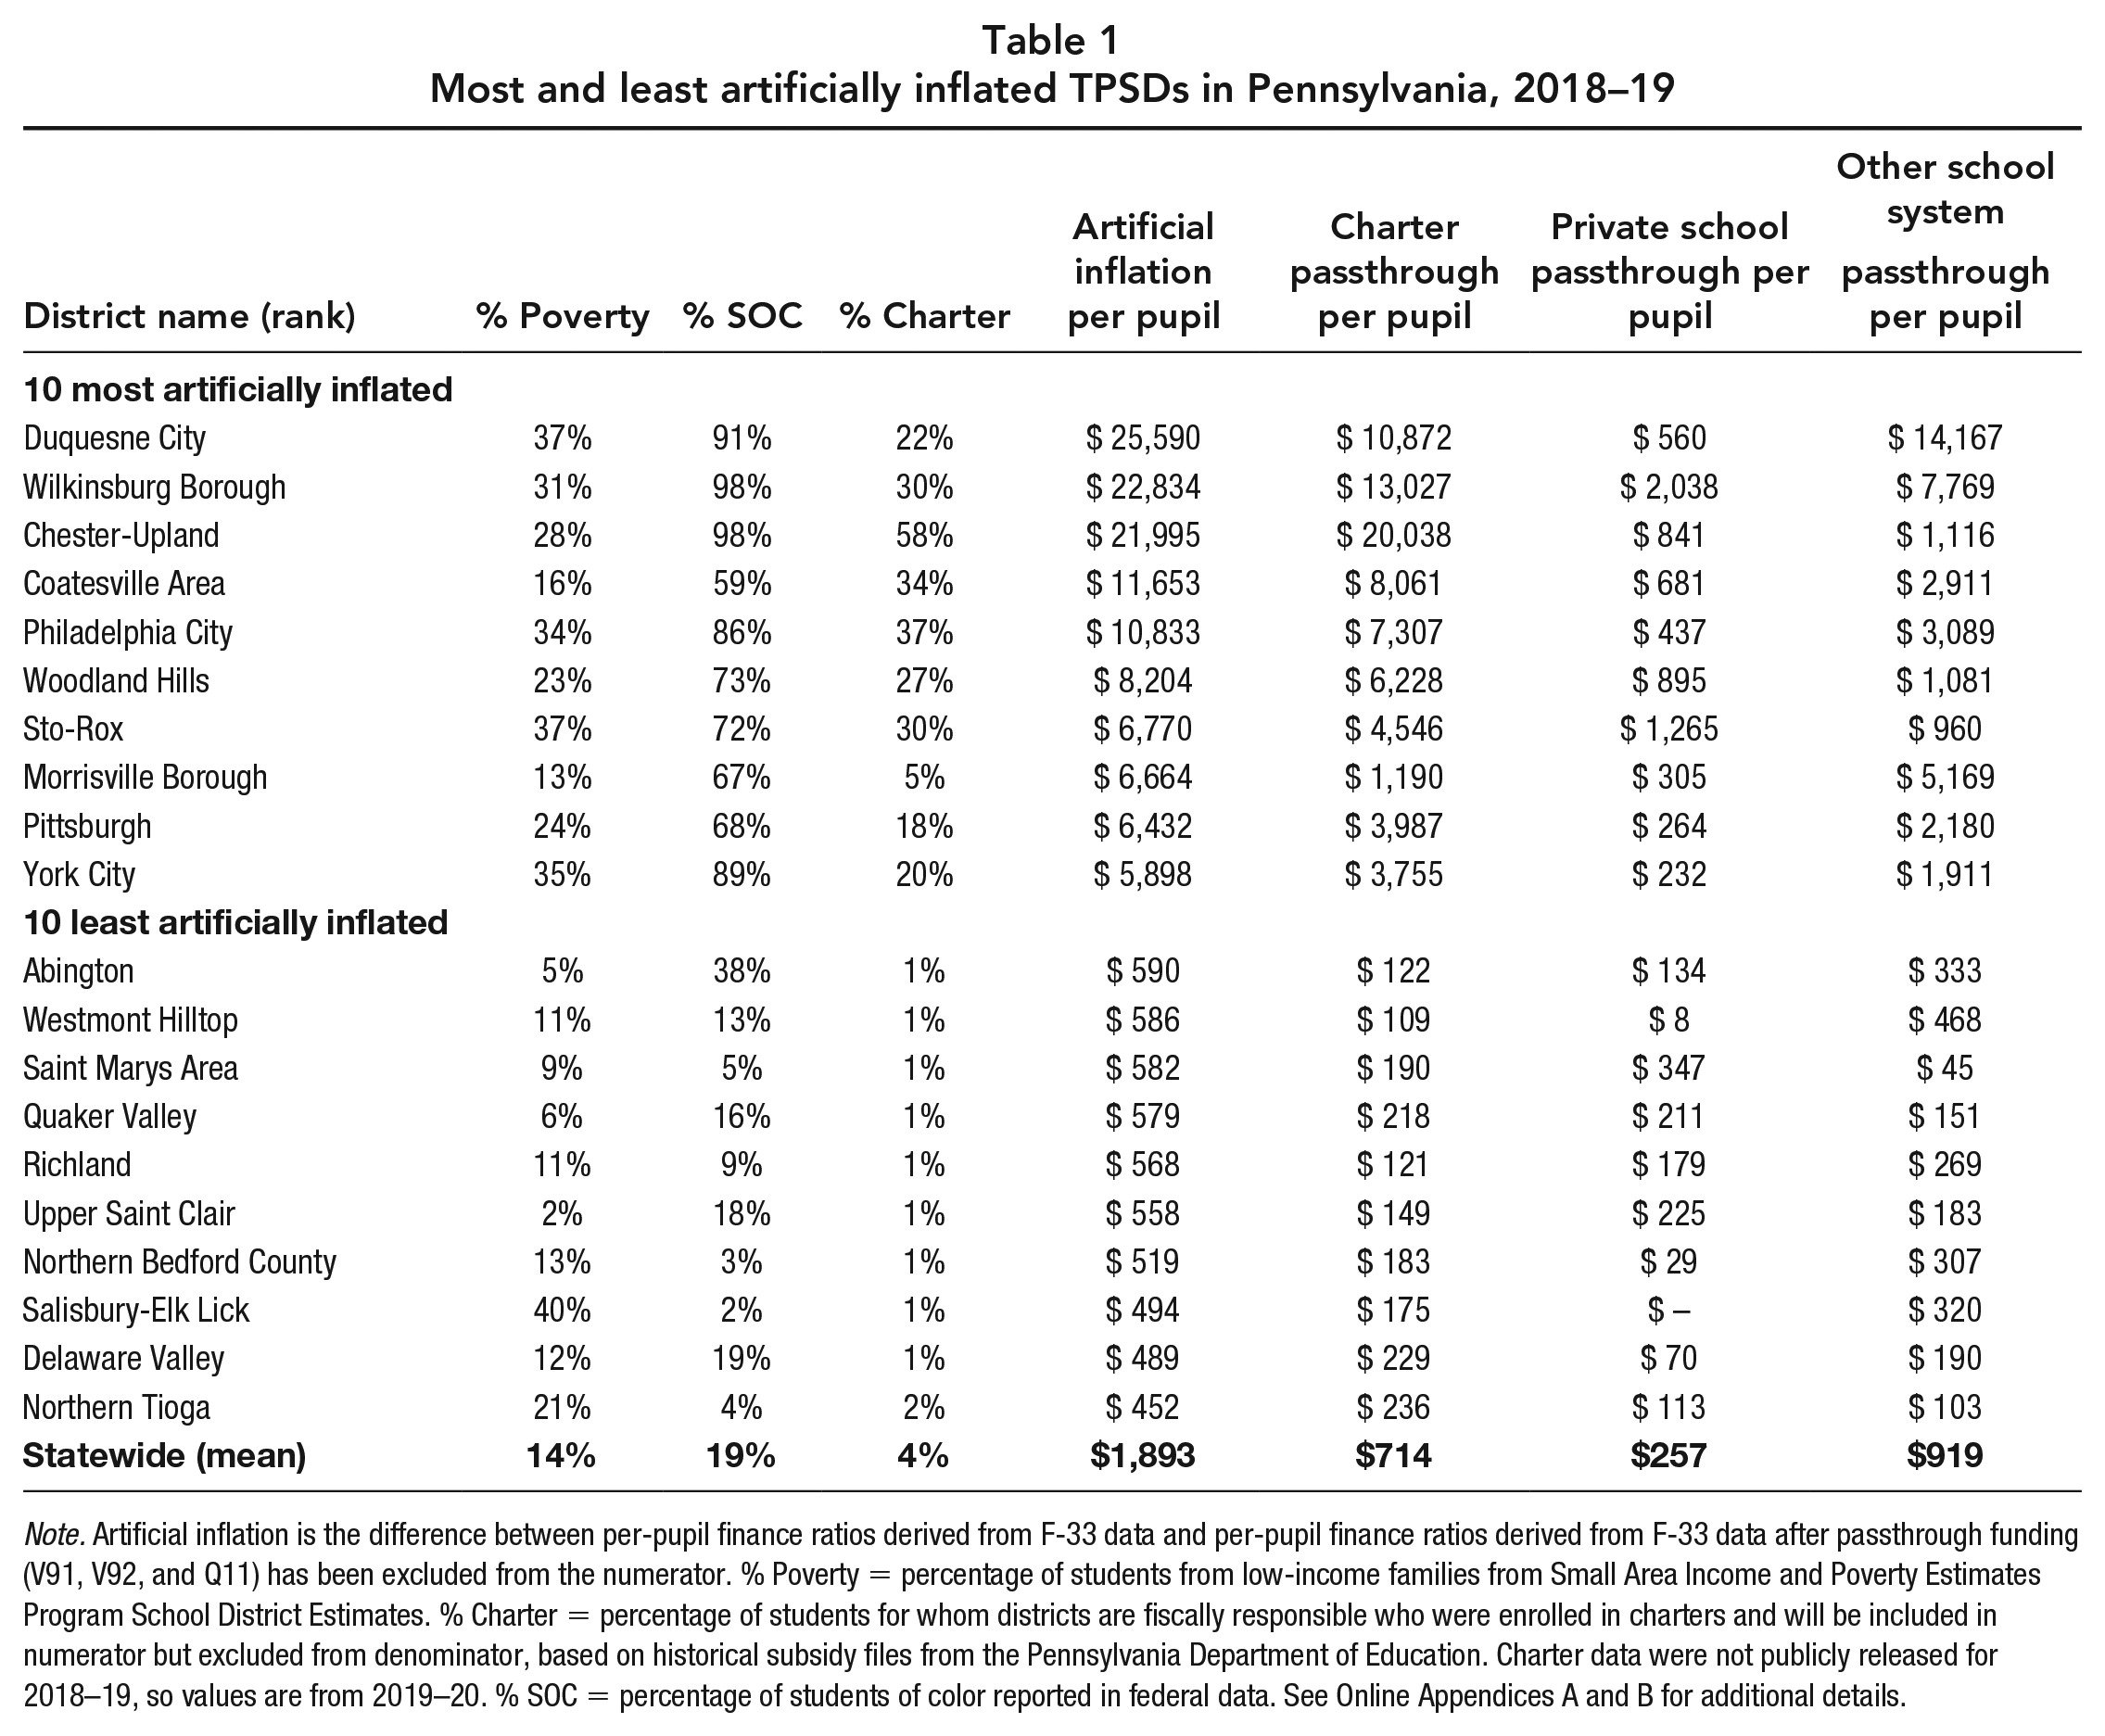
Note. Artificial inflation is the difference between per-pupil finance ratios derived from F-33 data and per-pupil finance ratios derived from F-33 data after passthrough funding (V91, V92, and Q11) has been excluded from the numerator. % Poverty = percentage of students from low-income families from Small Area Income and Poverty Estimates Program School District Estimates. % Charter = percentage of students for whom districts are fiscally responsible who were enrolled in charters and will be included in numerator but excluded from denominator, based on historical subsidy files from the Pennsylvania Department of Education. Charter data were not publicly released for 2018–19, so values are from 2019–20. % SOC = percentage of students of color reported in federal data. See Online Appendices A and B for additional details.
Consider Philadelphia, the largest TPSD in Pennsylvania. Of the students funded by Philadelphia, 37% attended charter schools (~73,842). Although $968 million in funding for these students are included in Philadelphia’s revenue and expenditure totals, the ~73,842 charter students covered by charter tuition are excluded from Philadelphia’s enrollment variable. In combination with artificial inflation from V91 and Q11, F-33 data erroneously inflate Philadelphia’s per-pupil funding by $7,307.
New Jersey Example
In New Jersey, tuition payments to other school systems (Q11) are the largest source of passthrough funding ($1.3 billion). New Jersey and a handful of other states operate school districts in which a portion of the student body attends schools in another district through sending-receiving relationships. The sending district is financially responsible for the students and pays tuition to the receiving district. In the F-33, the revenue associated with these students is included in the sending district, and the tuition payment to the receiving district is accounted for in expenditure variable Q11 (and also included in total expenditures). However, the F-33 excludes the sent students from the enrollment variable, artificially inflating per-pupil calculations in their home districts. In the most extreme example, the Bloomingdale school district funded 810 K–12 students but is reported as an elementary district with only 554 students. With $7.7 million in tuition expenses for high schoolers, Bloomingdale’s per-pupil revenue and expenditures are inflated by $13,933.
Implications for Measuring Funding Equity
The uneven impact of artificial inflation on per-pupil finance ratios within and between states can bias analyses of funding equity. For example, larger districts with high poverty rates and shares of students from racially minoritized backgrounds are disproportionately affected in states with charter passthrough funding because charter schools are concentrated in these communities (Table 1). Panel A in Figure 1 shows that 2018–19 per-pupil funding figures are substantially more inaccurate in high-poverty than in low-poverty school districts in Pennsylvania and New Jersey. This pattern also holds for high- versus low-minority districts (Panel B). 2
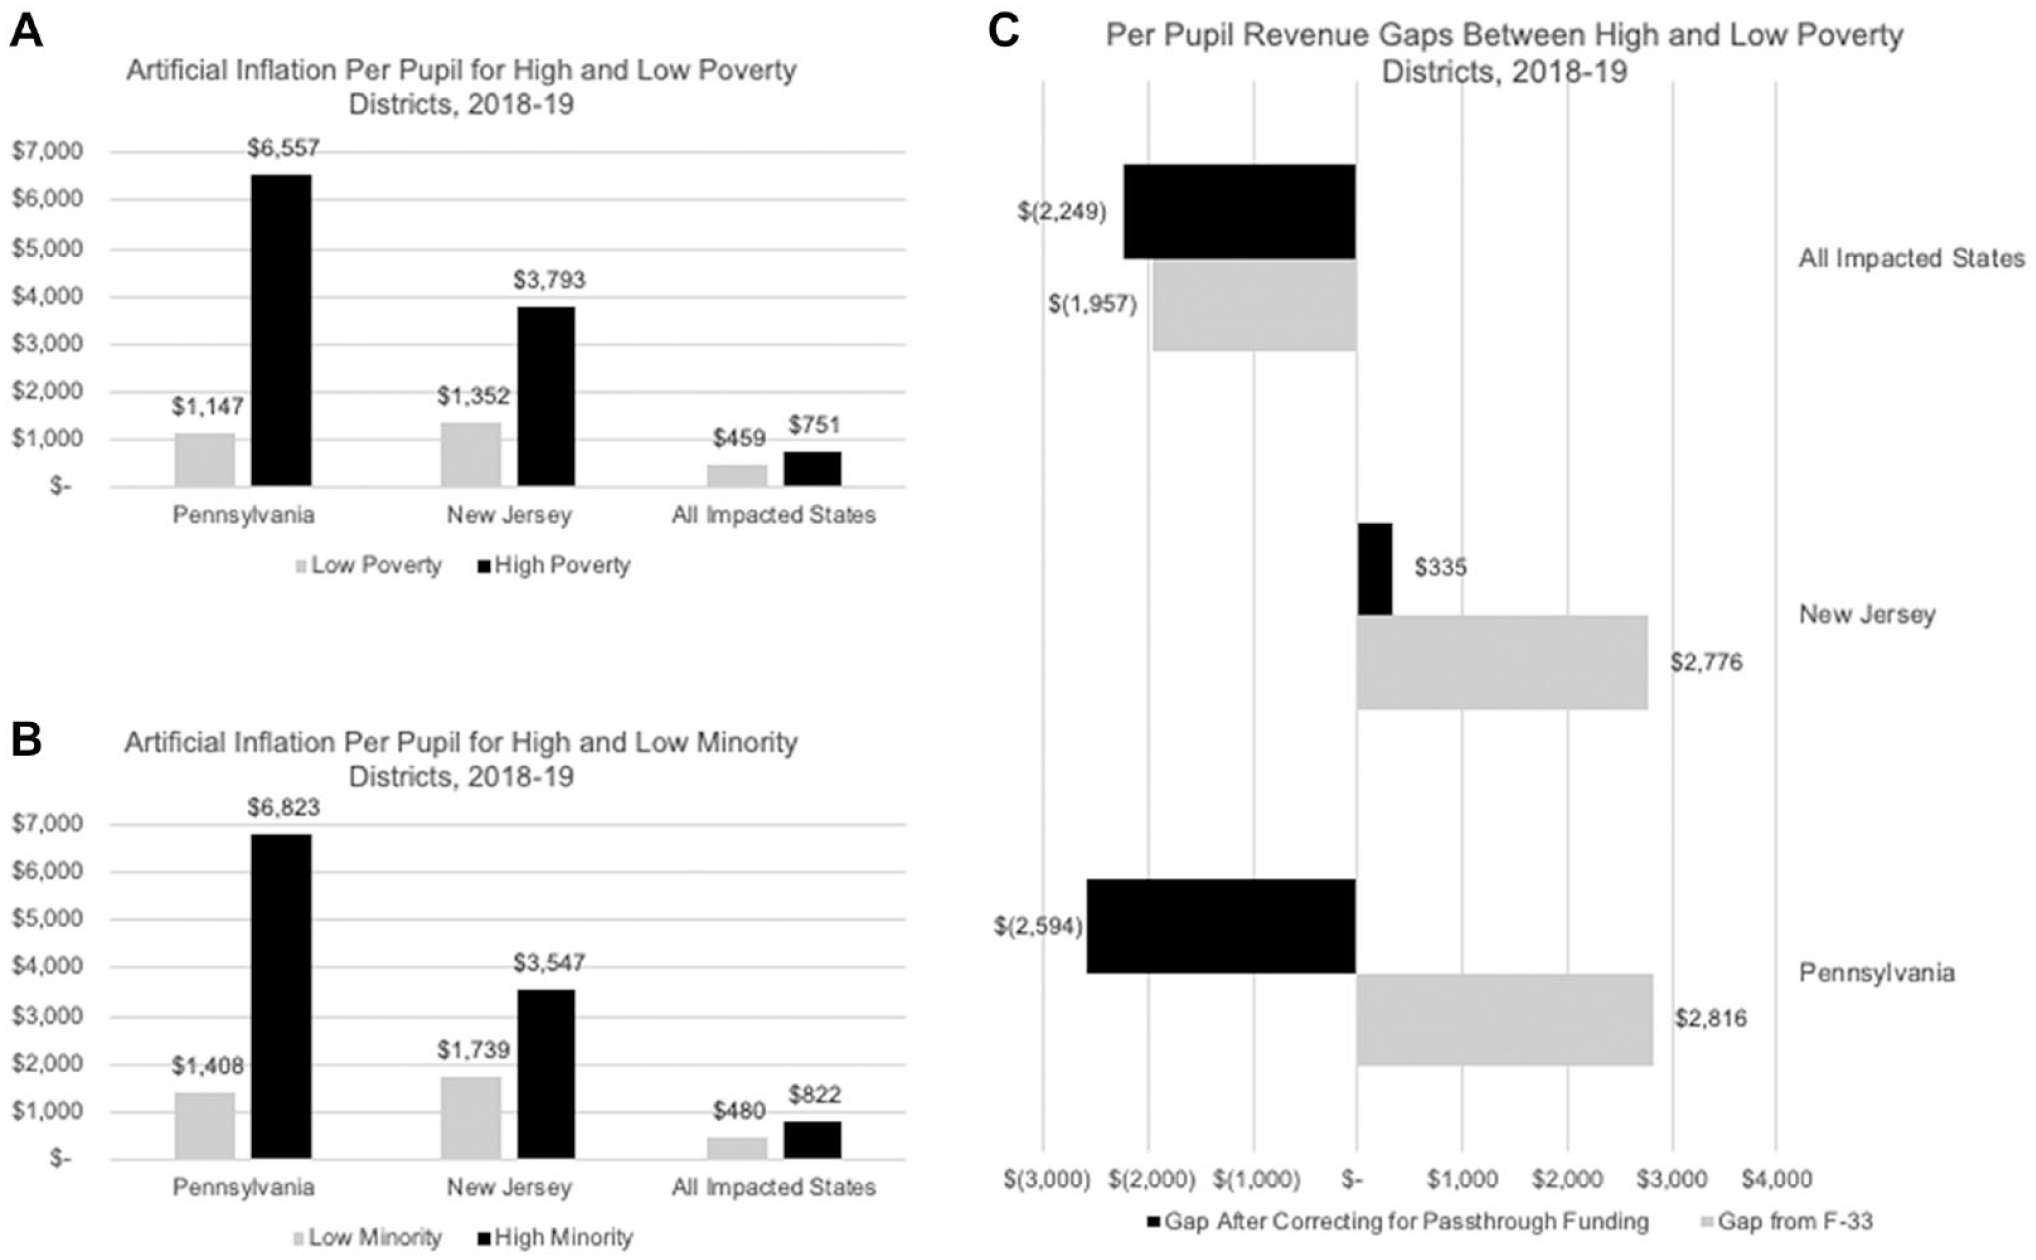
Note. Artificial inflation is the difference between per-pupil finance ratios derived from F-33 data and per-pupil finance ratios derived from F-33 data after passthrough funding (V91, V92, and Q11) has been excluded from the numerator. Panel A displays artificial inflation in per-pupil funding for high-poverty versus low-poverty school districts. High-poverty districts are those in the top quintile of the percentage of low-income students from Small Area Income Poverty Estimates. Panel B displays artificial inflation in per-pupil state and local revenues for high- versus low-minority school districts. High-minority districts are those in the top quintile of the percentage of students designated American Indian or Alaskan Native, Asian or Asian Pacific Islander, Black/African American, Hispanic, Native Hawaiian or Pacific Islander, or two or more races. Panel C shows the difference between average total revenue per pupil for high-poverty and low-poverty districts. Negative values are in parentheses and imply that high-poverty districts receive less revenue per pupil than do low-poverty districts. Positive values in Panel C imply that high-poverty districts receive more revenue per pupil than do low-poverty districts. Analyses are weighted by enrollment.
Although only a subset of impacted states reports passthrough charter funding, these patterns are consistent across affected states, suggesting the importance of adjusting for all passthrough funds.
Panel C compares funding gaps between high-poverty and low-poverty school districts, calculated with and without adjustments for passthrough funding. In artificially inflated F-33 data, high-poverty Pennsylvania TPSDs appear to receive more per-pupil revenue than do low-poverty districts. When passthrough funding is removed, Pennsylvania high-poverty districts receive less. In New Jersey, the per-pupil revenue advantage to high-poverty districts is essentially eliminated when passthrough funding is removed. The national data underestimate revenue gaps by poverty by 11%–15% in the 3 years presented. These patterns illustrate how artificially inflated per-pupil revenues can misrepresent funding gaps.
Discussion
Passthrough funding for students not included in districts’ membership counts are artificially inflating per-pupil funding figures in F-33 data. Nearly all states include some form of passthrough funding, although it is not always clear whether the students associated with that funding are properly accounted for. In the two examples provided and further explored in the online supplementary material, the magnitude of this artificial inflation varies by district. This pattern can bias estimates of funding gaps because high-minority and high-poverty districts are most impacted. We encourage researchers to avoid this inconsistency by subtracting variables Q11, V91, and V92 from total revenue, total state and local revenue, and total expenditure variables for all school districts before calculating per-pupil finance ratios. 3 We also encourage NCES to provide more detailed enrollment data so that researchers can distinguish between membership counts that include or exclude students associated with the three types of passthrough funding.
Supplemental Material
sj-pdf-1-edr-10.3102_0013189X221133396 – Supplemental material for Misrepresented Funding Gaps in Data for Some States
Supplemental material, sj-pdf-1-edr-10.3102_0013189X221133396 for Misrepresented Funding Gaps in Data for Some States by Matthew Gardner Kelly and Danielle Farrie in Educational Researcher
Footnotes
Notes
Authors
References
Supplementary Material
Please find the following supplemental material available below.
For Open Access articles published under a Creative Commons License, all supplemental material carries the same license as the article it is associated with.
For non-Open Access articles published, all supplemental material carries a non-exclusive license, and permission requests for re-use of supplemental material or any part of supplemental material shall be sent directly to the copyright owner as specified in the copyright notice associated with the article.