
Abstract
Objective:
We investigated changes in cortico–subcortical spatiotemporal dynamics to explore the treatment mechanisms of transcranial alternating current stimulation (tACS) in patients with Parkinson’s disease (PD).
Methods:
Resting-state functional magnetic resonance imaging (rs-fMRI) data were collected from 20 patients with PD and 20 normal controls (NC). Each patient with PD received successive multidisciplinary intensive rehabilitation treatment and tACS treatment over a one-year interval. Individual functional brain network mapping and co-activation pattern (CAP) analysis were performed to characterize cortico–subcortical dynamics.
Results:
The same tACS electrode placement stimulated different proportions of functional brain networks across the participants. CAP analysis revealed that the visual network, attentional network, and default mode network co-activated with the thalamus, accumbens, and amygdala, respectively. The pattern characterized by the de-activation of the visual network and the activation of the thalamus showed a significantly low amplitude in the patients with PD than in NCs, and this amplitude increased after tACS treatment. Furthermore, the co-occurrence of cortico–subcortical CAPs was significantly higher in patients with PD than in NCs and decreased after tACS treatment.
Conclusions:
This study investigated cortico–subcortical spatiotemporal dynamics in patients with PD and further revealed the tACS treatment mechanism. These findings contribute to understanding cortico– subcortical dynamics and exploring noninvasive neuromodulation targets of cortico–subcortical circuits in brain diseases, such as PD, Alzheimer’s disease, and depression.
Keywords
1 Introduction
Parkinson’s disease (PD) is a common, heterogeneous, and progressive neurodegenerative disorder, typically characterized by motor symptoms, such as tremors, rigidity, and postural instability [1]. In addition to motor symptoms, nonmotor symptoms are common and troublesome in PD, such as depression, anxiety, cognitive decline, and sleeping problems [2]. Pathologically, PD involves the loss of nigrostriatal dopaminergic neurons, which may lead to widespread functional and structural brain alterations from subcortical nuclei to the cortex [3]. In addition, an abnormal brain network is associated with alterations in alpha-synuclein levels, indicating high correlations between neuroimaging and dopaminergic biomarkers [3]. In a circuit model, cortical and subcortical regions are linked via hyperdirect, direct, and indirect pathways, supporting motor functions, such as action initiation, selection, and inhibition [4]. In patients with PD, cortico– subcortical circuit dysfunction has been implicated and served as a treatment target [5, 6].
Targeting critical subcortical hubs within the cortico–subcortical circuit, invasive deep brain stimulation (DBS) has been extensively used to alleviate motor symptoms in advanced PD [7]. During DBS treatment, electrodes and batteries are implanted into the target, and electrical currents are delivered to modulate neural activities. Typically, DBS targets are crucial hubs within cortico–subcortical circuits, such as the thalamus, subthalamic nucleus, and globus pallidus internus. However, the invasive treatment approach may result in surgical complications and post-operative side effects, such as infections, stroke, and seizures [8]. These risks and side effects limit the applications of DBS and emphasize the need for alternative treatments. As previously stated, although the loss of dopaminergic neurons is primarily discovered in subcortical regions, PD symptoms are associated with cortico–subcortical circuit dysfunction rather than regional abnormality [9]. In this regard, researchers have been exploring easy and noninvasive cortical stimulation techniques for modulating cortico–subcortical circuits and improving clinical symptoms in PD [10].
Transcranial electrical stimulation is a common form of noninvasive brain stimulation technique, including transcranial direct current stimulation (tDCS) and transcranial alternating current stimulation (tACS) [11]. Typically, tDCS is used to modulate neuronal activity, and tACS is used to modulate brain oscillations. In PD, tDCS has been extensively used and shown improvements in multiple symptoms, including the freezing of gait [12], upper limb motor [13], and executive function [14]. However, modulation effects are highly influenced by the stimulation frequency of DBS in PD studies [15], indicating the strength of tACS, which modifies brain excitability and oscillations by delivering sinusoidal alternating electric currents to the cortical target at a certain frequency [11, 16, 17]. According to some studies, certain frequencies and electrode montages of tACS can improve cognitive, emotional, and motor functions [18–20]. In a mouse model of PD, beta-frequency tACS over the primary motor cortex can protect dopaminergic neurons and improve motor impairments [21]. In patients with PD, theta and beta tACS over the primary motor cortex can modulate bradykinesia [22]. In addition, individualized tACS can improve the tremor in PD [18, 23]. However, one study applied tACS at 77.5 Hz with the forehead as a target and found no significant changes in off-medication unified Parkinson’s disease rating scale (UPDRS) scores [24]. Although the above tACS studies have indicated certain opportunities, precise stimulation parameters and cortical–subcortical circuit treatment mechanisms should be further understood in clinical settings.
A handful of research groups have combined neuroimaging and tACS to aid both target identification and medical assessment in the neuromodulation of PD. Previous studies have used electroencephalogram (EEG) to analyze treatment mechanisms because of high temporal resolutions. However, subcortical structures are a group of regions deep within the brain and are difficult to image. This suggests that a higher spatial resolution imaging modality than EEG is required to investigate subcortical disturbances in PD. Previous studies have used resting-state functional magnetic resonance imaging (rs-fMRI) to investigate functional interactions within cortico–subcortical circuits [25, 26] and revealed changes in these circuits in patients with PD [5, 6]. In addition, recent advances in rs-fMRI dynamic analysis have demonstrated noninvasively capture of brain dynamics with an improved temporal resolution. Using sliding window or framewise dynamic analysis, researchers have consistently captured rapidly switching functional connectivity patterns and revealed their relationships with cognitive functions [27], aging [28], and diseases [29]. Dynamic functional state analysis has also revealed that cortical regions flexibly synchronize with limbic regions (hippocampus/amygdala) or subcortical nuclei (thalamus/basal ganglia) at ultraslow frequencies [30]. These findings demonstrate the potential benefits of dynamic analysis for the study of cortico–subcortical circuits in PD.
In addition, recent rs-fMRI studies have emphasized the importance of individual mapping. That is, functional networks are not in the same anatomical positions across individuals. Previous studies have shown that individual functional mapping can better capture brain-behavior associations than group-level functional mapping [31], characterize individualized brain dynamics in healthy aging [32], and provide candidate neuroimaging markers for clinical psychiatric symptoms across different mental disorders [33]. Although individual mapping has been emphasized in transcranial magnetic stimulation (TMS) studies [34], individual differences in the same tACS montages are unclear. In addition, cortico–subcortical coordination is not limited to transitions between different dynamic functional connectivity states but occurs continuously because cortical and subcortical regions exhibit general simultaneity of dynamical changes. Abnormal dynamic functional connectivity states have been characterized in PD using sliding window analysis [29, 35]. Their studies have revealed altered global integration [29] and sensorimotor changes [35] in brain dynamics. However, the focus in PD has remained primarily on group-level functional brain mapping and sliding window dynamic analysis, with less work focused on the contributions of cortical and subcortical dynamic states at the individual level.
Despite the clear disturbance of cortico– subcortical circuits and tACS efficacy in PD, it remains unknown whether dynamic changes in individual cortico–subcortical networks can be associated with the treatment mechanisms of tACS. In this study, cortico–subcortical network dynamics are introduced by coupling physical therapy with tACS over the frontoparietal network with the help of rs-fMRI, demonstrating that tACS modifies co-activations in cortico–subcortical regions. Our study had three aims. First, we hypothesize that different functional networks can be activated even when large electrodes are placed on the same targets. Second, we attempt to describe the spatial and temporal co-activations of individual cortical and subcortical networks. Third, we hypothesize that changes in cortico– subcortical co-activations are related to clinical improvements after tACS.
2 Methods
2.1 Participant demographics
This study included 20 patients with PD recruited from the Neurological Rehabilitation Center, Beijing Rehabilitation Hospital between January 2020 and June 2021, and 20 age-matched normal controls (NCs). The inclusion and exclusion criteria of participants have been reported in a previous study [36]. In brief, idiopathic patients with PD were diagnosed by the Movement Disorder Society (MDS) diagnostic criteria [37] and with the Hoehn and Yahr scale of ≤2.5 during the “ON” stage [38]. All participants had no history of head injury (stroke, depression, or learning disability) and were suitable for MRI data collection. This study protocol was in accordance with the Declaration of Helsinki and approved by the Ethics Committee of Beijing Rehabilitation Hospital, Capital Medical University (No. 2019bkky-001; No. 2020bkky010). Each participant voluntarily provided written informed consent after fully understanding this research.
The gender and age of each participant were collected. In addition, clinical assessments were performed to evaluate motor and nonmotor functions in patients with PD, including the parts I–IV of the sponsored revision of the UPDRS (MDS-UPDRS) [39], the Timed Up-and-Go Test (TUG) [40], the Mini-mental State Examination (MMSE) [41], the Montreal Cognitive Assessment (MoCA) [42], the Hamilton Anxiety Scale (HAMA) [43], and the Hamilton Depression Scale (HAMD) [44]. The patients with PD received multidisciplinary intensive rehabilitation treatment (MIRT) [45] in 2020 and tACS (Neuroconn) treatment in 2021. tACS electrodes were placed in FC1 and FC2 according to the 10–20 system. 40 min of sine waves were delivered with 2 mA amplitude at 4 Hz.
2.2 Imaging parameters
Structural three-dimensional T1-weighted and rs-fMRI data were collected with a 3 T MRI scanner (GE SIGNA Pioneer). T1-weighted imaging data were collected with the following parameters: repetition time (TR) = 8.06 ms, echo time (TE) = 3.06 ms, inversion time (TI) = 450 ms, flip angle (FA) = 15°, field of view (FOV) = 300 × 300 mm2, matrix resolution = 512 × 512, slice thickness = 1 mm, and number of slices = 160. A total of 240 volumes of rs-fMRI data were collected with the following parameters: TR = 2000 ms, TE = 35 ms, FA = 90°, FOV = 280 × 280 mm2, matrix resolution = 128 × 128, slice thickness = 4 mm, and number of slices = 40. The patients with PD on dopaminergic medication and NCs were instructed to close their eyes and stay awake during the rs-fMRI scan.
2.3 Data preprocessing
The data preprocessing pipeline has been described in our previous study (32). T1 image preprocessing was performed using FreeSurfer software (version 6.0.0), and functional image preprocessing was performed using the FSL toolkit (version 5.0.2). The “recon-all” processing pipeline of FreeSurfer was applied to complete cortical reconstruction and volumetric segmentation. Functional images were preprocessed with the following steps: removing the first 10 time points, slice timing correction, head motion correction, alignment of the functional image to the standard MNI via the T1 structural image space, 0.01–0.1 Hz filtering, regression of white matter, cerebrospinal fluid, and global signals, and finally smoothing. The framewise displacement (FD) was calculated to characterize the head motion [46]. In addition, voxel-level individual functional images were transformed into vertex-level images in the fsaverage4 space using FreeSurfer’s bbregister, mri_vol2surf, and mri_surf2surf commands.
2.4 Individual functional brain network mapping and electrical field simulation
The individual functional brain network mapping process was performed using the HFR_ai toolkit [31]. The preprocessed rs-fMRI time series were iteratively clustered and matched to the group-level 18-network parcellation [47]. Briefly, the network core signal was determined by group-level parcellation. Then, the signal of each vertex was iteratively matched with the network core signal, and the network label of each vertex was updated according to signal similarity. The network core signal was updated according to the vertex label, and the vertex label was repeatedly assigned until the vertex label was stabilized. Finally, the individual brain functional network parcellation of each participant was obtained.
Individual electrical fields were simulated using SimNIBS3 software (version 3.2.3). The brain was segmented into five layers: scalp, bone, cerebrospinal fluid, gray matter, and white matter. According to a previous study [48], the electrical conductivity of these five layers was set as 0.465, 0.010, 1.654, 0.275, and 0.126 S/m, respectively. A rectangular electrode of size 5 cm × 7 cm was placed at FC1 and FC2 of the individual brain model. The tACS frequency and amplitude were set to 4 Hz and 2 mA, respectively, to obtain the electric field distribution through finite element simulation. Then, the electric field distribution was mapped to the fsaverage4 space for the following analysis.
2.5 Individual network responses to tACS
The electrodes used for electrical stimulation were large and covered a wide range of functional brain networks; thus, it was unknown whether precise localization was necessary. Therefore, this study first investigated whether the same electrode arrangement (FC1 and FC2) activated the same individual brain networks. Similar to a previous TMS study, we set the minimum activation threshold [34]. For each participant, 80% of the maximum simulated electric field was set as the minimum activation threshold and the vertices with an electric field in the range of 80%–100% of the maximum value were defined as activation zones. The proportion of each functional network within the activation zone was calculated as the individual network response. In this study, seven cortical networks were analyzed: the attentional network (AN), default mode network (DMN), frontoparietal network (FPN), limbic network (LN), motor network (MN), salience network (SN), and visual network (VN). The response value of each network for each participant was the number of activation vertices within the corresponding network divided by the total number of vertices in the activation zone.
2.6 Cortico–subcortical co-activation pattern (CAP) analysis
As described in the previous section, both the left and right cortical regions were parcellated into 18 networks, resulting in a total of 36 networks in the left and right brains. The left and right subcortical regions were divided into a total of 19 regions, resulting in a total of 55 cortical and subcortical regions for the whole brain. In addition, four fMRI sessions (before and after MIRT and tACS treatment) were collected for each patient with PD (a total of 20 patients with PD), and one fMRI session was collected for each NC (a total of 20 NCs). Finally, a total of 100 fMRI sessions and 240 time points per session were collected.
CAP analysis pipeline was similar to previous studies [28, 49]. To analyze the overall spatial activation of the whole brain, the CAP pipeline was first constructed using 55 cortical and subcortical regions. 24000 time points (100 sessions and 240 time points per session) were used as samples for the CAP algorithm, and the mean values of 55 regions were used as features. The K-means clustering algorithm was applied in the range of k from 2 to 20, and the Pearson correlation distance was defined as the clustering distance. Then, R 2 gain was calculated for different k values using the Energy_landscape toolbox [50], and the mean correlation coefficients of paired CAPs were also calculated.
2.7 Spatial and temporal features
Spatial changes were characterized by amplitudes of cortical and subcortical clustering centers. Amplitudes were calculated as the mean of the absolute signal in the given center, indicating fluctuations in the center. In detail, cortical centers were an 8 × 36 matrix, and subcortical centers were an 8 × 19 matrix. For each cortical center, the mean of the center vector (1 × 36) was calculated as the cortical amplitude. For each subcortical center, the mean of the center vector (1 × 19) was calculated as the subcortical amplitude. In addition, absolute values were used for the subcortical and cortical centers. Spatial changes were calculated on the basis of cortical and subcortical clustering centers. Pearson correlation analysis was used to evaluate spatial similarities among pairs of centers.
Temporal features were characterized by co-occurrence. After cortical clustering, a vector was generated for each participant, indicating which cortical state each time point belonged to. Similarly, a vector of subcortical state labels was generated for each participant. Co-occurrence was calculated as the intersection of cortical and subcortical vectors.
2.8 Statistical analysis
Statistical analysis was performed using MATLAB 2014a. For the patients with PD, clinical assessments and spatiotemporal characteristics were compared using a nonparametric paired Wilcoxon rank sum test with FD as the covariate to evaluate significant differences after treatment. In addition, differences between the patients with PD and NCs were evaluated by an unpaired Wilcoxon rank sum test with gender, age, and FD as covariates. Spearman correlations were applied to explore the relationships between imaging markers and clinical assessments with gender, age, and FD as covariates. Bonferroni correction was used to correct multiple comparisons.
3 Results
3.1 Clinical improvement
Motor, emotional, and cognitive functions were assessed with the following scales: UPDRS-I, UPDRS-II, UPDRS-III, UPDRS-IV, TUG, Berg, MoCA, MMSE, HAMA, and HAMD. Similar to fMRI data collection, scale information was collected four times for each patient. A nonparametric rank sum test was used to test significant changes in scale scores before and after treatment. As depicted in Fig. 1, the UPDRS-I (MIRT before 8.71 ± 0.17, after 6.4 ± 0.18, p = 0.007; tACS before 10.10 ± 0.22, after 7.52 ± 0.19, p = 0.002), UPDRS-II (MIRT before 11.76 ± 0.23, after 8.85 ± 0.18, p = 0.002; tACS before 11.19 ± 0.15, after 9.43 ± 0.17, p = 0.005), UPDRS-III (MIRT before 30.74 ± 0.43, after 26.6 ± 0.47, p = 0.032; tACS before 30.48 ± 0.34, after 27.48 ± 0.35, p = 0.015), TUG (MIRT before 9.63 ± 0.09, after 8.62 ± 0.11, p = 0.002; tACS before 9.25 ± 0.09, after 8.34 ± 0.07, p = 0.004), MoCA (MIRT before 26.1 ± 0.13, after 27.85 ± 0.14, p < 0.001; tACS before 27.15 ± 0.15, after 28.14 ± 0.12, p = 0.002), and HAMD (MIRT before 8.19 ± 0.25, after 4.9 ± 0.15, p = 0.002; tACS before 9.29 ± 0.20, after 7 ± 0.15, p = 0.022) scales changed significantly before and after both treatments (p < 0.05 after Bonferroni correction). The HAMA scales showed significant changes after MIRT treatment, but not after tACS treatment (MIRT before 11.38 ± 0.32, after 7.5 ± 0.30, p = 0.005; tACS before 10.52 ± 0.27, after 8.43 ± 0.20, p = 0.081). Conversely, the Berg (MIRT before 54.33 ± 0.08, after 55.15 ± 0.06, p = 0.076; tACS before 52.86 ± 0.11, after 54.4 ± 0.07, p = 0.005) and MMSE (MIRT before 28.10 ± 0.08, after 29.05 ± 0.07, p = 0.11; tACS before 28.48 ± 0.09, after 29.19 ± 0.07, p = 0.008) scales tended to increase after MIRT treatment, but not significantly, whereas the tACS treatment significantly increased the scale scores, indicating the potential benefits of tACS treatment in motor and cognitive areas. No significant changes were found in UPDRS-IV (MIRT before 2.95 ± 0.17, after 2.5 ± 0.16, p = 0.25; tACS before 2.86 ± 0.12, after 3.05 ± 0.13, p = 0.63).
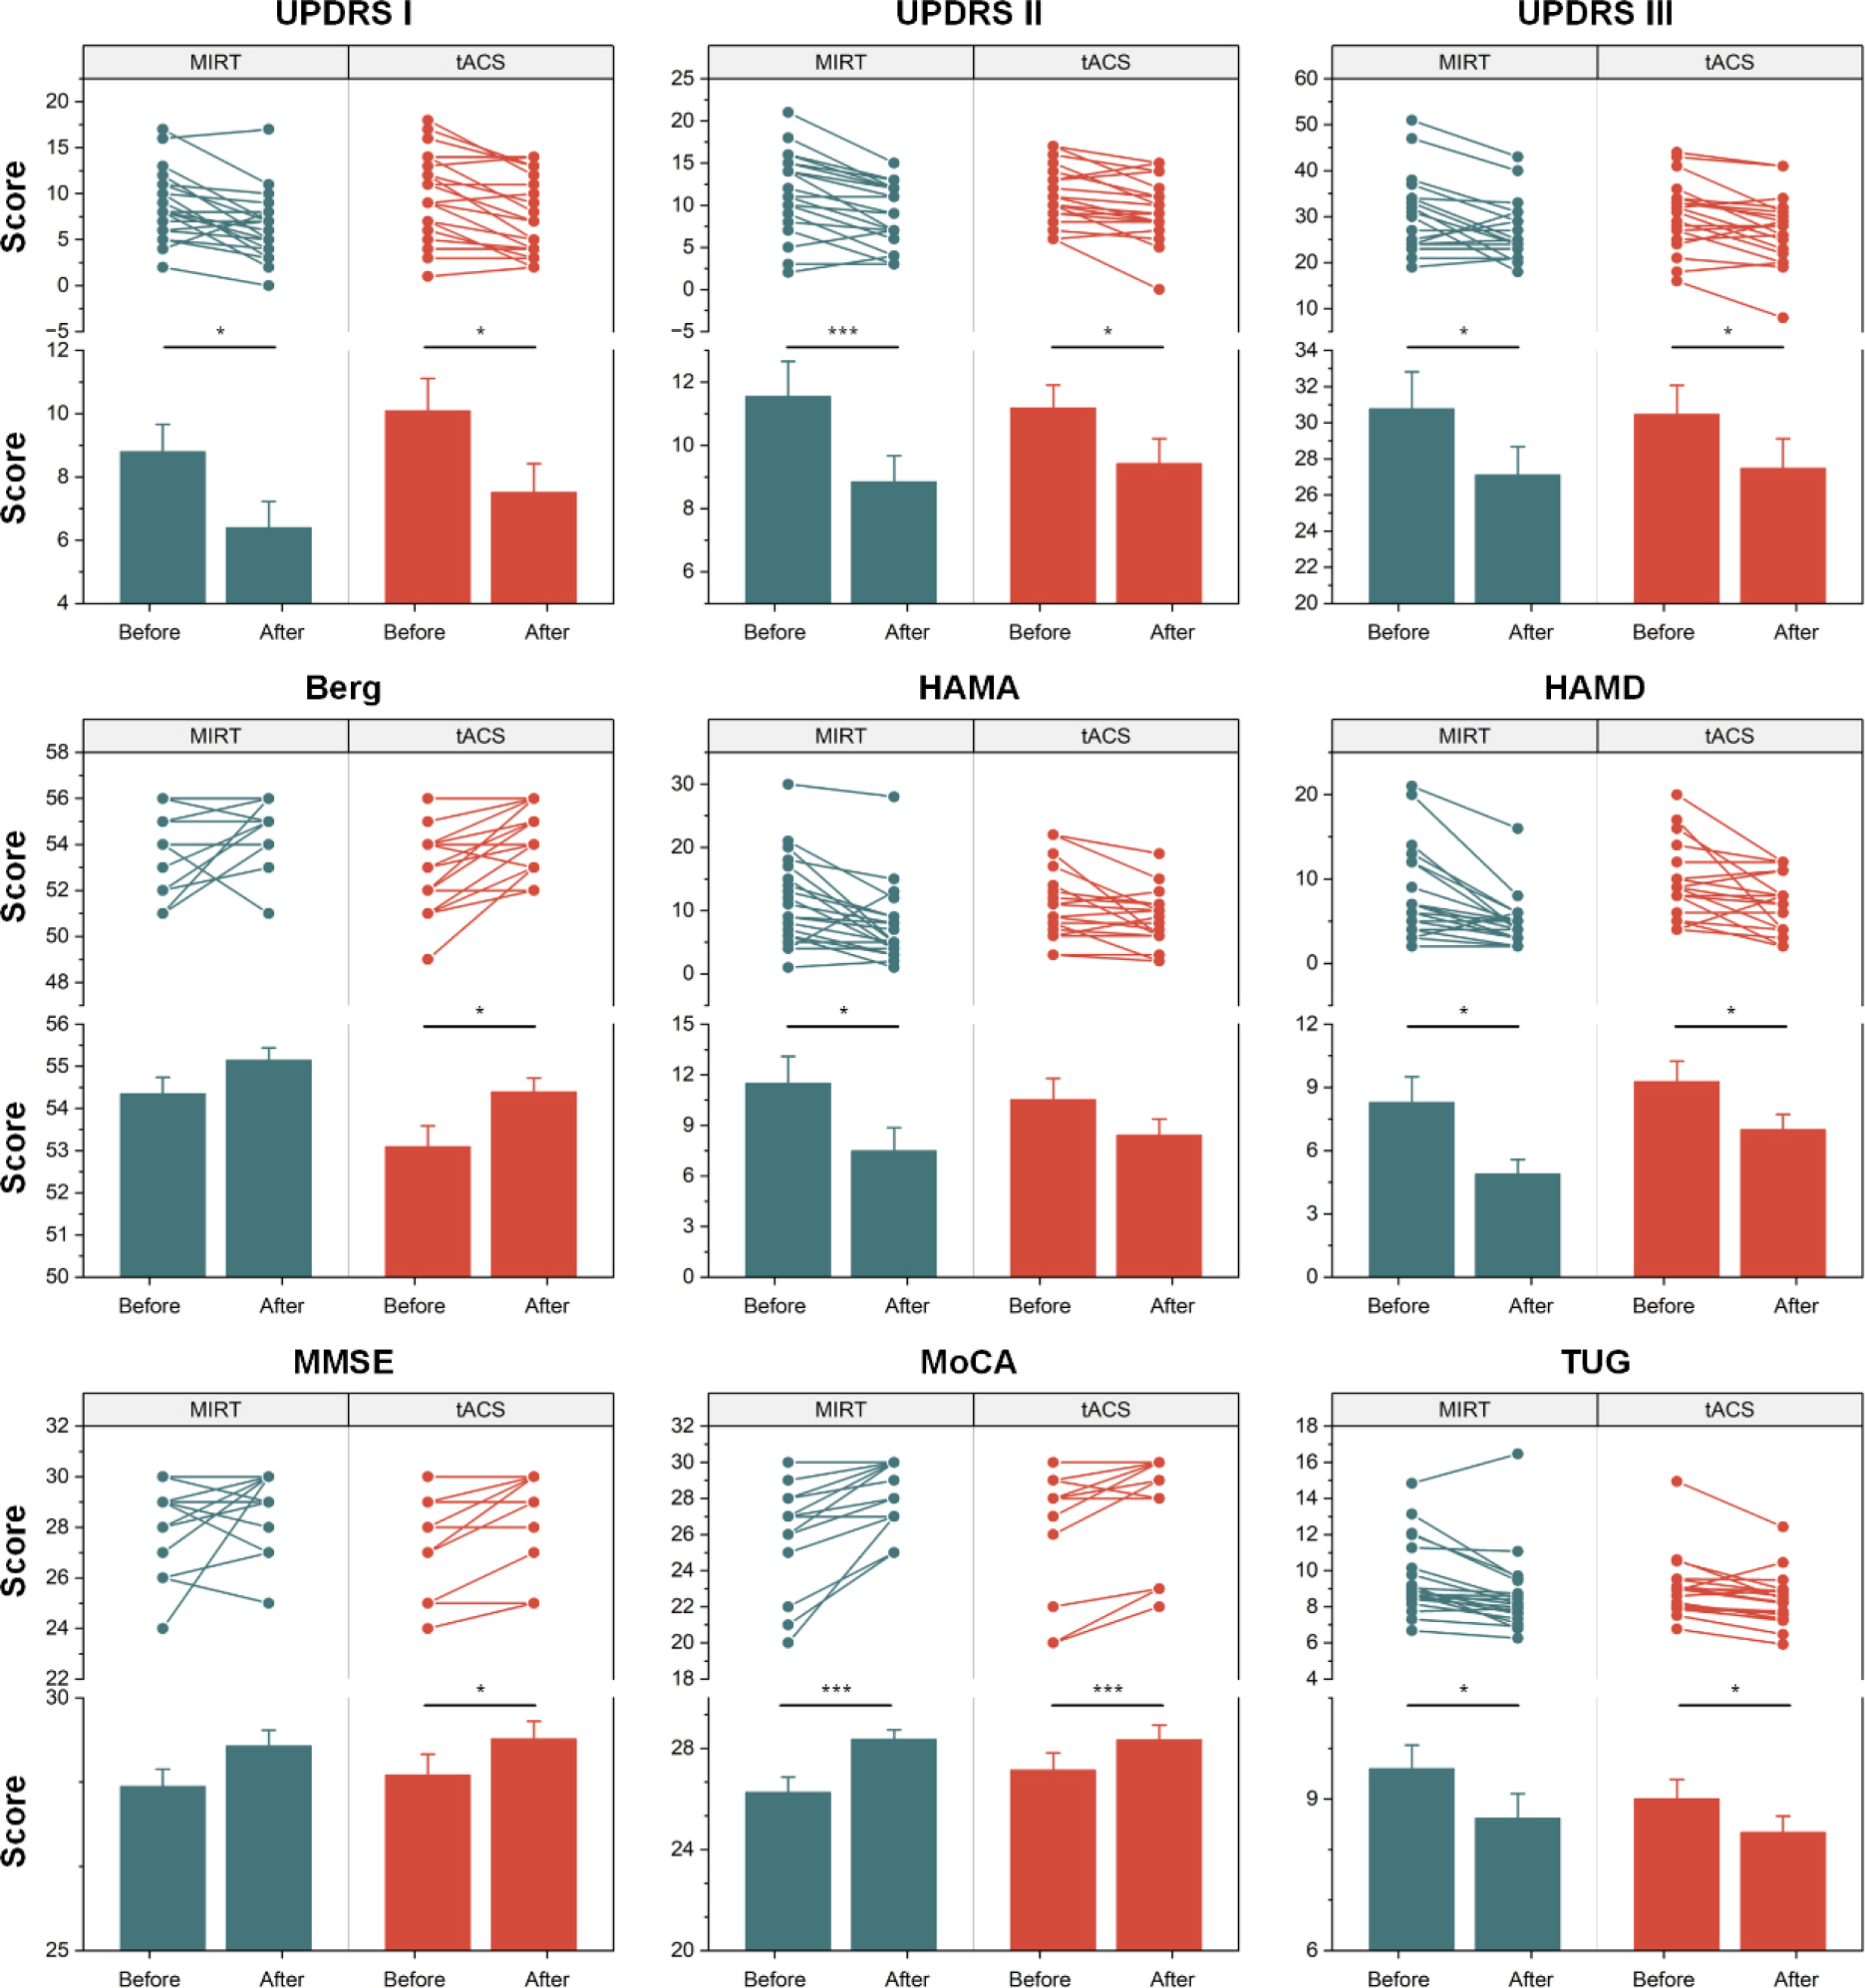
Clinical differences in treatment. A nonparametric paired Wilcoxon rank sum test was performed on clinical scale scores to evaluate improvements in treatment, including MIRT and tACS. * and *** indicate Bonferroni corrected p < 0.05 and p < 0.001, respectively.
3.2 Individual parcellation and electrical simulation results
As depicted in Fig. 2, most participants simulated large electric fields in the MN (0.34 ± 0.009), LN (0.28 ± 0.009), and FPN (0.22 ± 0.007). In addition, the activation ratio values of these three networks were significantly higher than those of the four networks AN (0.02 ± 0.002), DMN (0.08 ± 0.006), SN (0.02 ± 0.001), and VN (0.04 ± 0.006) (p < 0.05 after Bonferroni correction). The activation ratio values of these three networks did not differ significantly.
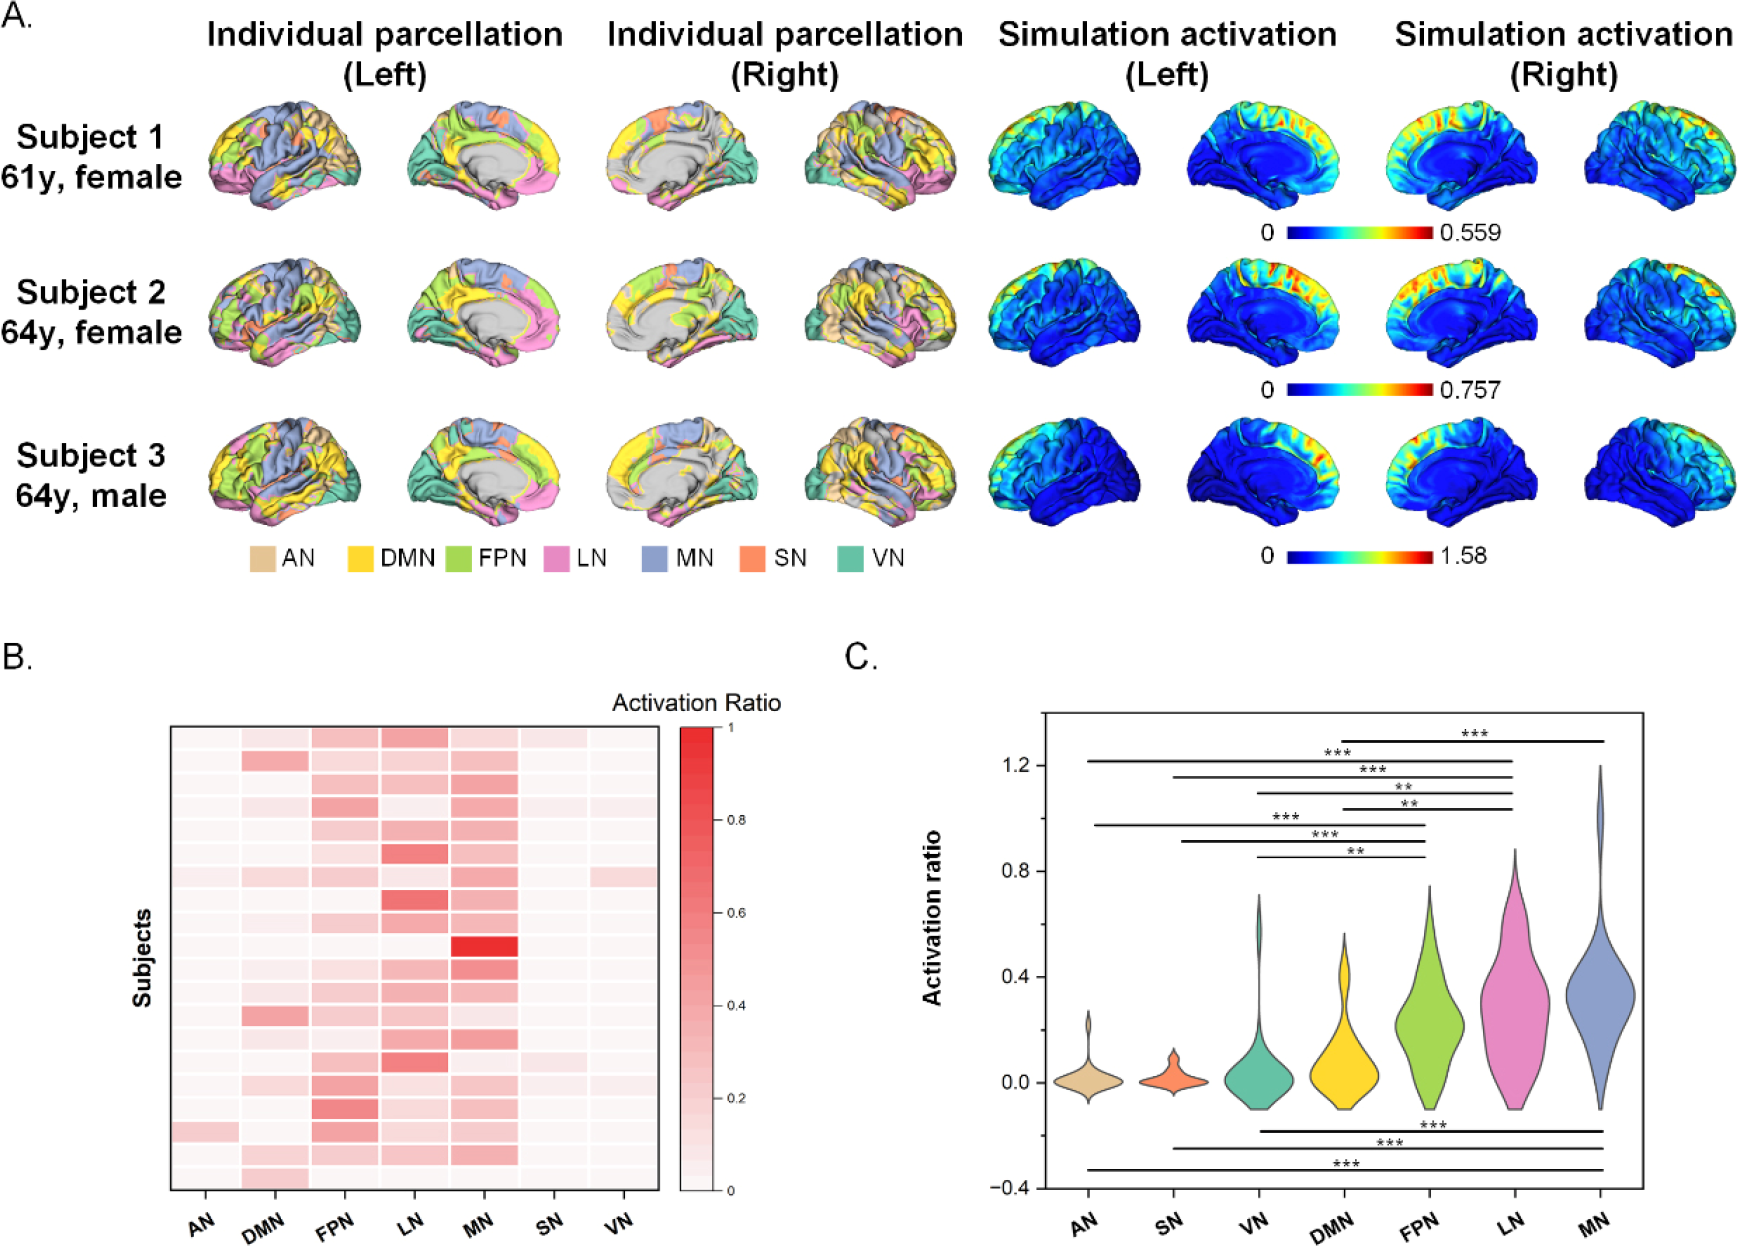
Individual differences in electrical simulations. (A) Individual functional parcellation and simulation activation. (B) Individual activation ratio. 80% peak activation was defined as the activation threshold. (C) Activation ratio differences among networks. Activation ratio values of all networks were calculated for all participants, and differences among networks were compared using nonparametric rank sum tests. ** and *** indicate Bonferroni corrected p < 0.01 and p < 0.001, respectively. AN = attentional network, DMN = default mode network, FPN = frontoparietal network, LN = limbic network, MN = motor network, SN = salience network, and VN = visual network.
Furthermore, Spearman correlation analysis was performed to investigate whether the activation ratio values of the MN, LN, and FPN correlated with the improvement in scales before and after tACS treatment. As depicted in Fig. 3, MN activation values were significantly and positively correlated with the scores of the UPDRS-III (r = 0.456, p = 0.029), MoCA (r = 0.558, p = 0.010), and TUG (r = 0.479, p = 0.026) scales. FPN activation values were significantly and negatively correlated with the scores of the UPDRS-III (r = −0.439, p = 0.039) and MoCA (r = −0.554, p = 0.014) scales. LN activation values were significantly and positively correlated with the scores of the UPDRS-I (r = 0.596, p = 0.006) scale. These results suggest that the combination of electric field simulation and individual brain network mapping can serve as a potential marker for predicting the effectiveness of tACS treatments.
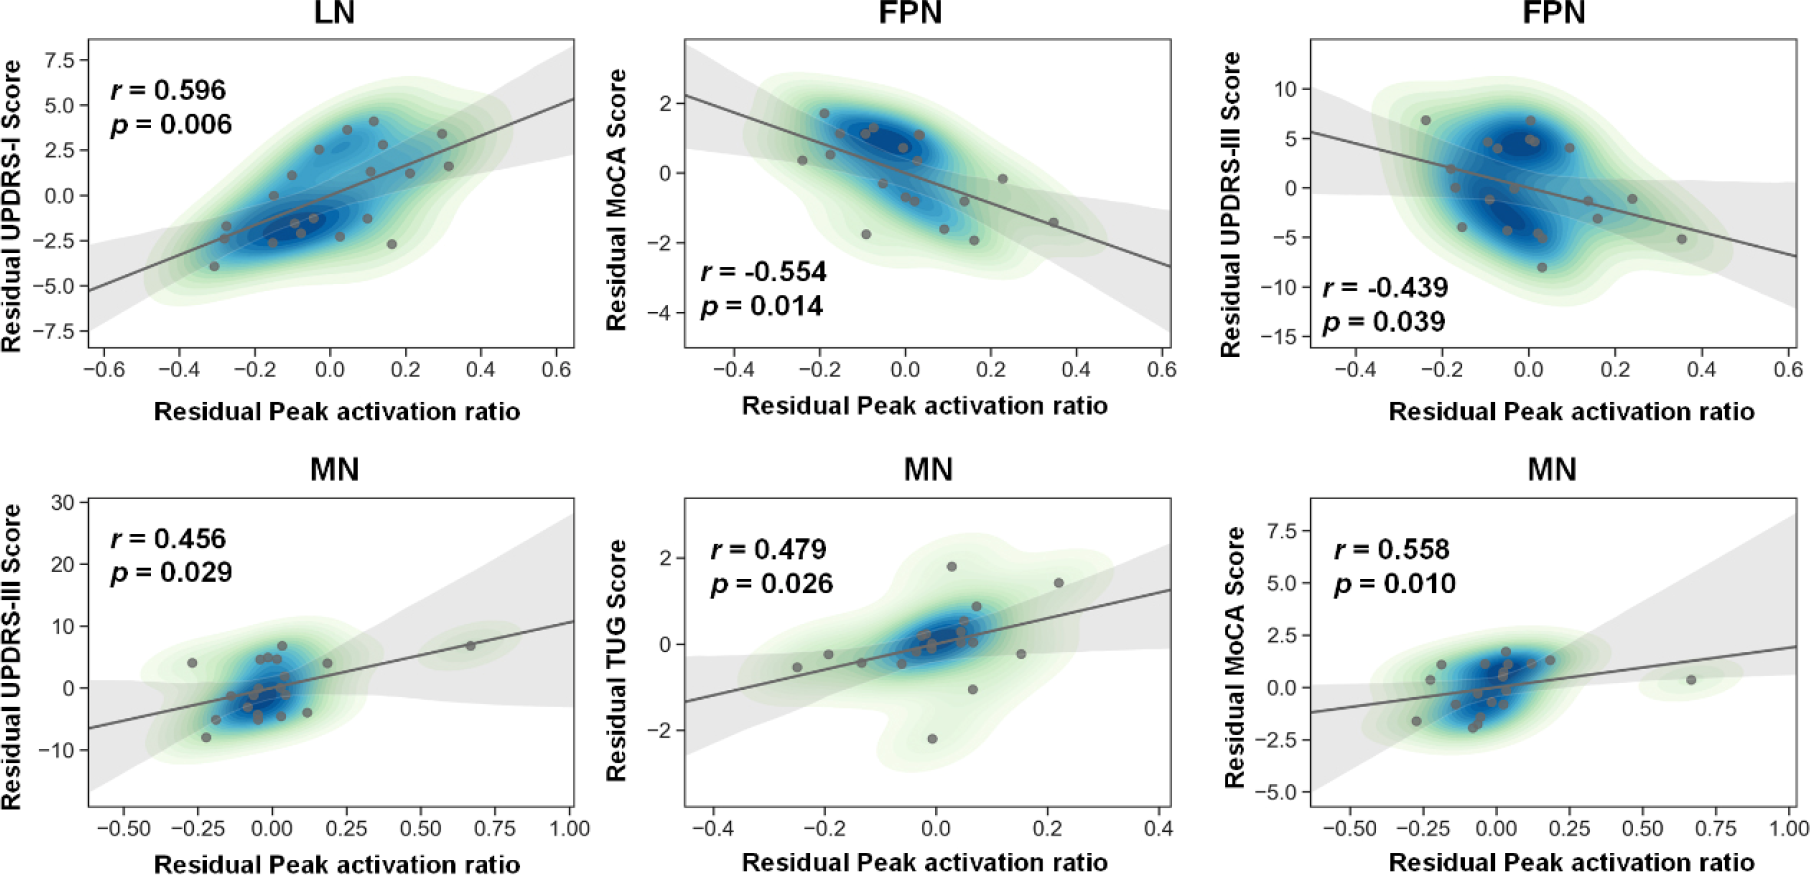
Correlations between clinical scores and peak activation ratio. Spearman correlation efficient (r) and significance p values are shown. AN = attentional network, DMN = default mode network, FPN = frontoparietal network, LN = limbic network, MN = motor network, SN = salience network, and VN = visual network.
3.3 Cortical and subcortical CAPs
The results of cortical and subcortical CAPs are depicted in Fig. 4. When k = 6, the R 2 gain was less than 0.01 [Fig. 4(A)] and the negative correlation was strong (average r = −0.976) [Fig. 4(B)]. Therefore, k was set as 6 in this study. The heat maps of six cluster centers are shown in Fig. 4(C). Negative correlations of pairwise centers are shown in Fig. 4(D).
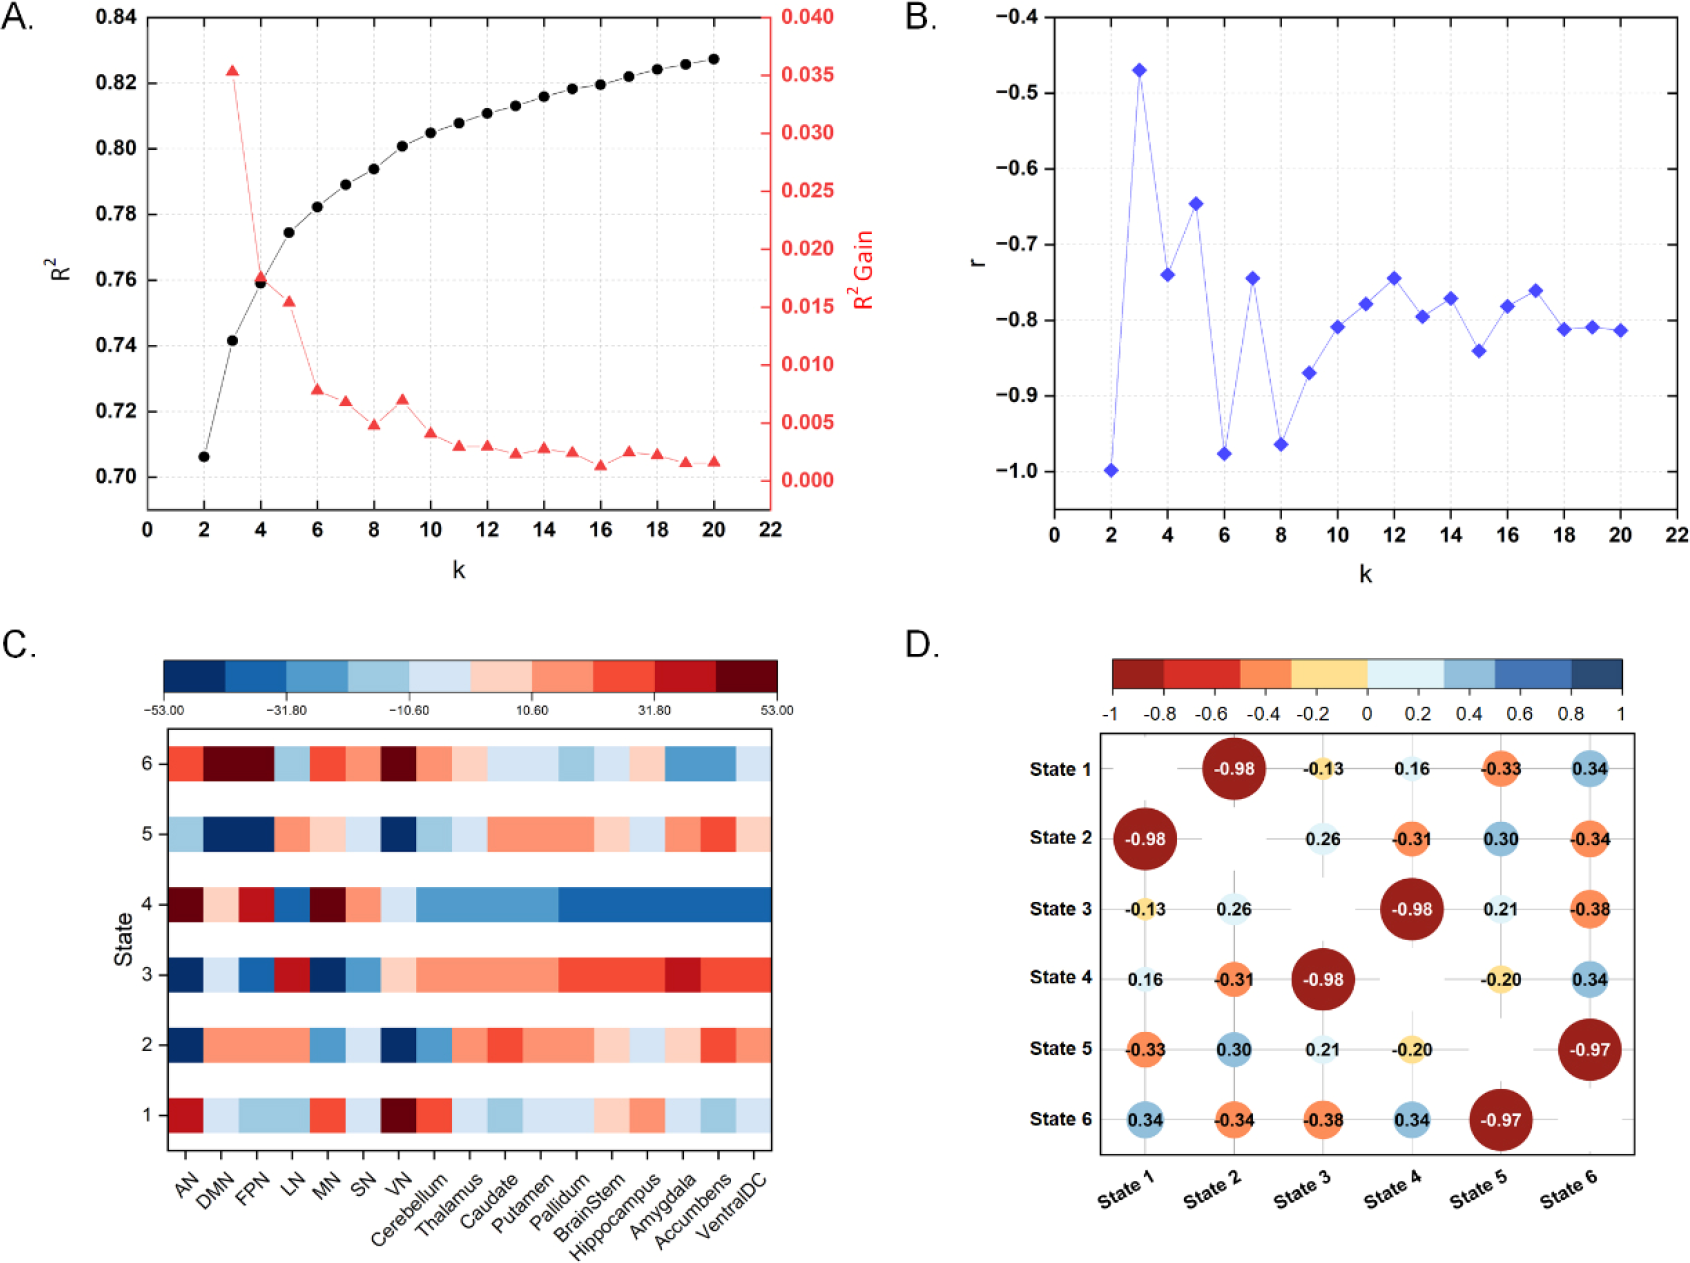
Co-activation pattern analysis (CAP). (A) Clustering R 2 gain changes with k. (B) Average similarity changes of paired CAPs with k. (C) Six state centers. (D) Similarities of paired CAPs when k = 6. AN = attentional network, DMN = default mode network, FPN = frontoparietal network, LN = limbic network, MN = motor network, SN = salience network, and VN = visual network.
According to the whole brain CAP results, signal strengths in the subcortical regions were weak. Therefore, to strengthen spatial activation patterns between the cortical and subcortical regions, CAPs were constructed using signals in the cortical and subcortical regions, respectively.
That is, cortical CAPs were constructed with features of 36 cortical region signals, and subcortical CAPs were constructed with features of 19 cortical region signals. Then, the k-means clustering algorithm was used to solve the six clustering centers. Figure 5(A) depicts the clustering results, and Fig. 5(B) shows the brain network template. Based on the template, the dominant network of each clustering state was defined using the average signal intensity.
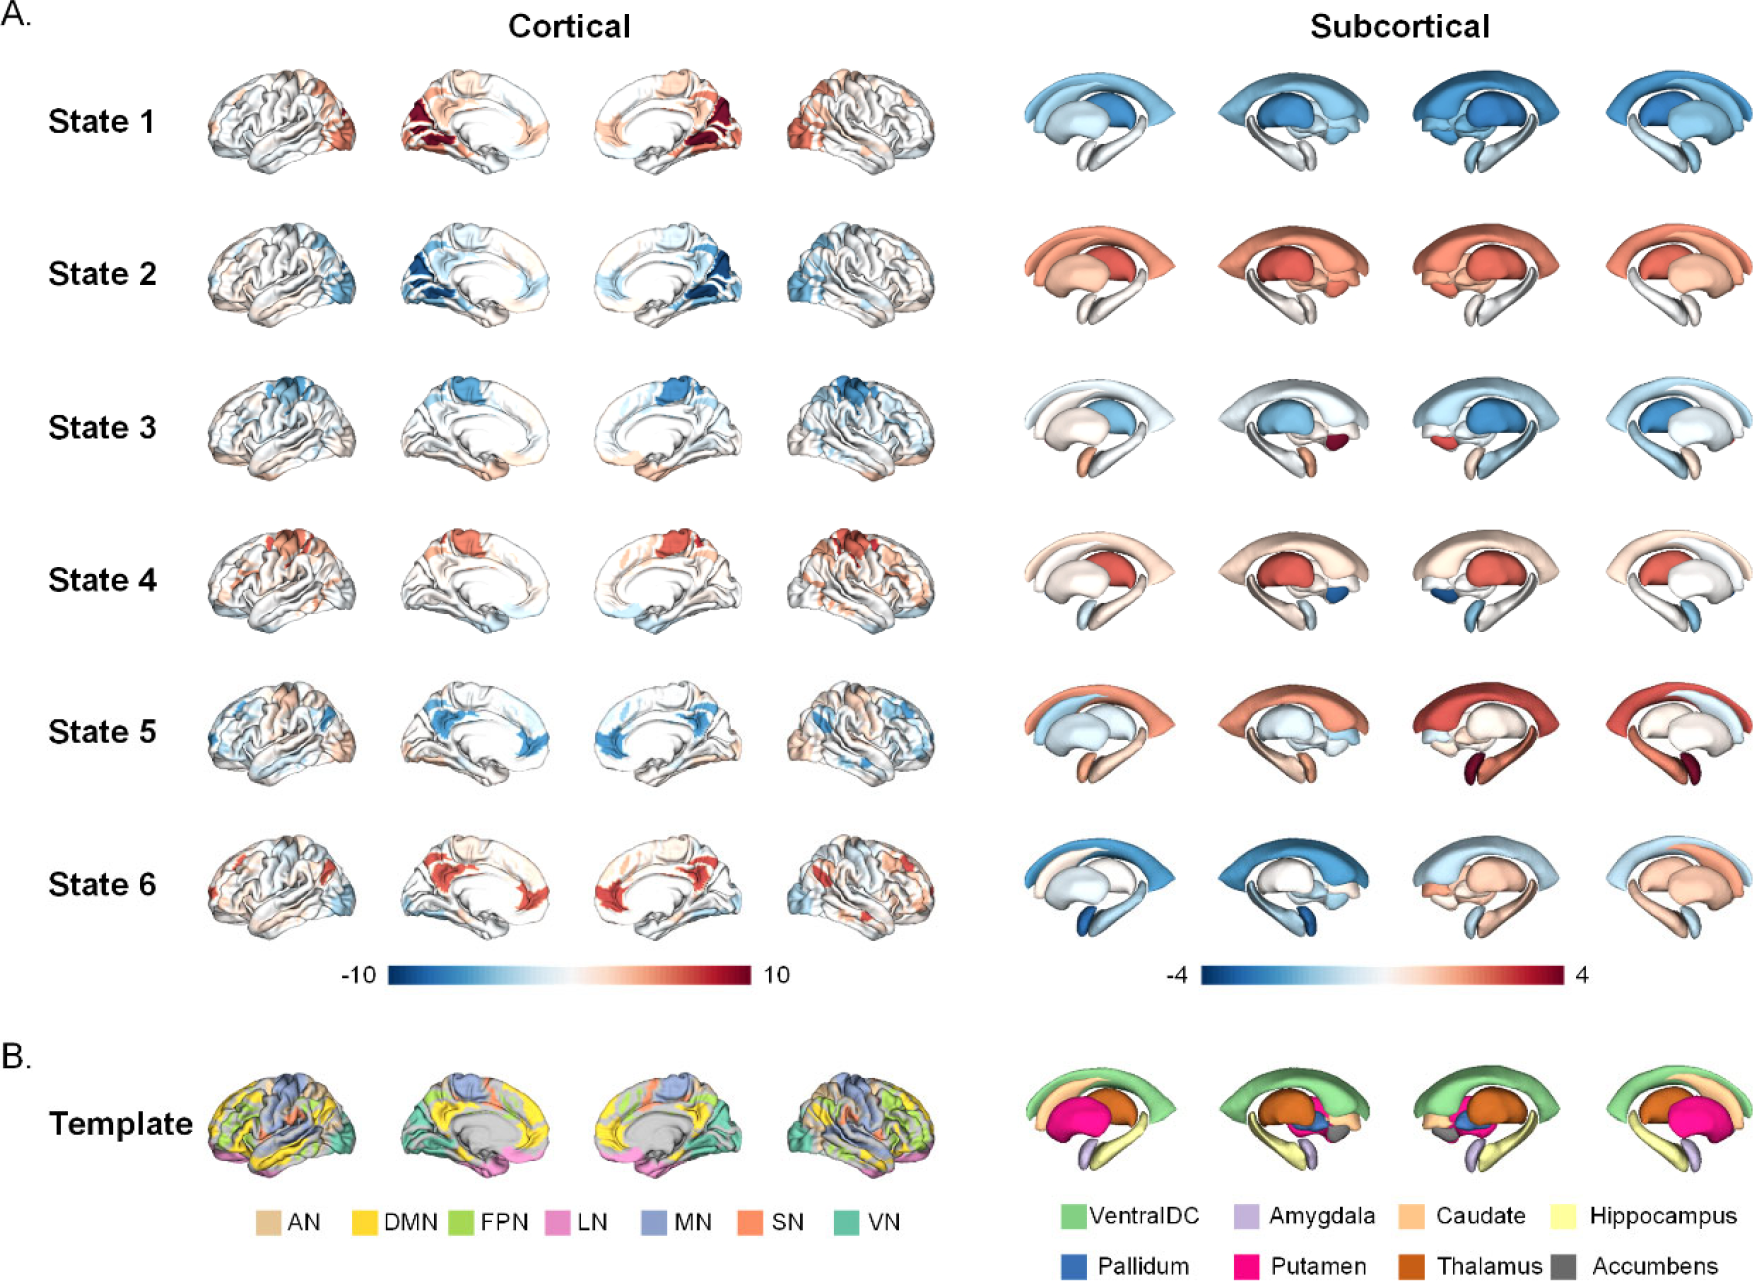
Centers of cortical and subcortical co-activation patterns (CAPs). (A) Cortical and subcortical states. (B) Group templates of different cortical and subcortical regions. AN = attentional network, DMN = default mode network, FPN = frontoparietal network, LN = limbic network, MN = motor network, SN = salience network, and VN = visual network.
In the definition of the six cortical states, average signals within the seven networks (AN, DMN, FPN, LN, MN, SN, and VN) were plotted and displayed in a ridge regression plot [Fig. 6(A)]. The signal distribution of the ridge regression plots can reveal the dominant network in each state, which showed high signal values. Furthermore, absolute values of paired CAP (states 1 and 2, states 3 and 4, and states 5 and 6) signals were averaged as amplitudes to characterize differences in amplitudes among networks. As depicted in Fig. 6(B), the VN (15.57 ± 0.07) amplitude is significantly higher than that of the other six networks (AN: 6.34 ± 0.04; DMN: 5.36 ± 0.04; SN: 3.02 ± 0.02; LN: 2.92 ± 0.02; MN: 2.71 ± 0.02; FPN: 2.71 ± 0.02) for states 1 and 2; the AN (10.45 ± 0.05) amplitude is significantly higher than that of the other six networks (MN: 6.67 ± 0.04; FPN: 5.54 ± 0.04; SN: 5.48 ± 0.04; LN: 5.17 ± 0.04; VN: 3.05 ± 0.02, DMN: 2.69 ± 0.02) for states 3 and 4; the DMN (7.45 ± 0.04) amplitude is significantly higher than that of the other six networks (FPN: 6.26 ± 0.03; AN: 4.50 ± 0.03; SN: 4.49 ± 0.04; VN: 4.26 ± 0.03; MN: 2.79 ± 0.02; LN: 2.42 ± 0.02) for states 5 and 6. Based on the above results, states 1–6 were defined as V+, V−, A−, A+, D−, and D+, respectively.
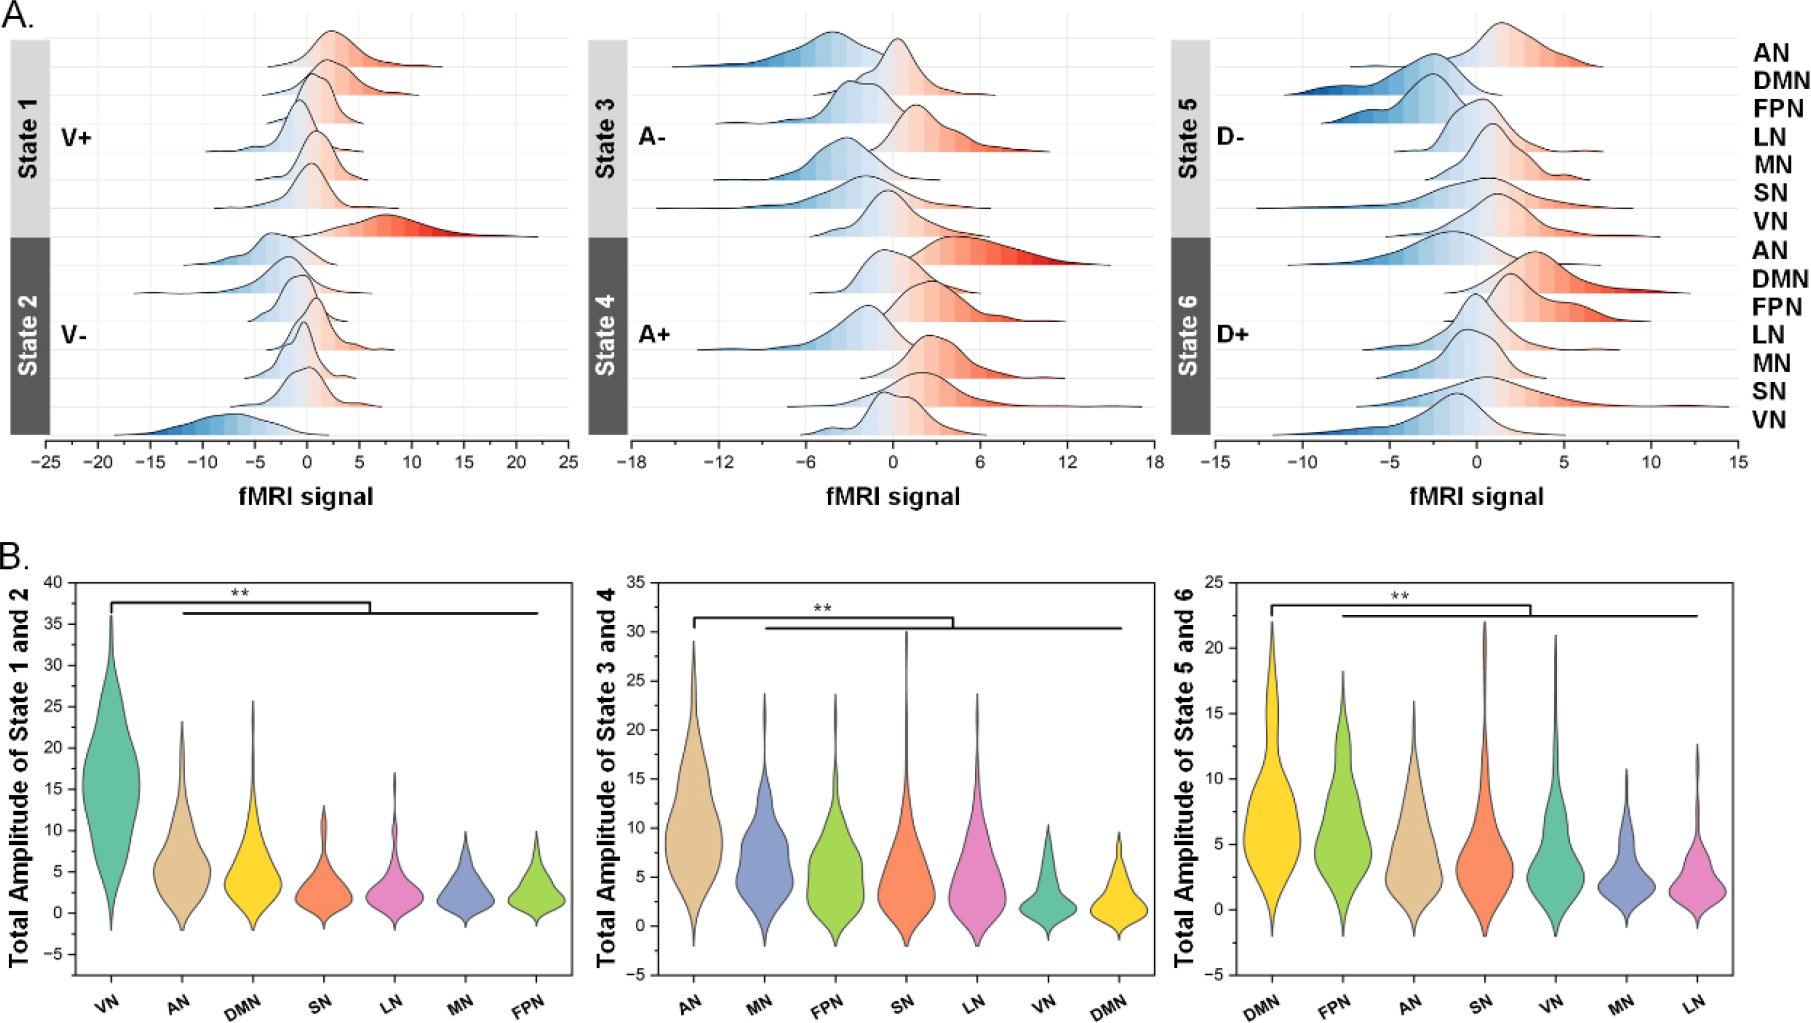
Spatial characteristics of paired cortical CAPs. (A) Network signal distributions of six CAPs. (B) Amplitude differences among seven networks for each pair of CAPs. ** indicates Bonferroni corrected p < 0.01. AN = attentional network, DMN = default mode network, FPN = frontoparietal network, LN = limbic network, MN = motor network, SN = salience network, and VN = visual network.
Similarly, in the definition of the six subcortical states, average signals within the eight regions, including the thalamus, caudate, putamen, pallidum, hippocampus, amygdala, accumbens, and ventral diencephalon (ventralDC), are plotted and displayed in a ridge regression plot [Fig. 7(A)]. The signal distribution of the ridge regression plots can reveal the dominant network in each state, which showed high signal values. Furthermore, absolute values of paired CAP (states 1 and 2, states 3 and 4, and states 5 and 6) signals were averaged as amplitudes to characterize differences in amplitudes among regions. As depicted in Fig. 7(B), the average amplitude of the thalamus (6.61 ± 0.05) is significantly higher than that of the ventralDC (5.48 ± 0.04), caudate (4.61 ± 0.03), pallidum (4.11 ± 0.03), putamen (3.47 ± 0.03), amygdala (3.18 ± 0.02), and hippocampus (2.67 ± 0.02) for states 1 and 2; the average amplitude of the accumbens (7.76 ± 0.06) was significantly higher than that of the ventralDC (4.38 ± 0.04), amygdala (3.75 ± 0.03), pallidum (3.03 ± 0.03), hippocampus (2.96 ± 0.02), caudate (2.61 ± 0.02), and putamen (2.25 ± 0.02) for states 3 and 4; the average amplitude of the amygdala (6.37 ± 0.04) was significantly higher than that of the accumbens (3.37 ± 0.02), thalamus (3.22 ± 0.02), caudate (3.68 ± 0.03), and putamen (2.53 ± 0.02) for states 5 and 6. Based on these results, states 1–6 were defined as thalamus−, thalamus+, accumbens+, accumbens−, amygdala+, and amygdala−, respectively.
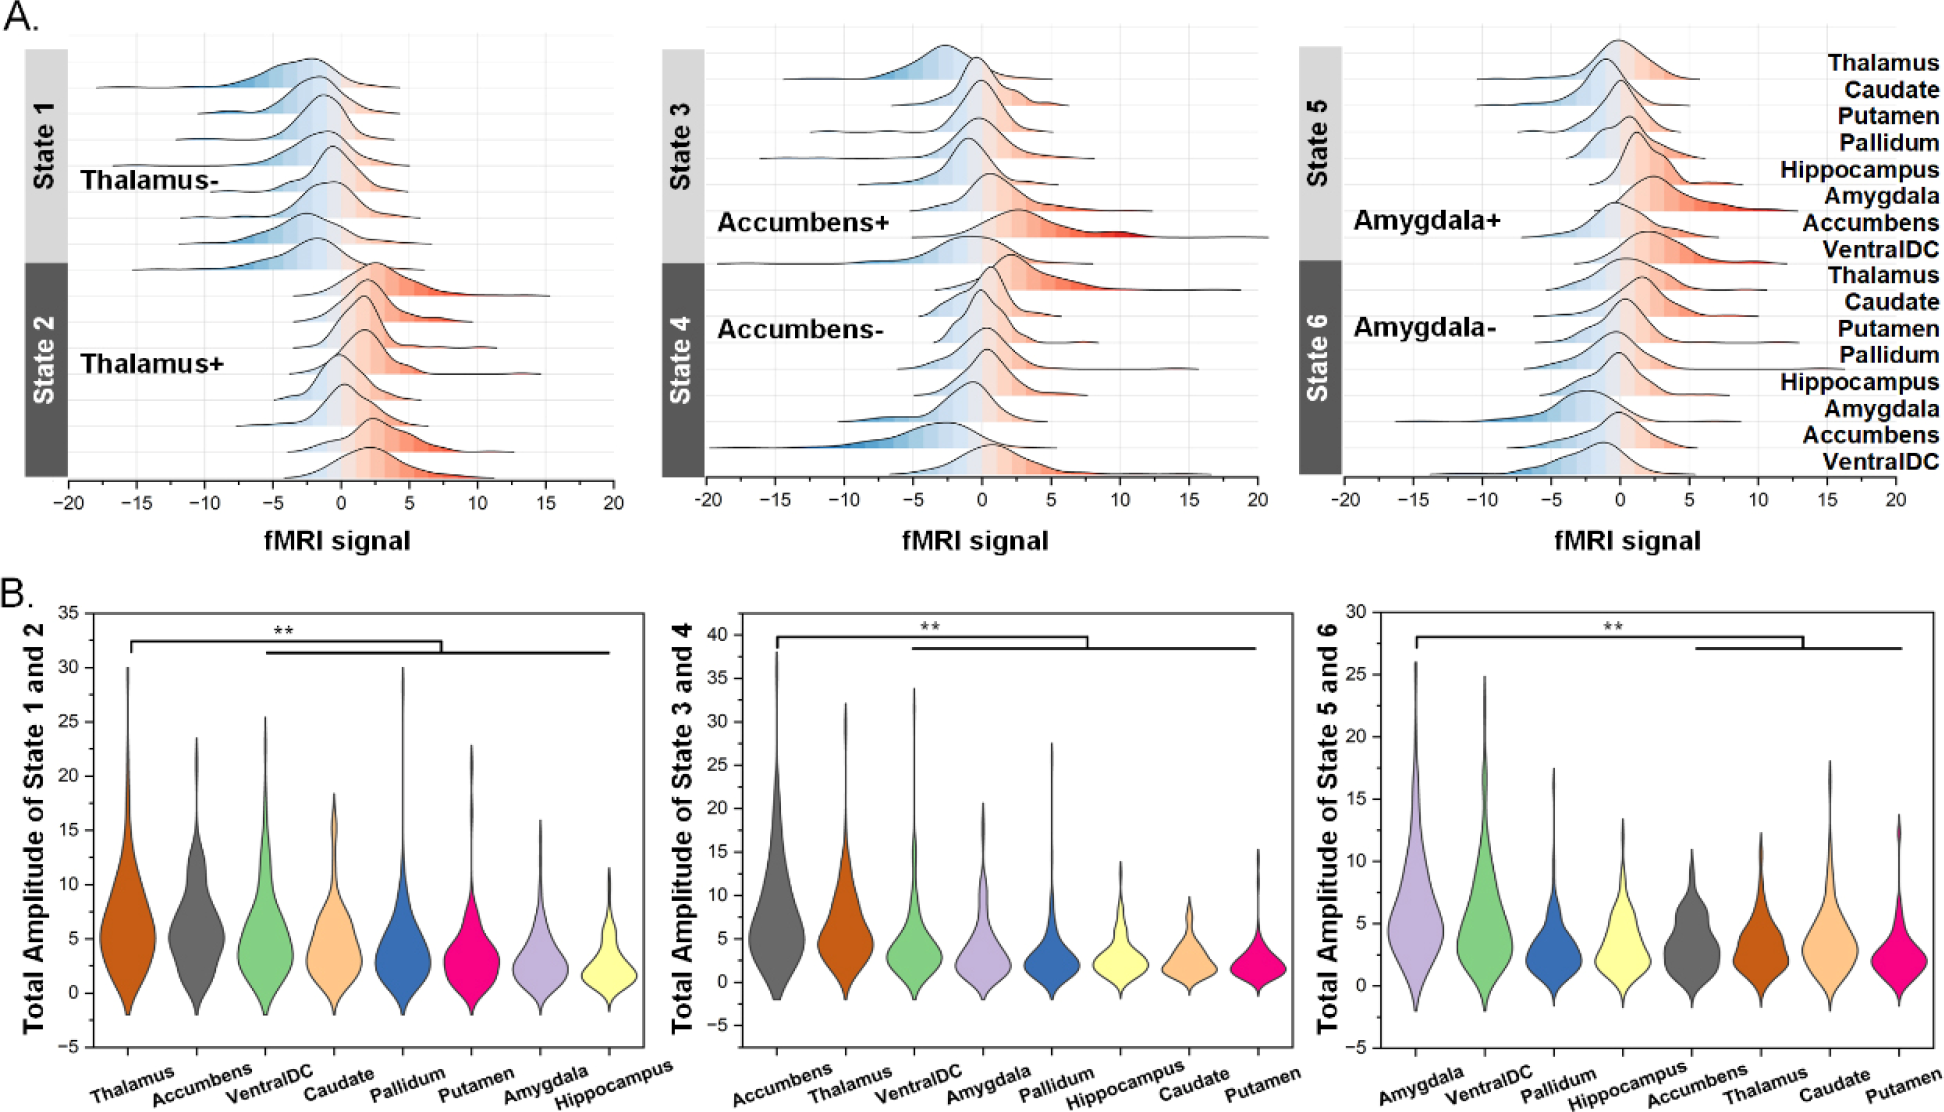
Spatial characteristics of paired CAPs. (A) Region signal distributions of six CAPs. (B) Amplitude differences among eight regions for each pair of CAPs. ** indicates Bonferroni corrected p < 0.01.
3.4 Spatial differences after treatment
The above clustering centers included a total of 55 regions (both cortical and subcortical) and were calculated based on the clustering labels of all participants. Nonparametric rank sum tests were used to compare differences in amplitudes of clustering centers between patients with PD and NCs and between before and after MIRT or tACS treatment. As depicted in Fig. 8, the amplitudes of state 1 (V+thalamus−) (NC: 0.39 ± 0.04; MIRT before: 0.82 ± 0.05; MIRT after: 0.93 ± 0.05; tACS before: 0.86 ± 0.05; tACS after: 0.79 ± 0.05) and state 4 (A+Accumbens−) (NC: 0.54 ± 0.04; MIRT before: 1.43 ± 0.05; MIRT after: 1.44 ± 0.04; tACS before: 1.17 ± 0.05; tACS after: 1.11 ± 0.04) were higher in the patients with PD compared with NCs (state 1: p = 0.0097; state 4: p < 0.001), whereas amplitudes of state 2 (V−thalamus+) (NC: −0.35 ± 0.04; MIRT before: −0.95 ± 0.05; MIRT after: −0.81 ± 0.05; tACS before: −1.17 ± 0.05; tACS after: −0.87 ± 0.05) and state 3 (A−Accumbens+) (NC: −0.76 ± 0.04; MIRT before: −1.18 ± 0.04; MIRT after: −1.30 ± 0.04; tACS before: −1.27 ± 0.04; tACS after: −1.21 ± 0.04) were lower in PD (state 2: p < 0.001, state 3: p < 0.001). In addition, the amplitude of state 2 (V−thalamus+) was increased after tACS treatment (p = 0.0095).
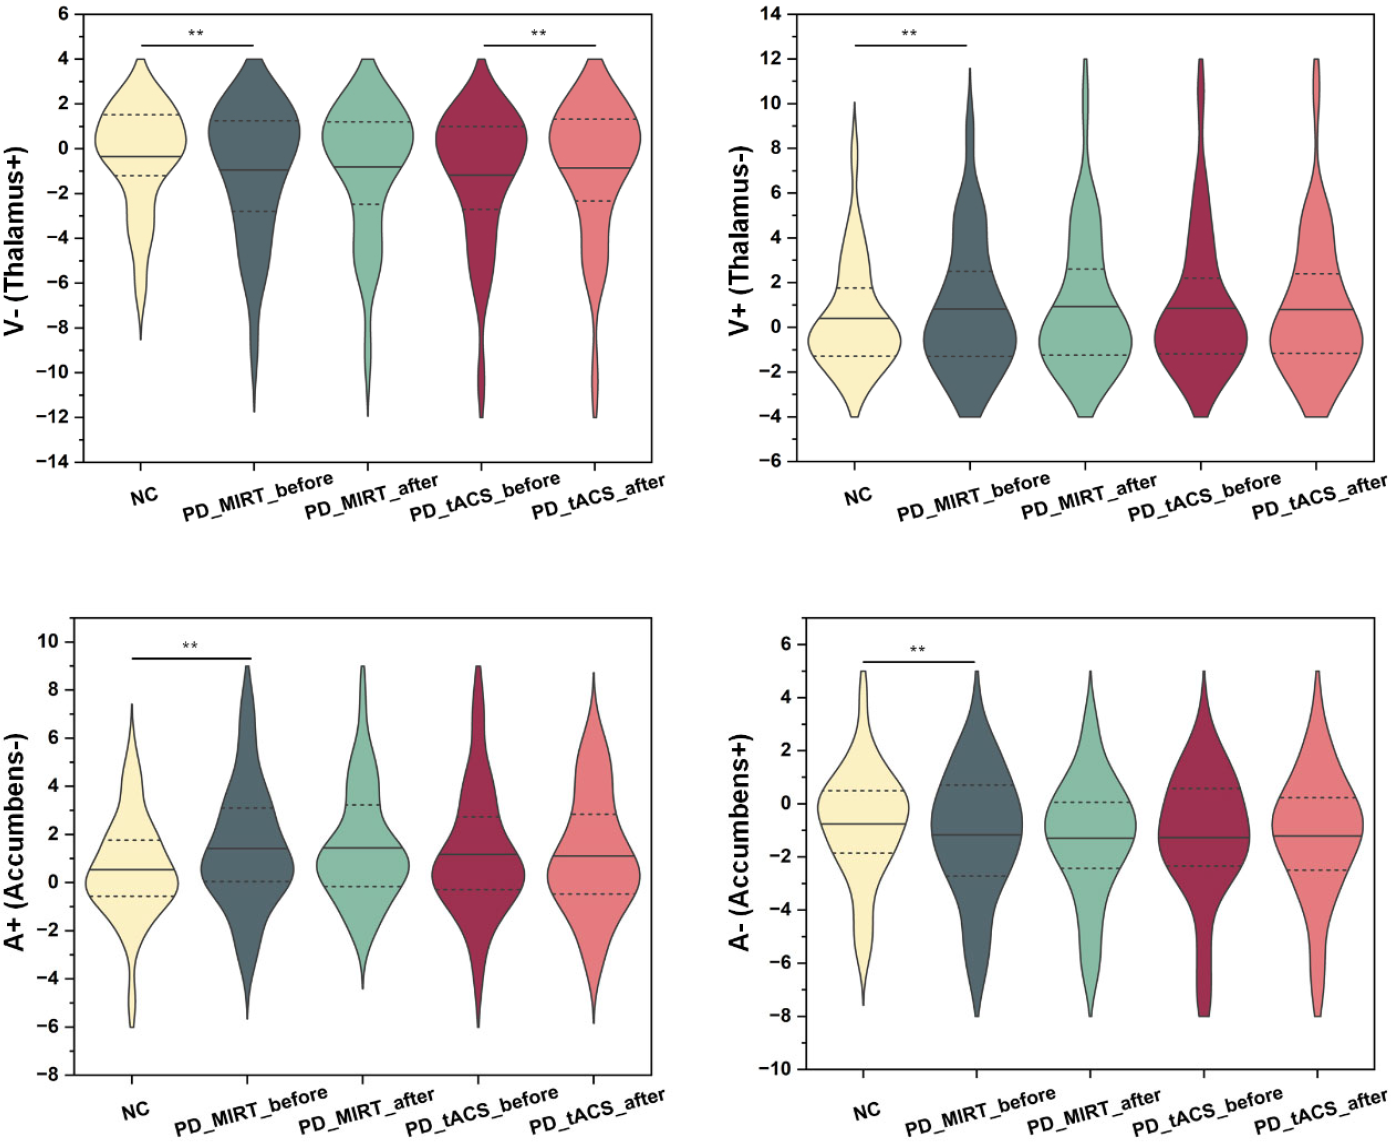
Spatial differences in paired cortico–subcortical CAPs after treatment. Sign test was conducted for NC and PD, before and after MIRT treatment of PD, and before and after tACS treatment of PD. ** indicates Bonferroni corrected p < 0.01. V+ and V− indicate activations and de-activations of the visual network, respectively. A+ and A− indicate activations and de-activations of attentional networks, respectively.
The amplitude of state 2 (V−thalamus+) showed significant changes after tACS treatment; thus, it was further analyzed to test whether changes in the amplitude of the cortical and subcortical regions correlated with changes in clinical scale scores. As depicted in Fig. 9, the decrease in LN amplitude was significantly and positively correlated with the decrease in UPDRS-I scores (r = 0.660, p = 0.023), the change in SN amplitude was significantly and positively correlated with the change in UPDRS-IV scores (r = 0.705, p = 0.010), the decrease in putamen amplitude was significantly and positively correlated with the decrease in TUG scores (r = 0.689, p = 0.015), and the decrease in amygdala amplitude was significantly and positively correlated with the decrease in TUG scores (r = 0.625, p = 0.047) after tACS treatment.
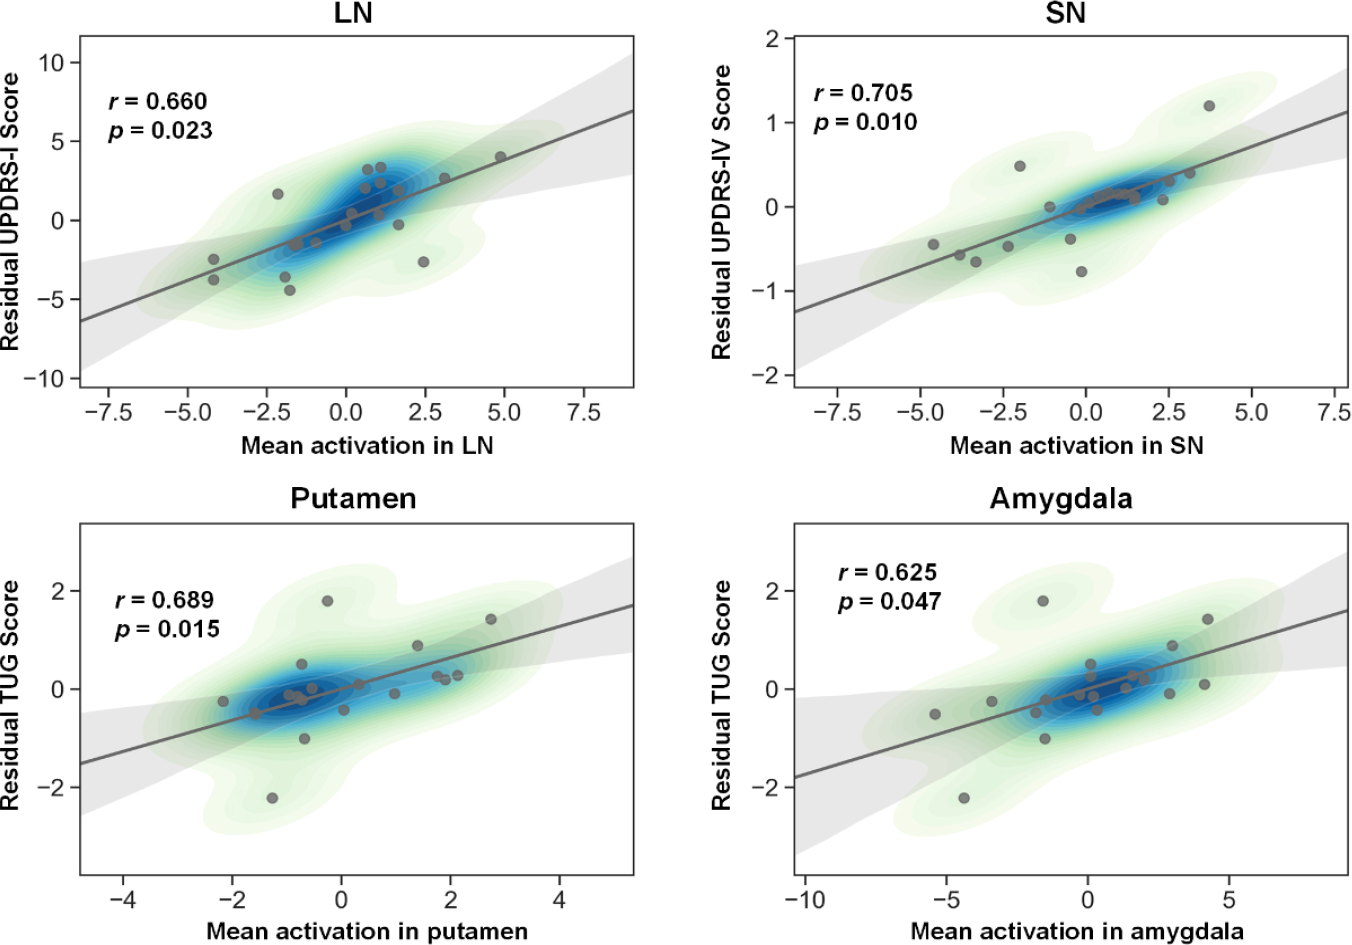
Correlations between clinical scores and local activations in state 2 (V−thalamus+). Spearman correlation efficient (r) and significance p values are shown. LN = limbic network, SN = salience network.
3.5 Temporal differences after treatment
In terms of temporal changes, the co-occurrence of cortical and subcortical states was analyzed to explore the effects on cortico–subcortical dynamic patterns of cortical treatment. First, because cortical and subcortical CAPs were constructed separately, the same time point was labeled with one of the six cortical states or one of the six subcortical states. In each state, co-occurrence was calculated as the proportion of cortico–subcortical at the same assigned time point and total time points. The sum of the six states was calculated as the overall co-occurrence of the cortical and subcortical states [Fig. 10(A)]. Nonparametric rank sum tests were conducted to compare differences in co-occurrence between the patients with PD and NCs, and differences between before and after MIRT or tACS treatment in PD. As depicted in Fig. 10(B), the cortico–subcortical co-occurrence was significantly higher in the patients with PD than in NCs and decreased in the patients with PD after tACS treatment. Furthermore, Spearman correlation analysis was performed to analyze the correlations between co-occurrence changes and clinical scale changes after tACS treatment. As depicted in Figs. 10(C) and (D), the co-occurrence change is significantly negatively correlated with HAMA scores (r = −0.421, p = 0.045) and positively correlated with UPDRS-IV scores (r = 0.546, p = 0.011).
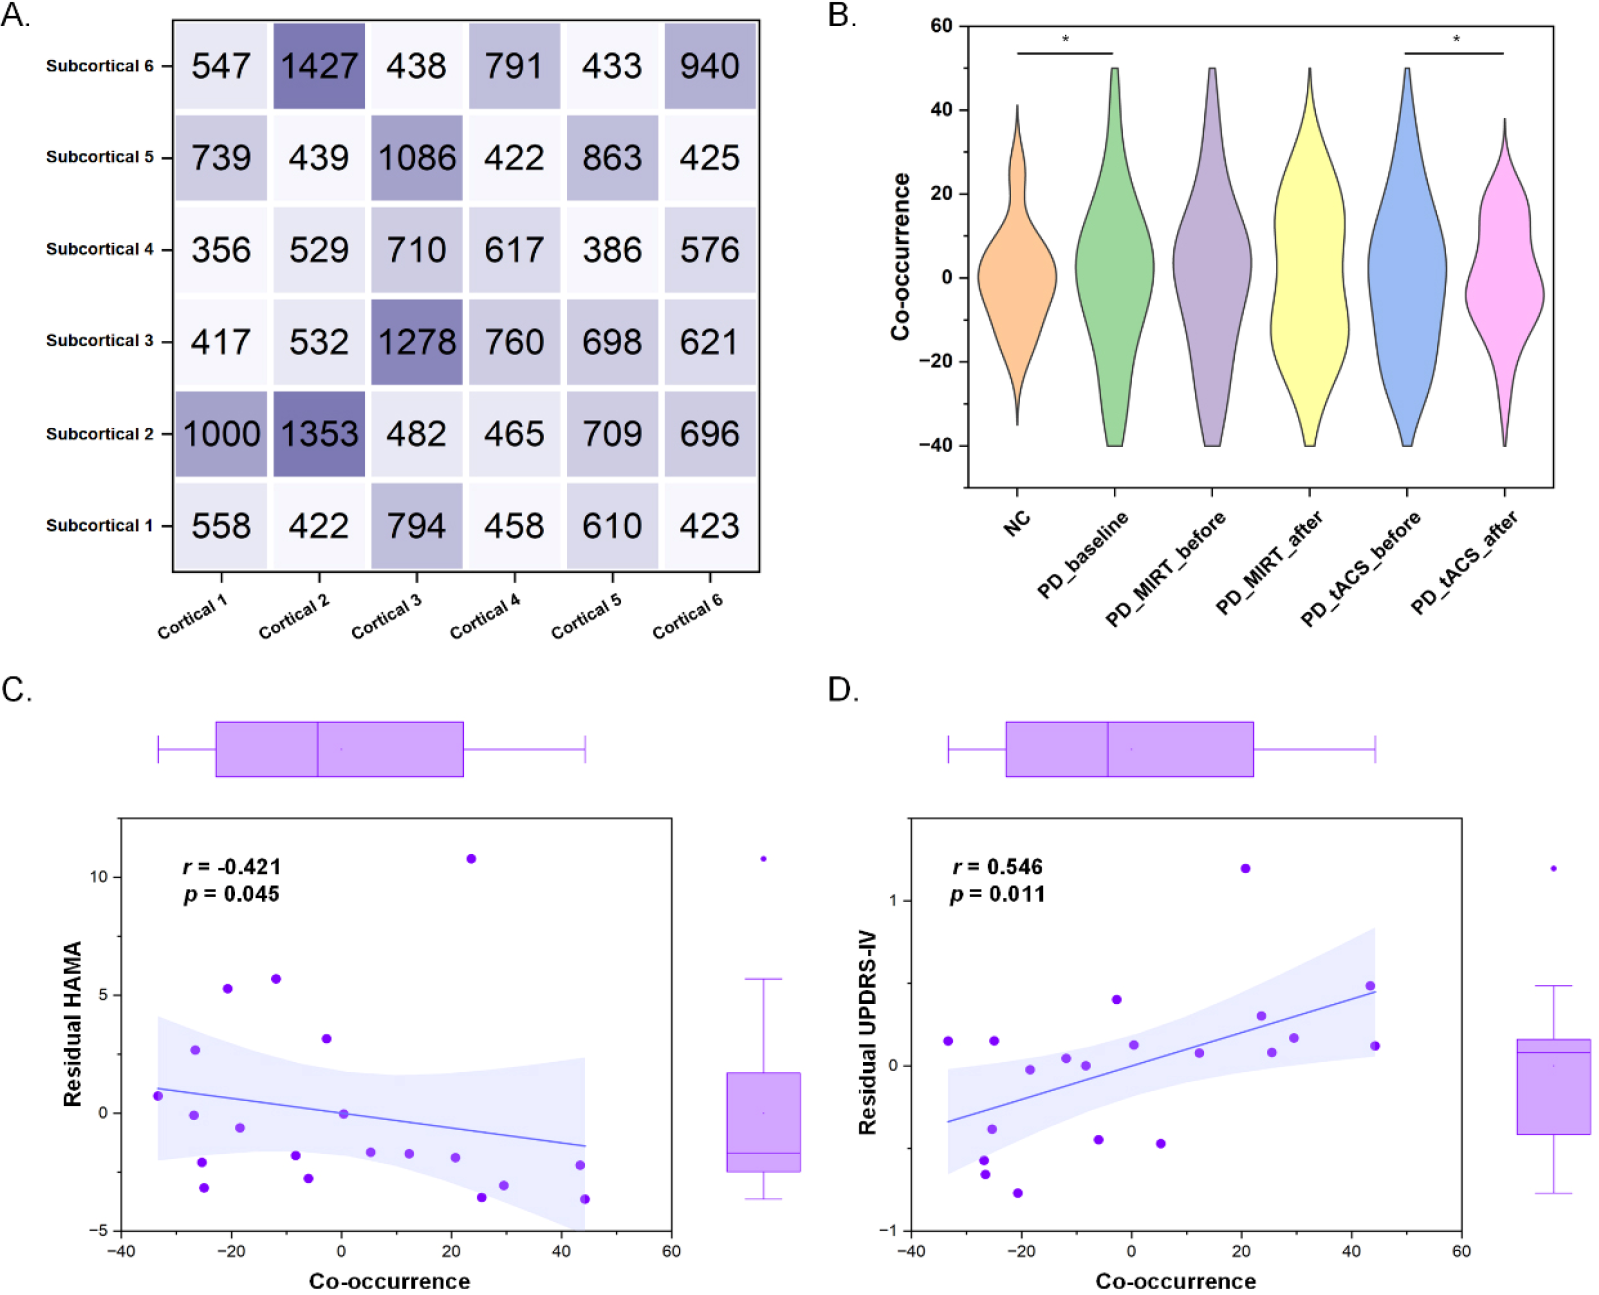
Temporal co-occurrence of cortical and subcortical states. (A) Paired time points of cortical and subcortical states. (B) Co-occurrence differences between patients with PD and NCs, before and after MIRT treatment in PD, before and after tACS treatment in PD. (C) Significant correlations between HAMA and co-occurrence. (D) Significant correlations between UPDRS-IV and co-occurrence. Spearman correlation efficient (r) and significance p values are shown.
4 Discussion
In this study, we investigated the treatment mechanisms of 4 Hz tACS in PD using cortico– subcortical CAP analysis on rs-fMRI data. The main findings of our study included: 1) Simulation results showed that the same electrode placement (FC1 and FC2) stimulated different proportions of functional brain networks across participants due to variability in their functional brain mapping. In addition, the FPN, LN, and MN exhibited dominant activations, and these activations were correlated with clinical improvements, indicating the potential application of simulated activations as a tACS treatment biomarker. 2) CAP analysis revealed three pairs of patterns, characterized by adversarial activations in the cortical and subcortical regions. In detail, the VN, AN, and DMN co-activated with the thalamus, accumbens, and amygdala, respectively. In addition, the pattern characterized by the de-activation of the VN and the activation of the thalamus (V−thalamus+) showed significantly lower amplitude in the patients with PD than in NCs, and this amplitude increased after tACS treatment. 3) The co-occurrence of cortico– subcortical CAPs was significantly higher in the patients with PD than in NCs and decreased after tACS treatment. These findings indicate the effectiveness of tACS on cortico–subcortical dynamics in patients with PD.
Electrode montage and stimulation frequency are two important parameters in tACS studies. Targeting prefrontal and motor areas (corresponding to FC1 and FC2 in 10–20 EEG system), tDCS improved the motor symptoms in PD [51, 52]. Although group-average targeting is widely used in electrical stimulation electrode montages [22, 53], individualized targeting is a goal for researchers [54]. To investigate the individualized effects of group-average target tACS in patients with PD, our study used electric field simulation and found that the same tACS electrode placement (FC1 and FC2) can stimulate different functional networks across individuals, indicating the necessity of individual targets in noninvasive neuromodulation. This finding is similar to a previous TMS study, which reveals variabilities in individual functional brain network engagement using the same TMS coil placement [34]. In addition, theta frequency was used in this study due to its involvement in high-order cognitive functions [55] and potential efficacy in PD [23]. Our findings further indicate the potential effect of theta frequency tACS on cortico–subcortical dynamics in PD.
The main findings in this study were co-activations between cortical networks and subcortical regions in patients with PD. Cortical regions engage in multiple anatomical and functional connectivity patterns with subcortical regions, forming cortico–subcortical circuits and supporting motor processing. In motor regulation, a typical pathway is a neuroanatomical link between limbic structures and the motor system via the accumbens [56], highlighting the key role of subcortical regions. In our study, the main cortico–subcortical CAPs involved three key subcortical regions: the thalamus, accumbens, and amygdala. These three subcortical regions are involved in a dynamic balancing task and have shown reduced connectivity to the midbrain in patients with PD [57]. Researchers have found that there is connectivity between the accumbens and amygdala in patients with PD but not in NCs [57]. This suggests that these three subcortical regions play an important role in different information circuits and work together to complete the same cognitive motor process. In addition, the three regions not only connect to the same brain structures but also connect with each other. For example, the amygdala connects to the accumbens, and this connectivity is involved in emotional and affective functions [58]. In patients with PD, the amygdala and accumbens have shown co-shrinkage [59, 60].
Through cortico–subcortical CAP analysis, we found that the thalamus co-activated with the VN, and the amplitude of this CAP was significantly different between patients with PD and NCs and before and after tACS treatment. The thalamus is a part of the forebrain and served as one of the critical hubs in complex cortico–subcortical circuits to support cognitive control processes [61]. To flexibly adjust to changing environmental demands, the thalamus structurally and functionally connects to multiple cortical networks, forming different thalamocortical activity patterns [62, 63], even before birth [64]. Moreover, the connectivity between the thalamus and cortical sensory regions decreases with age [65]. In addition, the thalamocortical activity has demonstrated high spatiotemporal dynamics to flexibly change brain states [66] and plays a critical role in the regulation of adaptive sensory functions [67]. In the relationship between the thalamus and VN, visual deprivation disrupts the thalamocortical network in the visual–spatial integration task [68]. Blindness disrupts and reorganizes the connectivity between the thalamus and VN [69]. A previous study has reported synchronized opposite activations between the thalamus and cortical regions in the behavioral state [70], and our resting-state study further indicates that the opposite activation is widespread in resting brain dynamics.
This study also reported that the accumbens co-activated with the AN, and the amplitude of this CAP was significantly different between patients with PD and NCs. The accumbens is a small but key brain region in the basal forebrain rostral area, localized in the ventral corpus striatum [71]. It is a part of the mesolimbic system and plays a crucial role in the regulation of reward processing [72, 73], motivation processing [74], and pain processing in patients with PD [75]. Dopamine D3 receptors are highly expressed in the accumbens, and their levels in the accumbens are reduced in patients with PD with impulsive compulsive behaviors [76]. Anatomical and functional disrupts of the accumbens are highly involved in patients with PD, especially the loss of volume [77–79]. The decrease in the accumbens volume is related to multiple nonmotor symptoms in patients with PD, such as cognitive impairment [80] and apathy [77]. The accumbens volume loss can also be used to predict post-operative cognitive decline after DBS [81]. In addition to the loss of volume, the accumbens has shown PD-related decrease in voxel-mirrored homotopic connectivity [82], intrinsic neural activity [83], and functional connectivity [84]. Reduced functional connectivity between the accumbens and the left inferior frontal has been found and is related to apathy in patients with PD [85]. Similarly, reduced functional connectivity between the accumbens and rostral anterior cingulate cortex has also been found and is related to impulsive compulsive behaviors in patients with PD [86]. These findings suggest that accumbens connectivity is widely used as a nonmotor symptom marker of PD.
Our study also revealed co-activations between the amygdala and DMN. Atrophies in the amygdala have been reported in patients with PD [87, 88], and this is associated with MoCA score changes [80] and depression in patients with PD [89]. In addition, a previous study has reported that connectivity between the amygdala and DMN is associated with anxiety and depression in patients with PD [90], highlighting its crucial role in emotional regulation. Overall, our study characterized co-activations between cortical networks and subcortical regions. These CAPs may be applied to future circuit-based neuromodulation. Finally, several limitations of this study should be emphasized. First, ultra-high field rs-fMRI is required for cortico–subcortical circuit studies because subcortical regions are difficult to image. Second, our study is performed in a single center, and the findings should be further verified in large and multicenter studies.
5 Conclusion
Cortico–subcortical circuit dysfunction in patients with PD has been implicated and used as a treatment target. This study investigated cortico– subcortical spatiotemporal dynamics in patients with PD and further revealed the mechanism of tACS treatment through individual functional brain network mapping and CAP analysis. The results show that the cortical and subcortical regions co-activate during the rest state and form different CAPs. In addition, the co-occurrence of cortical and subcortical CAPs can be improved after tACS treatment. These findings help understand cortico–subcortical dynamics and explore multiple targets within cortico–subcortical circuits in noninvasive neuromodulation on brain diseases, such as PD, Alzheimer’s disease, and depression.
Footnotes
Ethical approval
This work is approved by the Ethics Committee of Beijing Rehabilitation Hospital, Capital Medical University (No. 2019bkky-001; No. 2020bkky010).
Consent
Each participant voluntarily provided written informed consent after fully understanding this research.
Conflict of interests
All contributing authors report no conflict of interests in this work.
Funding
This work was supported by the National Natural Science Foundation of China (Grant Nos. U20A20191, 82071912, 12104049, 82202291); the Fundamental Research Funds for the Central Universities (Grant No. 2021CX11011); and the National Key Research and Development Program of China (Grant No. 2020YFC2007305).
Acknowledgements
All the authors thank the study participants for their contribution to the research.
Authors’ contribution
Tiantian Liu performed the data analysis and drafted the paper. Zilong Yan performed individual model simulation and revised the paper. Ziteng Han performed correlation analysis and revised the paper. Jian Zhang performed the statistical analysis and revised the paper. Boyan Fang collected the data and revised the paper. Tianyi Yan conceptualized the study and revised the paper. All the authors have approved the final version.
Data availability
The data that support the findings of this study are available from the corresponding author upon reasonable request.