
Abstract
Top-down attention mechanisms require the selection of specific objects or locations; however, the brain mechanism involved when attention is allocated across different modalities is not well understood. The aim of this study was to use functional magnetic resonance imaging to define the neural mechanisms underlying divided and selective spatial attention. A concurrent audiovisual stimulus was used, and subjects were prompted to focus on a visual, auditory and audiovisual stimulus in a Posner paradigm. Our behavioral results confirmed the better performance of selective attention compared to devided attention. We found differences in the activation level of the frontoparietal network, visual/auditory cortex, the putamen and the salience network under different attention conditions. We further used Granger causality (GC) to explore effective connectivity differences between tasks. Differences in GC connectivity between visual and auditory selective tasks reflected the visual dominance effect under spatial attention. In addition, our results supported the role of the putamen in redistributing attention and the functional separation of the salience network. In summary, we explored the audiovisual top-down allocation of attention and observed the differences in neural mechanisms under endogenous attention modes, which revealed the differences in cross-modal expression in visual and auditory attention under attentional modulation.
1 Introduction
Our senses continuously receive information about salient external stimuli, and the process of selecting relevant inputs while ignoring others is referred to as attention [1–3]. It is a high-level cognitive process designed to increase the efficiency of processing information by prioritizing certain inputs. Based on whether resources are allocated voluntarily or captured involuntarily, attention can be classified into top-down and bottom-up mechanisms [1, 4]. By focusing on certain spatiotemporal features, top-down mechanisms lead to increased neural responses, resulting in better cognitive-behavioral performance [5]. Evidence has confirmed that the dorsal frontoparietal network (dFPN) is responsible for spatial attention [6–8], and cortical areas in the left and right hemispheres control attentional distribution in contralateral regions [9]. Top-down attention can be investigated using visuospatial-oriented attention, as in the widely used experimental paradigm first developed by M. I. Posner [10]. The Posner paradigm modulates attentional deployment by establishing strong probabilistic associations between cue direction and target location to trigger the spatial reorienting of attention [11].
However, how the brain allocates resources among competing stimuli depends on specific context and behavioral goals. For example, selective amplification of features while suppressing irrelevant inputs to avoid distraction requires “selective attention”, while performing a dual-task paradigm or focusing on multiple channels at the same time requires “divided attention” and is highly dependent on the availability of resources [12]. In multitasking, brain regions dedicated to task coordination are employed, which challenges the ability of the brain to distribute cross-modal resources. Sustained bimodal divided/selective attention leads to cross-modal inhibition between sensory cortices, allowing the enhancement of activity in attended sensory cortices while decreasing activity in unattended sensory cortices [13]. Moreover, previous studies have found that the reorienting effect of spatial attention is greater in visual cue conditions than in auditory cue conditions [14], suggesting that there are attention shifting costs in cross-modal interactions [15]. A functional magnetic resonance imaging (fMRI) study of semantic coherence indicated that goal-directed divided attention and selective attention resulted in partially overlapping activation of the frontoparietal attention network [16]. The results of the study suggested that the prefrontal areas involved in the control of auditory and visual attention are segregated [17], while decreasing performance in the divided attention task is due to interference from multiple tasks as they utilize the same cortical part [16, 18]. Therefore, the competition of cognitive resources is thought to be responsible for the disturbances observed during cognitive tasks.
The integration of multisensory events is strongest when they are coherent in space and time, and sensory inputs can be differentiated from modalities in competition with one another through their salience and are modulated by top-down attention. We argue that the degree of competition among multiple stimuli is a major determinant of the necessity for top-down attentional regulation. Traditionally, activated brain regions help us discover task-relevant brain regions, but complex cognitive functions do not arise from independent brain regions; they generate underlying interactions [19]. Effective connectivity attempts to resolve latent neuronal activity by defining explicit statistical models of directed neuronal interactions. Previously proposed methods for effective connectivity require prespecifying interaction regions and making assumptions about how these regions affect each other [20]. Granger causality analysis is based on a data-driven approach, specifically combining past values of one time series with forecasts of current values of another time series [21], which prevents misspecification of hypothetical models and draws conclusions directly from the data. Therefore, we used Granger causality to study different neural patterns of spatial attention mechanisms from the perspective of causal information flow [22, 23]. Using the Posner paradigm, this study explored the neural mechanisms of audiovisual integration under bimodal spatial attention by designing divided and selective attention tasks. Additionally, selective attention of visual and auditory modalities aimed to explore cross-modal competition and coordination under spatial attention.
2 Methods
2.1 Participants
Twenty-two healthy, right-handed college students (average age is 24 ± 2 years old, including 11 males and 11 females) all had normal vision and audition and had no magnetic resonance imaging (MRI) contraindications. To make fMRI results statistically significant, we used NeuroPower Tools (www.neuropowertools.org) for statistical power analysis, and the results showed that the sample size of 22 subjects met the goal of statistical power of 80%. The study was approved by the Ethics Committee of the Peking University Health Science Centre in accordance with the Declaration of Helsinki (2008). Written informed consent was obtained from each participant.
2.2 Visual and auditory stimuli
Visual and auditory stimuli were generated on a computer and presented to the participants via a custom-built, magnet-compatible audio-visual system (at a sound level comfortable to each participant) during MR scanning. To attenuate the acoustic noise that accompanies fMRI scanning, noise reduction earmuffs were used. The auditory stimuli were presented to participants via an air-conductive tube. Presentation 22.0 (http://www.neurobs.com/) software was used to generate auditory and visual stimuli.
As shown in Fig. 1, visual spatial cues were used to direct the subjects’ attention to one of two possible target locations (left or right). The interval between the precue to the onset of the target event was 600 ms or 1800 ms. A spatiotemporally coincident audiovisual target stimulus (spatially coincident in 80% of trials and temporally coincident in all trials) without high-level informational content was presented on the left or right of the precue. The audiovisual stimulus consisted of a visual cross and auditory white noise. The auditory target stimulus included all frequencies from 20–20,000 Hz (white noise). An intensity difference between the left and right ear (interaural intensity difference, IID) was used to yield a lateralized auditory percept. The visual cue was a rhombus that was drawn in the center of the computer monitor on a dimmed background. The visual spatial cue was presented for 100 ms with the left or right half of the central rhombus lit up as an arrow that pointed to the cued side for the spatial attention task. The participants were instructed to judge the target location using either collocated visual and auditory targets (divided audiovisual attention task, Fig. 1(A)), a visual target (selective visual attention task, Fig. 1(B)), or an auditory target (selective auditory attention task, Fig. 1(C)). To instruct the participants to focus on specific target stimuli, the center of the computer screen displayed a “VA”, “Va” or “Av” during the audiovisual spatial attention (VAS) task, visual attention spatial task (VaS) and auditory spatial attention task (AvS), respectively. The control task (Fig. 1(D)) was used as a baseline for fMRI data analysis to exclude the activation of brain regions by cue and target detection. During the control task, the left or right half (with equal probability) of a circle inscribed into the central rhombus lit up on the computer screen. Participants were asked to respond by pressing the reaction key once. The cue validity was set at 80% during all three tasks. Participants were asked to report the position of the visual and auditory targets by pressing right or left reaction keys during the VAS task and the location of these targets during the VaS task and AvS task.
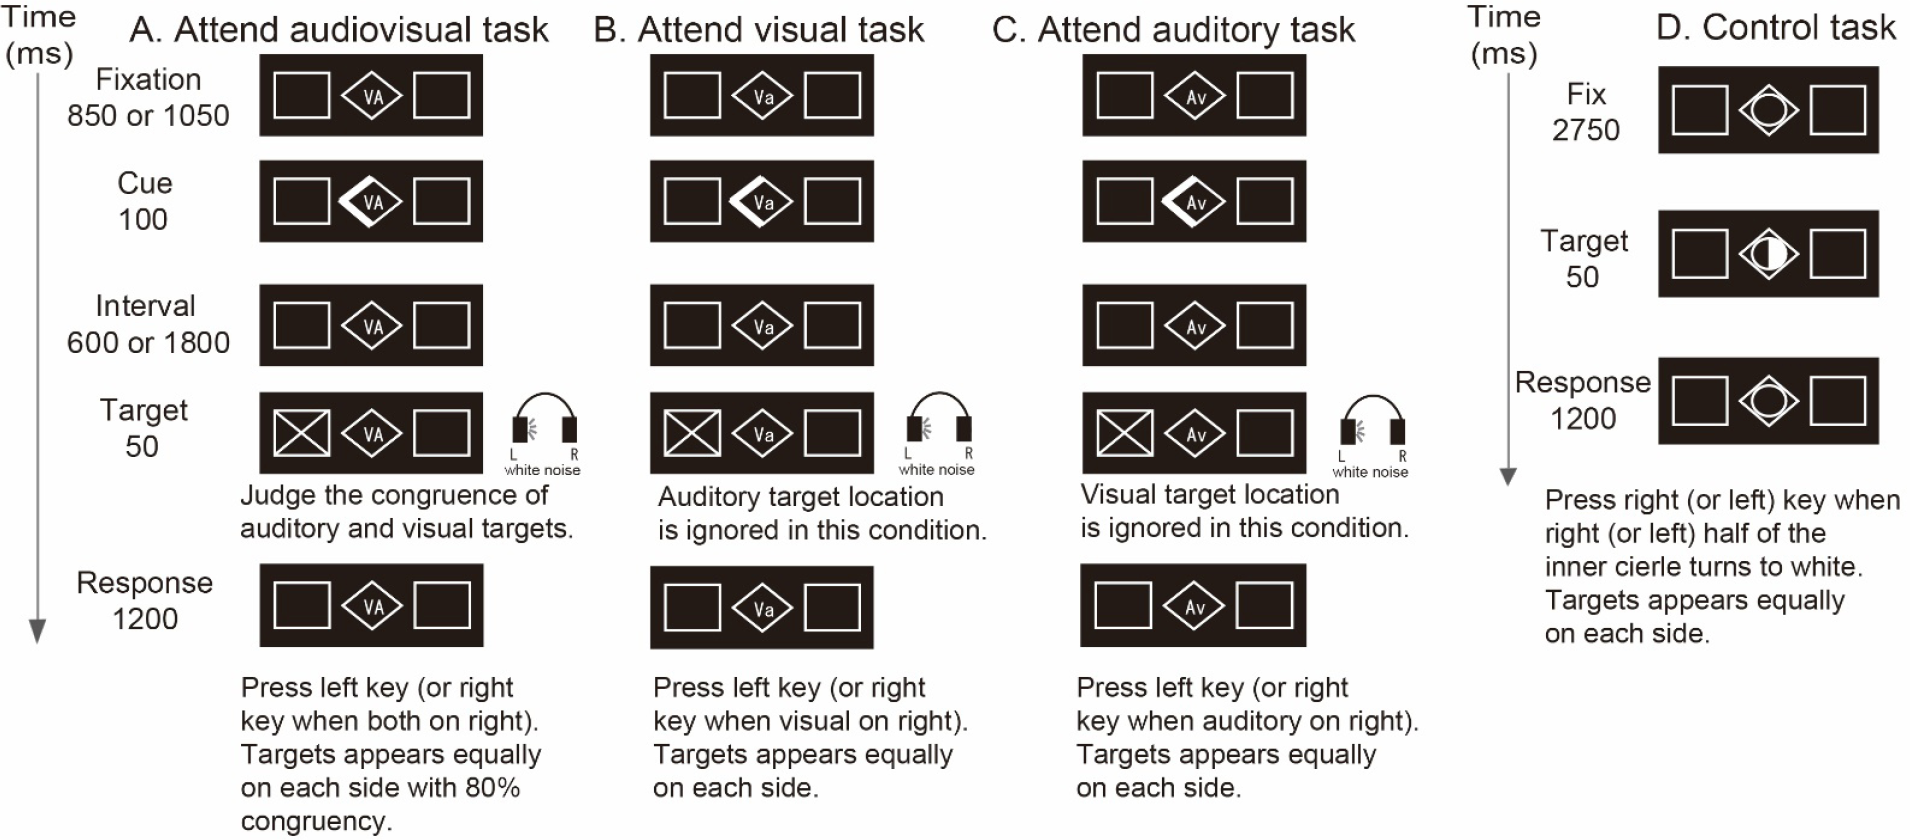
Examples of experimental and control stimuli and response paradigms. (A) The audiovisual attention task. “VA” in the center of the screen indicated that the participant should attend to both visual and auditory targets. The visual spatial cue conveyed spatial information about both the visual and auditory targets. The cue was lit for 100 ms. The after cue-target interval was 600 ms or 1800 ms. The audiovisual target was presented for 50 ms. (B) The visual attention task. (C) The auditory attention task. (D) The control task.
For each trial, we recorded the reaction time (RT) as the time elapsed from the onset of the target event to the press of the reaction key by the participant. Only RTs of valid trials were included in the analysis. For the spatial attention tasks, when the visual and auditory stimuli were on the same side, a valid response was pressing the button in the corresponding direction. Specifically, participants were told to respond to a target stimulus on the right by pressing the right key using the middle finger of their right hand and a target stimulus on the left by pressing the left key with the index finger of their right hand. The error rate was also recorded. The participants performed 30 trials under each of these 3 experimental conditions and 30 trials of the control task. A block design was used. The experimental details were explained to each subject before the start of the MR scanning. The experimental sessions lasted for a total of 6 min. We used statistical analysis to observe the differences in behavioral performance between tasks.
The brain activation images were acquired using a 3-T Siemens scanner vision whole-body MRI system with a head coil. The imaging area consisted of 32 functional gradient-echo planar imaging (EPI) axial slices (voxel size 3 × 3 × 4 mm3, TR = 4000 ms, TE = 50 ms, FA = 90°, 128 × 128 matrix) that were used to obtain T2*-weighted fMRI images in the axial plane. For each task, we obtained 64 functional volumes. For the functional image analysis, we first used MRIcro (http://www.cabiatl.com/mricro/) to convert the DICOM files to NIFTI files. In each task, the first 4 functional images were discarded. Data preprocessing and statistical analyses [24] were performed with the Statistical Parametric Mapping computer package (SPM12; Welcome Department of Cognitive Neurology, London, UK: http://www.fil.ion.ucl.ac.uk/spm/software/spm12) implemented in MATLAB 2013b (MathWorks). All volumes were spatially realigned to the first volume of the first time series. The movement parameters generated during spatial realignment indicated that all 22 participants moved less than 2 mm. The realigned images were normalized spatially using the Montreal Neurological Institute (MNI) reference brain [25] and resampled into 2 × 2 × 2 mm3 voxels [26]. Normalized images were smoothed with an isotropic 8 mm full-width half maximum (FWHM) Gaussian kernel.
The statistical analysis was performed in a two-stage, mixed-effects model. In the first-level analysis, the blood oxygen level-dependent (BOLD) response was modeled as the neural activity convolved with a canonical hemodynamic response function (HRF) to yield the response variable of a general linear model (GLM) for each condition [27]. The time series in each voxel was high-pass filtered to remove low-frequency noise and scaled within a session to a grand mean of 128 s. The nonsphericity of the error covariance was accommodated by a first-order autoregressive (AR1) model in which the temporal autocorrelation was estimated by pooling the suprathreshold voxels [28].
Second-level group statistics were based on the “con” or contrast images corresponding to the audiovisual attention task versus the control task, the visual attention task versus the control task, and the auditory attention task versus the control task from the first-level analysis for all 22 subjects. To identify the whole brain activation for the main effect for all three spatial attentional tasks, “con” files were used for a one-way analysis of variance (ANOVA). Whole-brain corrections of familywise errors (FWE) were corrected at the cluster level at a threshold of P < 0.05 and at the voxel level at a threshold of P < 0.001. The differences in the activation of brain regions between divided and selective attention tasks were also estimated using the ANOVA design matrix. Flat images of the visual cortex were created using Caret Software over a flattened brain derived from the Population-Average, Landmark- and Surface-based (PALS) atlas [29]. Caret [30] was used to perform surface reconstruction and surface cortical visualization, and we obtained visual cortical subdivisions and mapped our functional data on PALS atlas surfaces.
To further evaluate the differences in the regional signal changes between the three conditions, several areas were defined to obtain a region-of-interest (ROI)-averaged contrast value from the first-level individual subject statistical analysis. Fifteen anatomical ROIs were defined using the automated anatomic labeling (AAL) toolbox (http://www.fmri.wfubmc.edu/cms/software#Pick-Atlas) and one subcortical cortex and 3 visual areas were defined using phase-encoding retinotopic areas V1v (ventral V1), VP (ventral posterior) and V4v (ventral V4). These ROIs were divided into four categories: regions associated with spatial attention, visual/auditory cortex, subcortical regions and specific regions in the VAS task. For each ROI, there were a total of 66 measurements across 3 conditions and 22 participants. The data were then used in a repeated measures analysis of variance (ANOVA; SPSS 16.0 for Windows) with an equal variance assumption. Tukey’s test using a significance threshold of P < 0.05 was used for post hoc multiple comparisons.
To explore the differences in dynamic brain networks between the selective attention task and divided attention task, Granger causality analysis was used after fMRI image preprocessing. Time series were extracted, and the global signal from the unsmoothed fMRI image was removed, which made the remaining BOLD time series more stable. Then, the time series were preprocessed through removal of outliers, subtraction and division of the baseline mean, and removal of the average task response time mean [31]. We used the NICE toolbox (https://guorongwu.weebly.com/software.html) to calculate the multivariate GC value [32] between ROIs and set the model lag length to 1. Differences between tasks were tested using paired t tests to find the significant GC.
3 Results
3.1 Behavioral performance
RTs from each participant were used as behavioral data. RTs from invalid trials and missed trials and those faster than 100 ms or slower than 1000 ms were excluded from the analysis. The RT data obtained during the fMRI experiment were analyzed using repeated-measures one-way ANOVA with 3 levels and an equal-variance assumption.
The mean response accuracy was 98.39% ± 1.30% for all subjects. The behavioral results are shown in Fig. 2. The mean RTs were 508.1 ms (SE: 56.7) during the VAS task, 422.8 ms (SE: 52.2) during the VaS task and 483.0 ms (SE: 55.0) during the AvS task. Tukey’s test for multiple comparisons showed that the RT in the divided audiovisual attention task was significantly longer than that in the selective visual (P < 0.001) and selective auditory attention tasks (P < 0.004), and the RT in the selective visual attention task was significantly shorter than that in the selective auditory attention task (P < 0.001) (Fig. 2(A)). As shown in Fig. 2(B), the cumulative probability of RTs in each time bucket (defined as 10 ms) from 200 ms to 1000 ms was smaller in divided VAS than in selective VaS/AvS. The highest differences in RT probability were between 400 ms and 600 ms (Fig. 2(C)). The behavioral results revealed differences in cognitive behavioral performance between divided and selective attention. To further explore the neural mechanism, we examined the task activation of the whole brain.
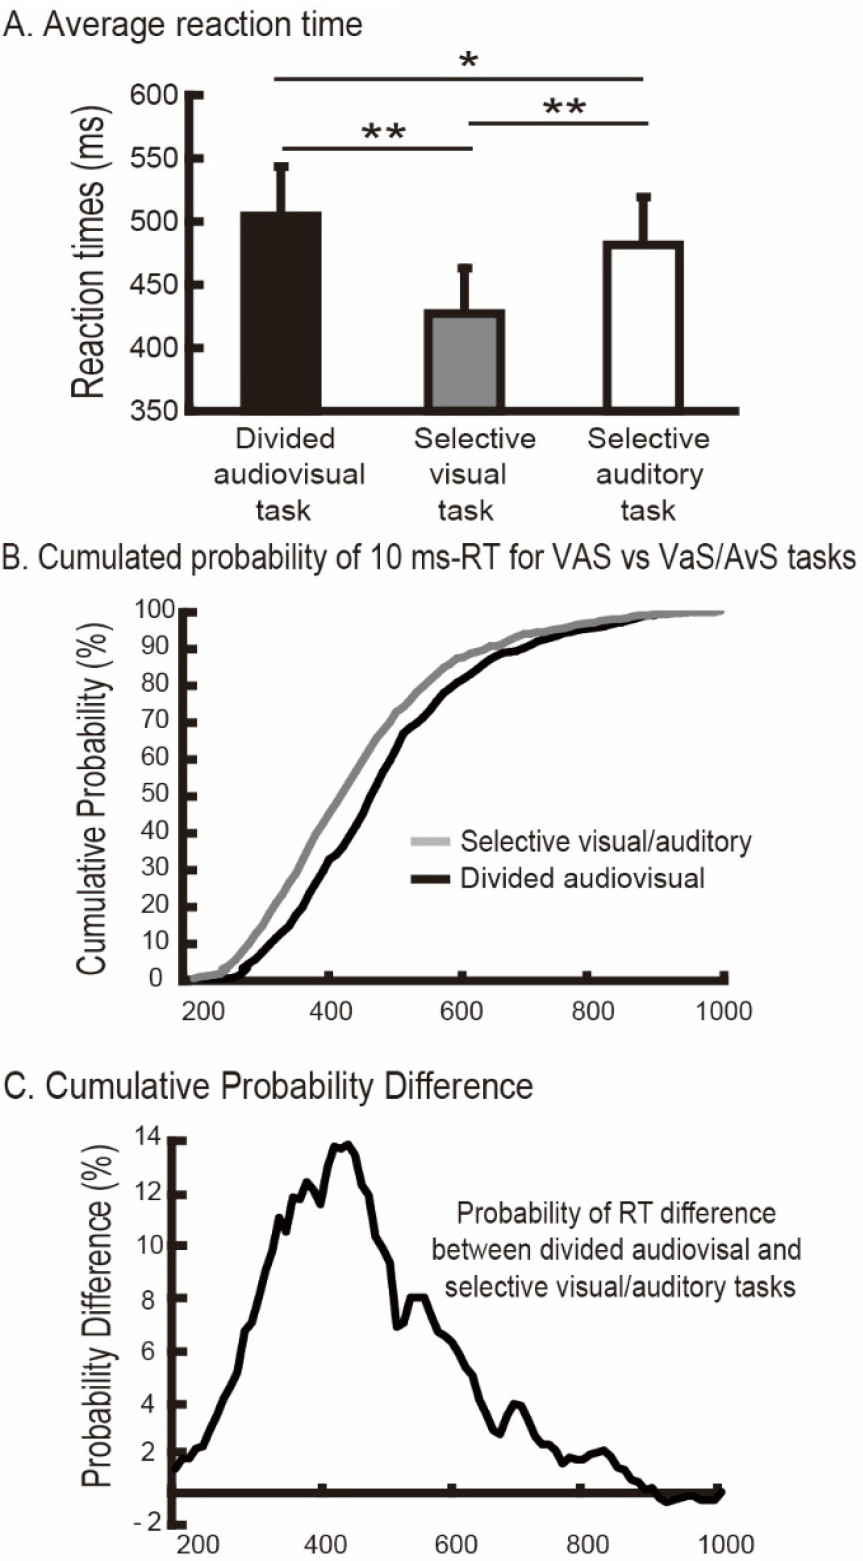
Average reaction times and their differences between attention tasks. (A) Averaged reaction times. The P values indicate the significance of the difference between tasks under the bars determined repeated-measures ANOVA (* P < 0.05, ** P < 0.01). (B) Cumulated probability of 10 ms-RT for VAS vs. VaS/AvS tasks. (C) Probability of a 10 ms-RT difference between divided audiovisual and selective visual/auditory tasks.
3.2 Imaging
Activated brain regions during the three attention tasks were estimated based on random effects group analysis at the whole-brain level by using an F test from a one-way ANOVA. The main effect analyses showed that there were three categories of involved regions: (1) Top-down spatial attention-related dorsal FPN regions (Fig. 3), including the superior parietal lobule (SPL), inferior parietal lobule (IPL), middle frontal gyrus (MFG), and dorsolateral prefrontal cortex (DLPFC); (2) Audiovisual integration-related basic visual cortex, auditory cortex, and superior temporal sulcus/gyrus (STS/STG) (Fig. 4); and (3) One subcortical area, the putamen, was also differentially activated during the three tasks (Fig. 5). The activated brain regions (Figs. 3 –5) are summarized in Table 1. ROI-based repeated measures analyses showed that the BOLD signal change between the tasks was significantly greater in IPL, MFG, SPL, STG, AC, STS, V1, VP and V4v (Figs. 3 –5).
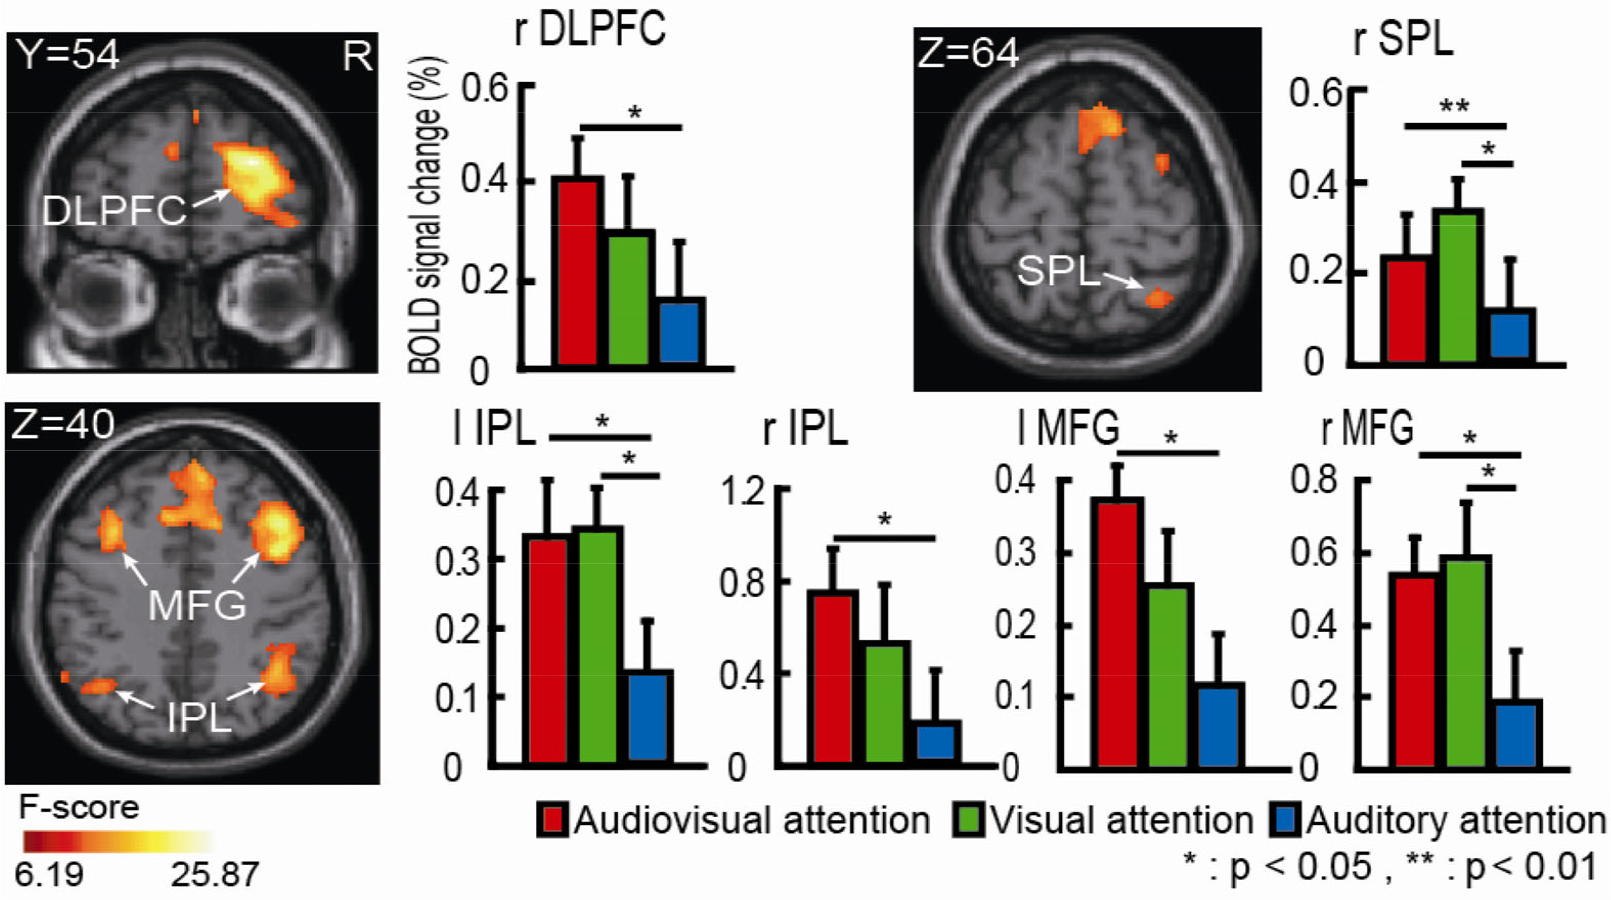
Activated brain regions in both hemispheres due to the main effect of spatial attention in the dorsal attentional network revealed by one-way ANOVA. SPL, superior parietal lobe; IPL, inferior parietal lobe; DLPFC, dorsolateral prefrontal gyrus; MFG, middle frontal gyrus; r, right hemisphere; l, left hemisphere. Colored brain regions with significant BOLD signal changes are consistent with the regions from the sliced results. The pairwise comparisons using Tukey’s adjustment are shown in the histogram (* P < 0.05, ** P < 0.01). The error bars represent the standard error (SE).
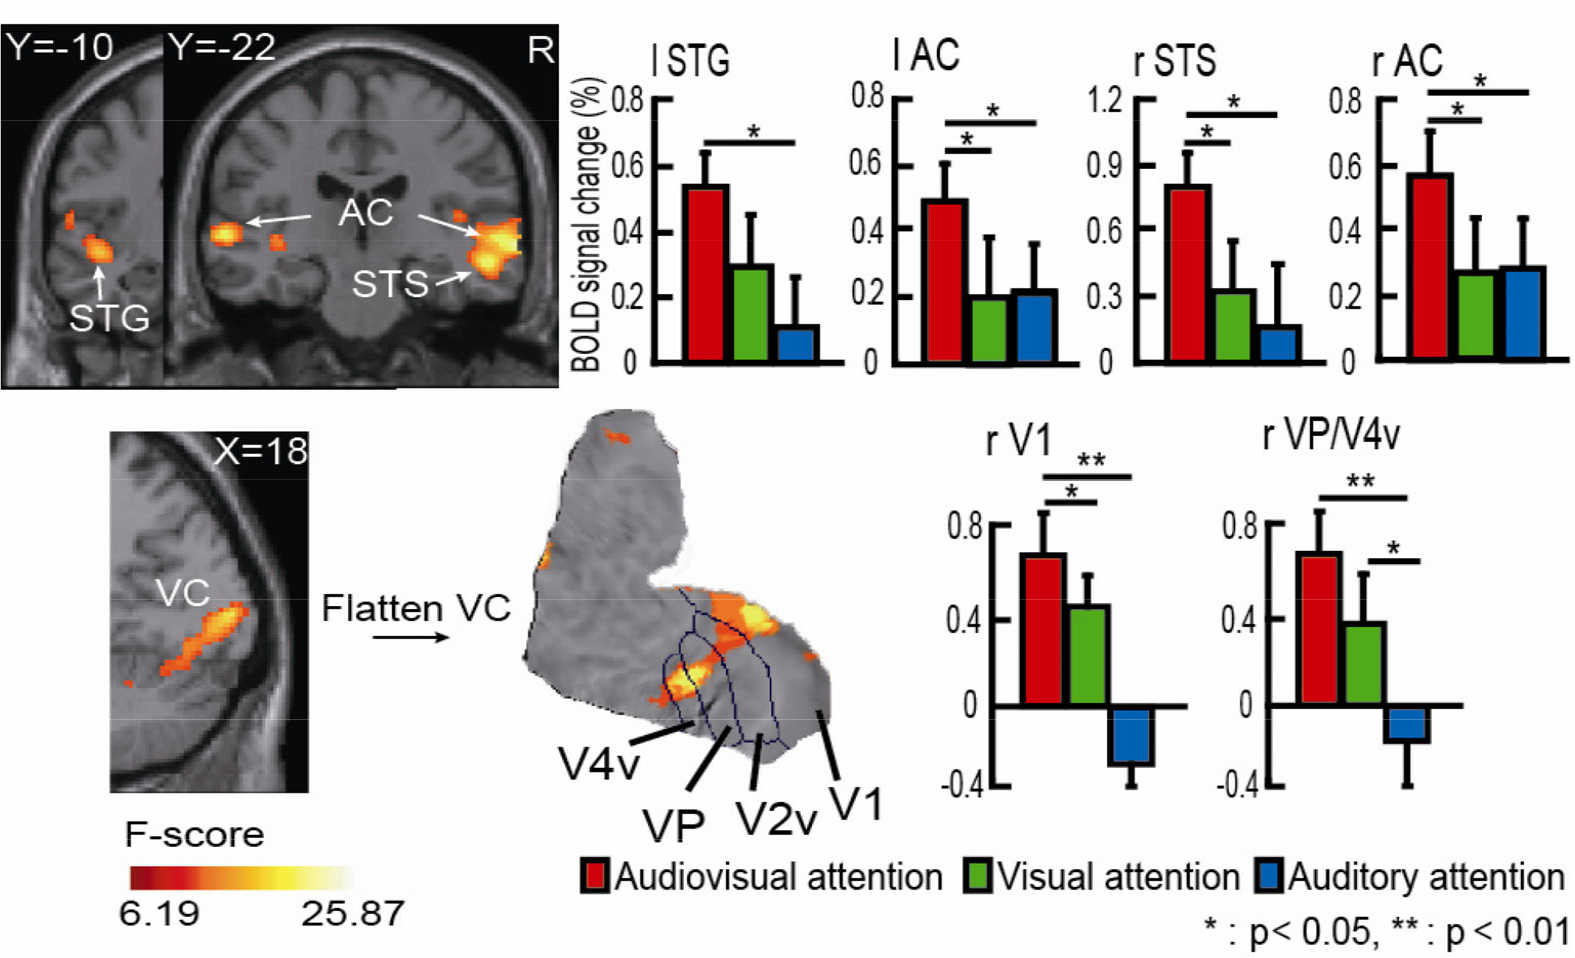
Activated brain regions due to the effect of spatial attention within the VC/AC and STS/STG revealed by one-way ANOVA. AC, Auditory cortex; VC, visual cortex; STS, superior temporal sulcus; STG, superior temporal gyrus. Flattened activation patterns were found within ventral V1 (V1v), ventral posterior (VP), and ventral V4v (V4v). Colored brain regions with significant BOLD signal changes are consistent with the regions from the sliced results. The pairwise comparisons using Tukey’s adjustment are shown in the histogram (* P < 0.05, ** P < 0.01). The error bars represent the standard error (SE).
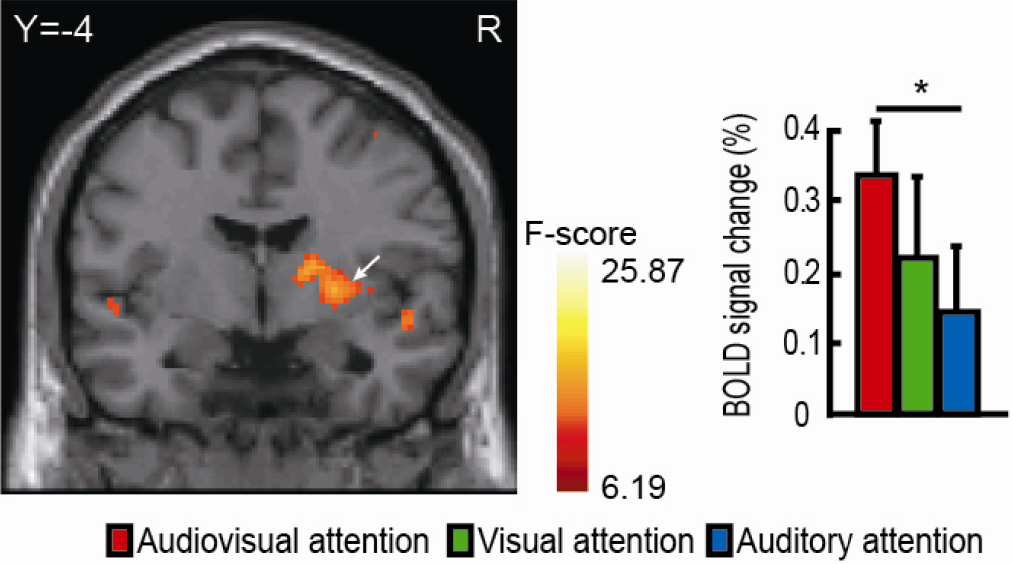
Differentially activated regions within the right putamen during attentional tasks. Colored brain regions with significant BOLD signal changes within the putamen those are consistent with the regions from the sliced results. The pairwise comparisons using Tukey’s adjustment are shown in the histogram (* P < 0.05, ** P < 0.01). The error bars represent the standard error (SE).
Activation areas revealed using the F contrast of three attentional tasks.
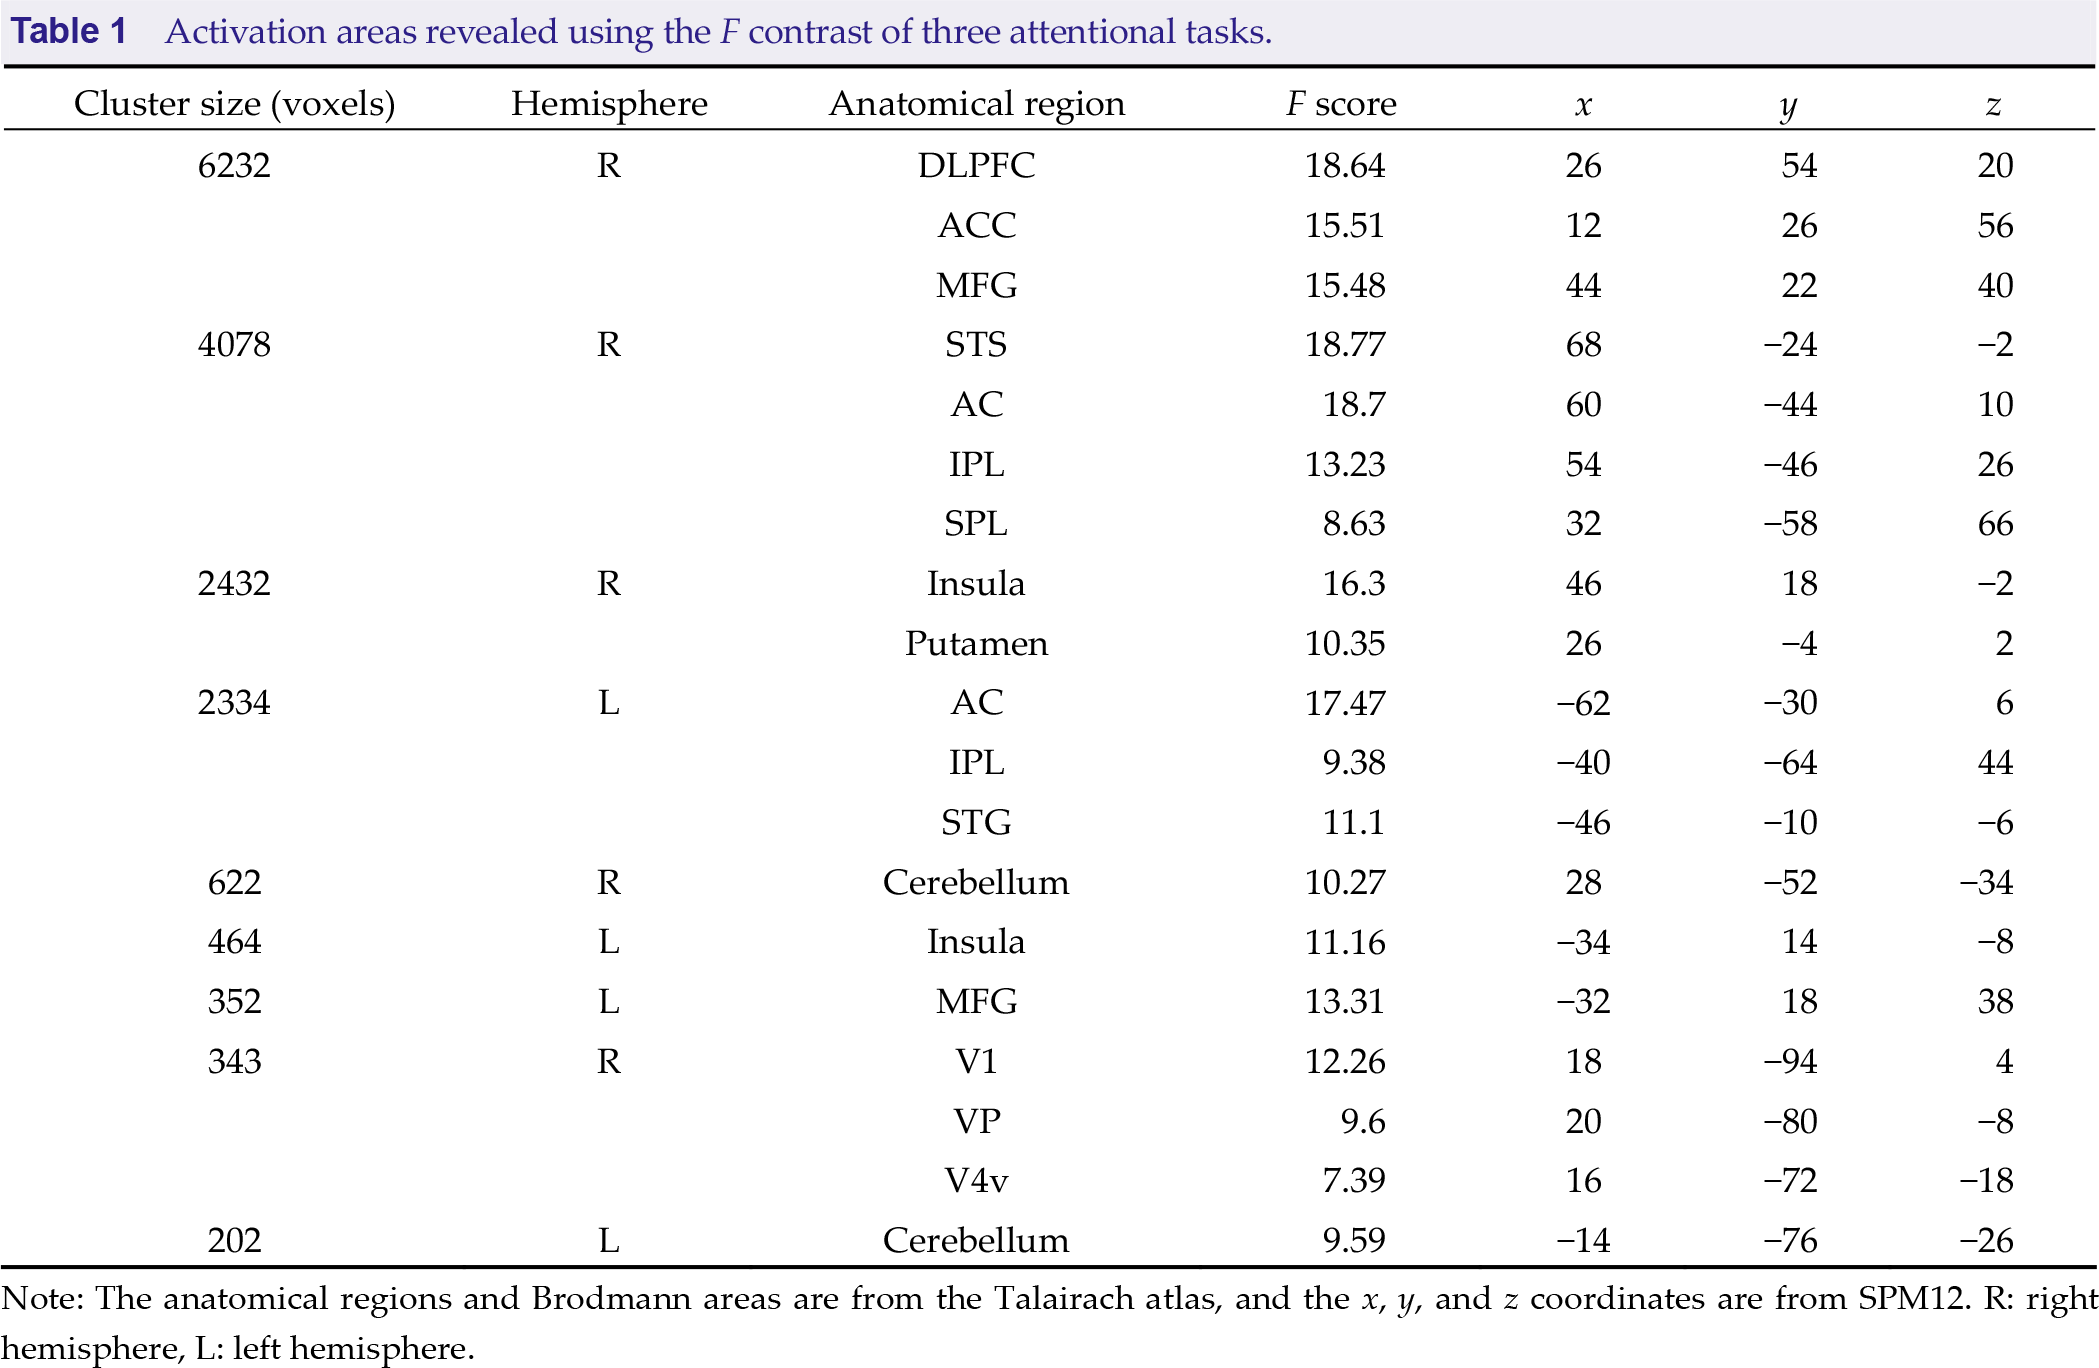
Note: The anatomical regions and Brodmann areas are from the Talairach atlas, and the x, y, and z coordinates are from SPM12. R: right hemisphere, L: left hemisphere.
We then analyzed the activated areas in the VC, and the data showed that there was multisensory-related activation in specific regions (Fig. 4), which could be subdivided into V1, VP and V4v on a flat visual cortex template (Fig. 4).
3.3 Neural correlates of divided attention-modulated audiovisual integration
To identify the specific brain regions involved in the divided VAS task, we compared the results obtained in this task with the activation during the selective VaS/AvS attention tasks. The contrast (VAS–VaS) ∩ (VAS–AvS) masked with VAS confirmed that there were stronger activations within the right anterior cingulate cortex (ACC) and right INS (Fig. 6; Table 2). The ROI-based repeated measures showed significantly different BOLD signal changes with Tukey correction (asterisks in Fig. 6) between the VAS task and AvS task within both the right ACC (P < 0.05) and right INS (P < 0.01) as well as between the VAS task and VaS task within the right ACC (P < 0.01).
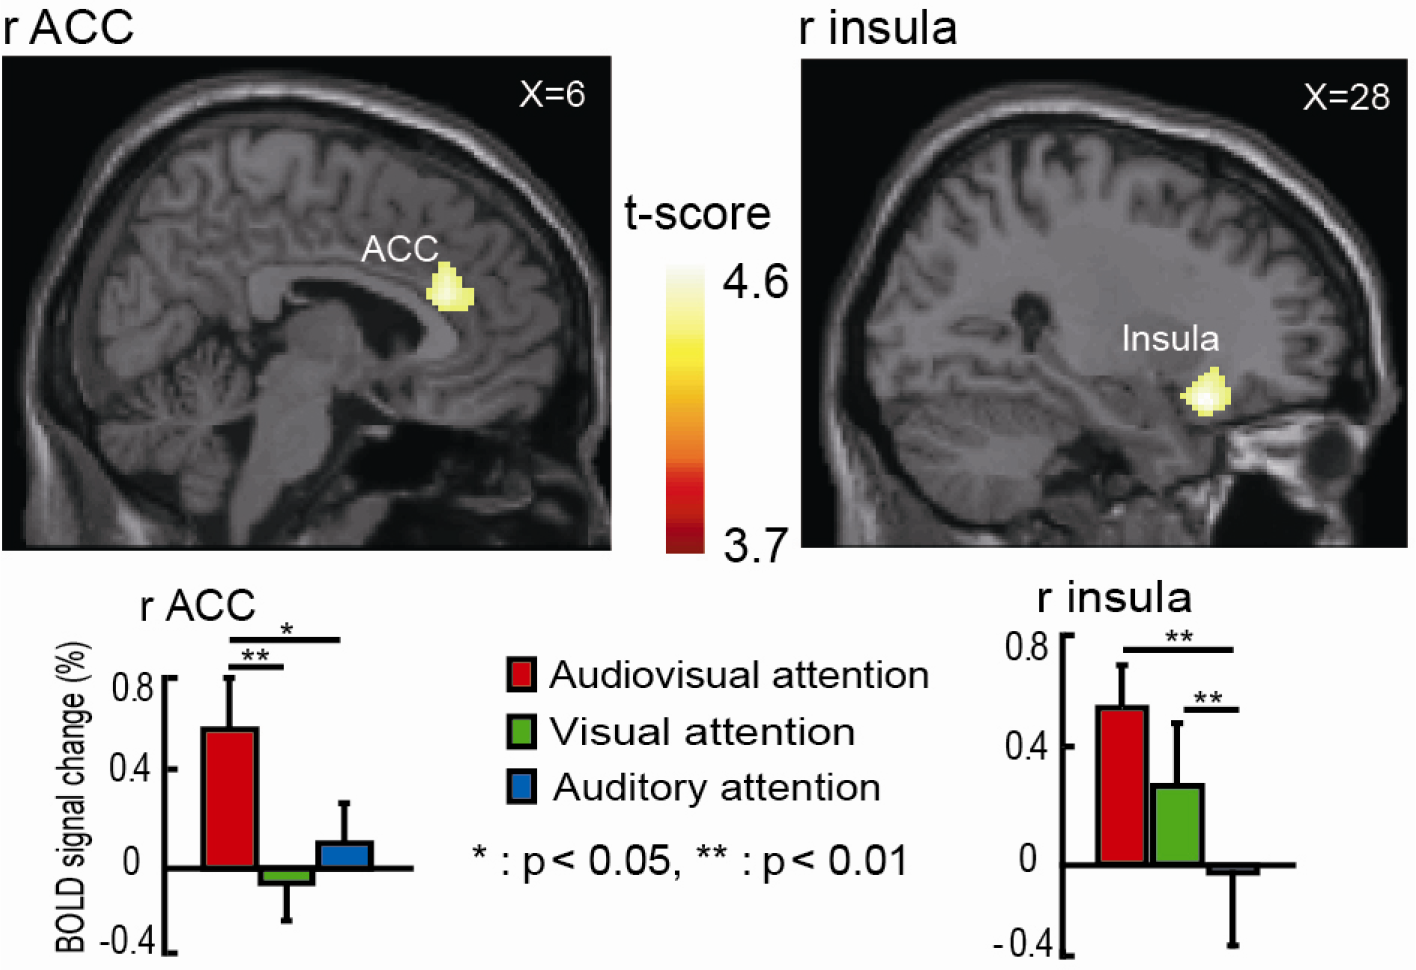
Significant activation was observed during the VAS task in the right ACC and right INS. The pairwise comparisons of BOLD signal changes for different tasks with a Tukey adjustment are shown in the histogram (* P < 0.05, ** P < 0.01). The error bars represent the standard error (SE).
Activation areas revealed using the contrast of (AVS–VaS) ∩ (VAS–AvS).
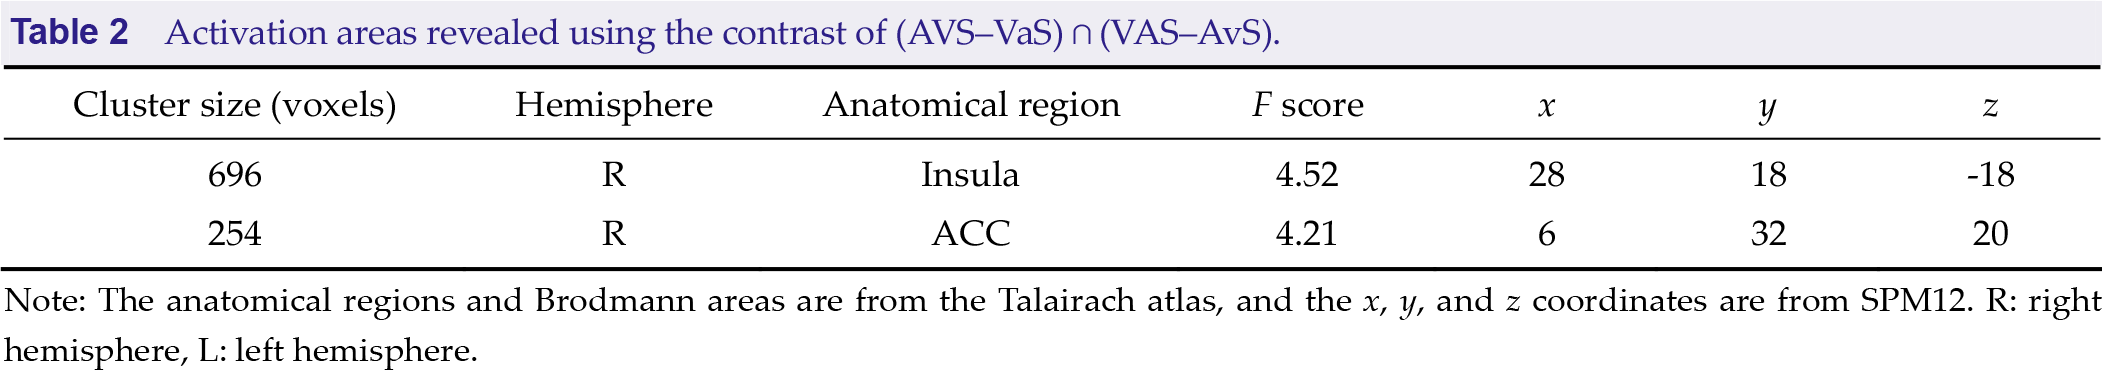
Note: The anatomical regions and Brodmann areas are from the Talairach atlas, and the x, y, and z coordinates are from SPM12. R: right hemisphere, L: left hemisphere.
3.4 Granger causality
Granger causality analysis was used in three spatial attention tasks, and average GC values in each task and effective connections between tasks are shown in Figs. 7 and 8, and Table 3. We compared three pairs of conditions (VAS vs. VaS, VAS vs. AvS and VaS vs. AvS) to determine significantly different GC effective connections using a paired t test (P < 0.05). Effective connection directions are indicated by arrows, while differences in mean GC values between tasks are shown in red and blue. The average GC value of the selective attention tasks was smaller than that of the divided attention task (red arrows), suggesting that divided attention elicits stronger neural activity. Interestingly, GC connections that were directed to the putamen during selective attention tasks were stronger, indicating a potential mechanism for resource redistribution to avoid distraction. Visual and auditory differences in selective attention tasks are also shown in Fig. 8. The intensity of neural activity elicited by visual selective attention was similar to that elicited by auditory selective attention. In contrast, strong connections were directed to the frontoparietal network or the putamen in visual selective attention, while connections in auditory selective attention were directed to the basal visual/auditory cortex.
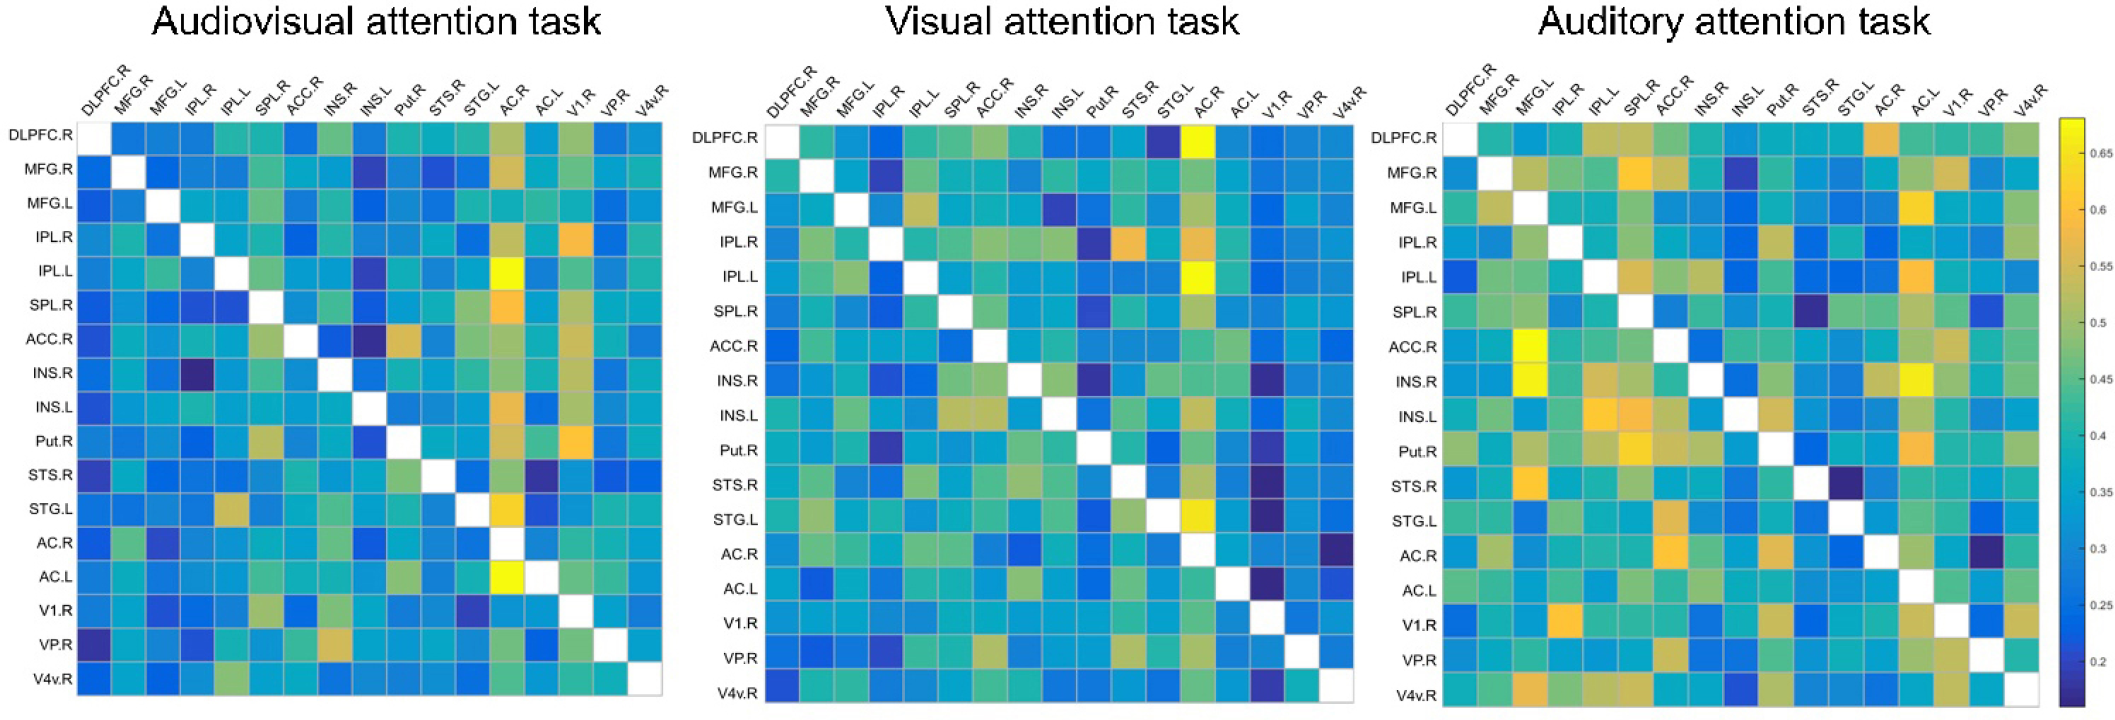
Average GC values in three spatial attention tasks. SPL, superior parietal lobe; IPL, inferior parietal lobe; DLPFC, dorsolateral prefrontal gyrus; MFG, middle frontal gyrus; AC, auditory cortex; VC, visual cortex; STS, superior temporal sulcus; STG, superior temporal gyrus; Put, putamen; INS, insula; ACC, anterior cingulated cortex; R, right hemisphere; L, left hemisphere. Matrices show the average GC value for 25 subjects in each spatial attention task, which reflects the information flow strength of each pair of effective connections.
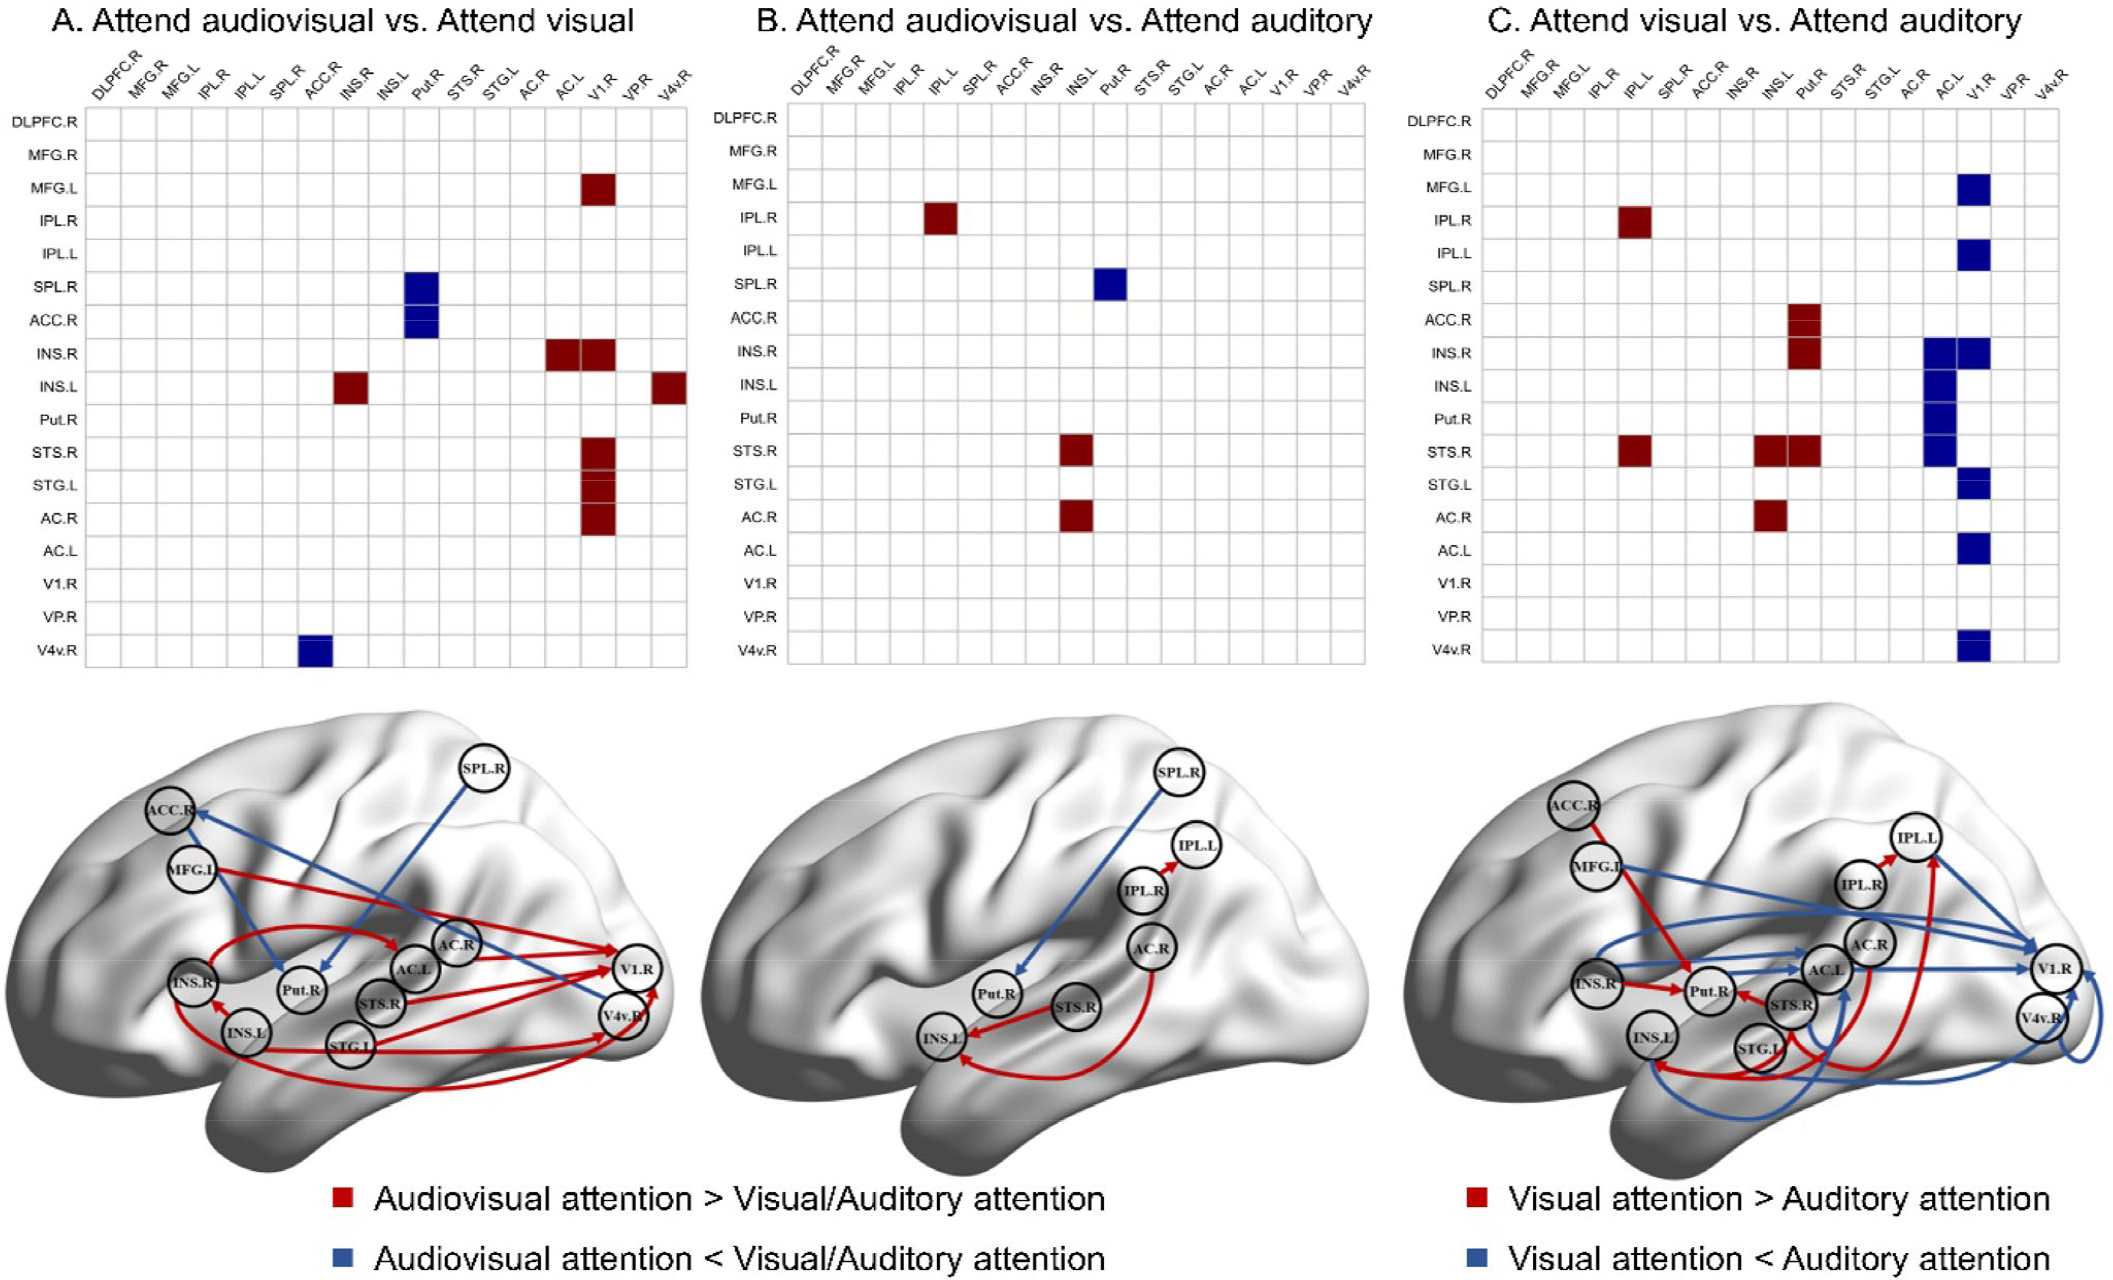
Significant differences were observed in effective connections between attention conditions. SPL, superior parietal lobe; IPL, inferior parietal lobe; DLPFC, dorsolateral prefrontal gyrus; MFG, middle frontal gyrus; AC, auditory cortex; VC, visual cortex; STS, superior temporal sulcus; STG, superior temporal gyrus; Put, putamen; INS, insula; ACC, anterior cingulated cortex; R, right hemisphere; L, left hemisphere. Granger causality directed connectivity with P < 0.05 as shown by arrows, where the red arrows indicate that the mean GC value of the audiovisual attention was greater than the visual/auditory attention or the visual attention is greater than the auditory attention, and the blue arrows indicate that the mean GC value of the audiovisual attention is smaller than the visual/auditory attention or the visual attention is less than auditory attention. The P values of significant effective connections are shown in the matrix.
Effective connections revealed using the T contrast of attentional tasks.
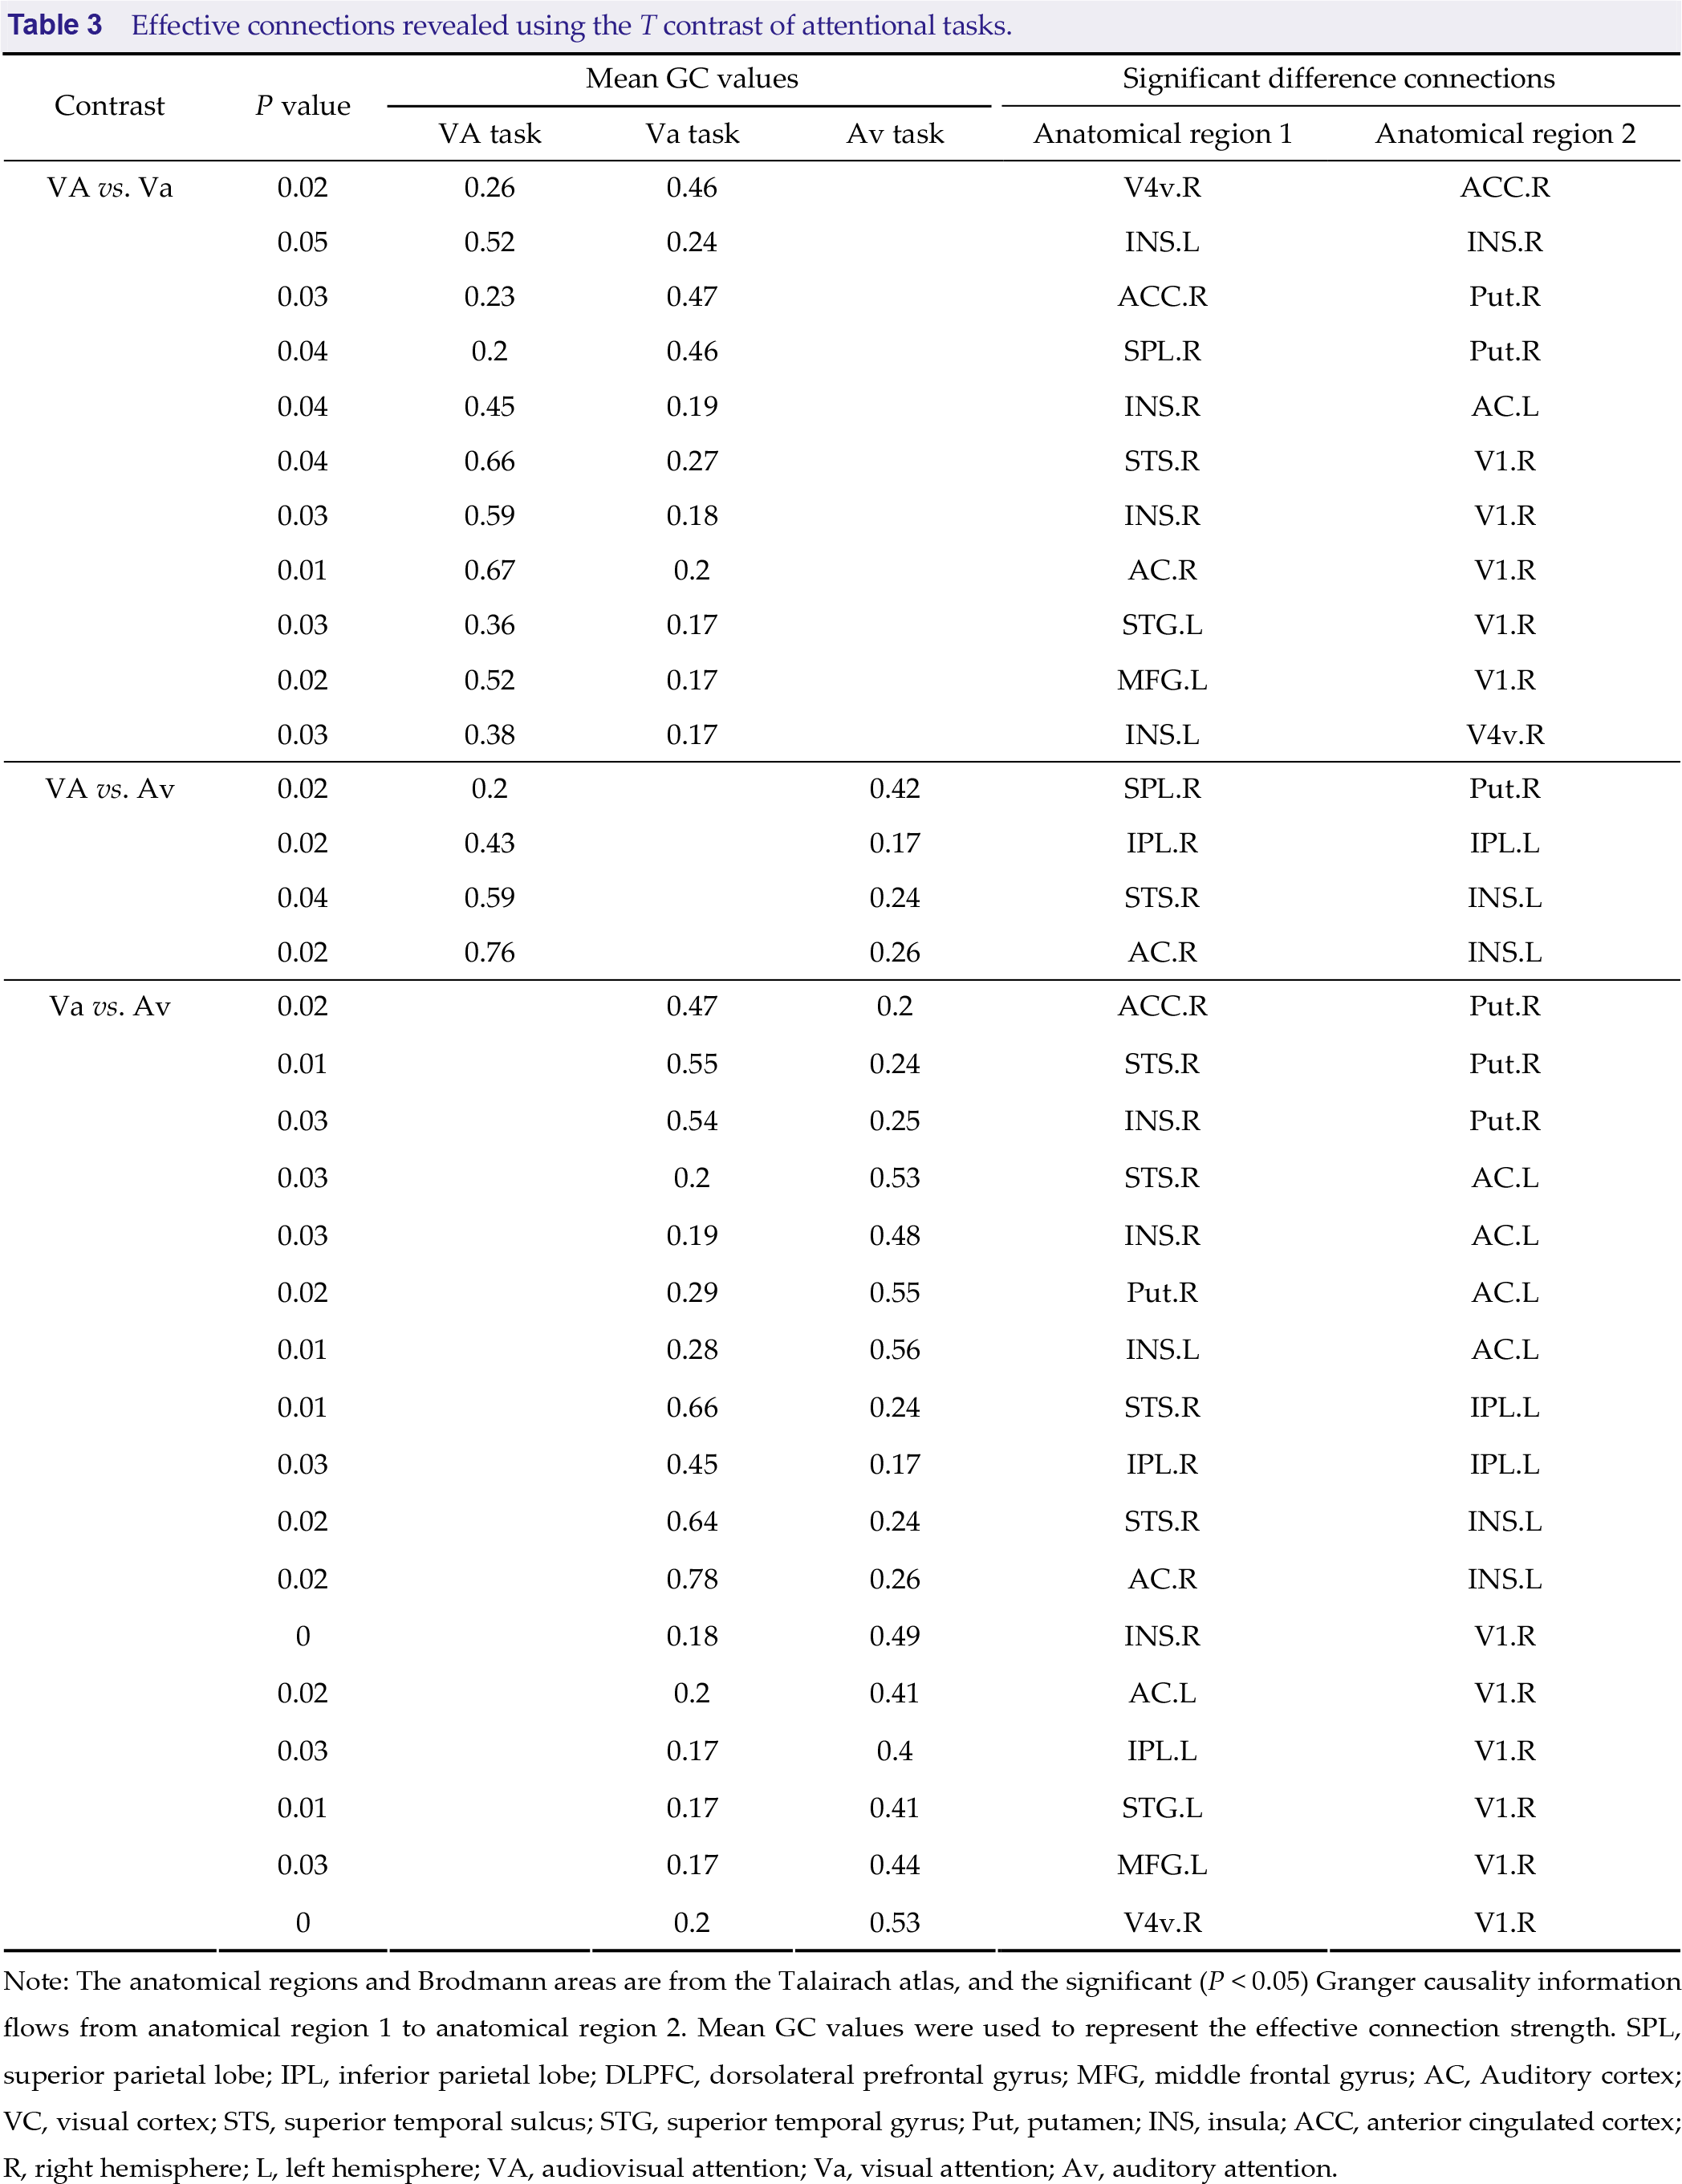
Note: The anatomical regions and Brodmann areas are from the Talairach atlas, and the significant (P < 0.05) Granger causality information flows from anatomical region 1 to anatomical region 2. Mean GC values were used to represent the effective connection strength. SPL, superior parietal lobe; IPL, inferior parietal lobe; DLPFC, dorsolateral prefrontal gyrus; MFG, middle frontal gyrus; AC, Auditory cortex; VC, visual cortex; STS, superior temporal sulcus; STG, superior temporal gyrus; Put, putamen; INS, insula; ACC, anterior cingulated cortex; R, right hemisphere; L, left hemisphere; VA, audiovisual attention; Va, visual attention; Av, auditory attention.
4 Discussion
Traditionally, multisensory integration has been considered as an automatic process [33]. Researchers [34–36] have found that multisensory integration can occur at various stages of attentional modulation of sensory stimuli and is achieved by selectively enhancing or inhibiting specific sensory inputs. Specifically, the classic brain mechanism of multisensory attention involves sensory information transfer between the primary cortex and advanced cognitive regions, which is the interaction of bottom-up feedforward and top-down feedback processing [37, 38]. Our research aimed to investigate cross-modal attentional propagation by focusing attention selectively or by dividing attention into the audiovisual modalities, thus exploring the competition and interaction between these modalities under the regulation of attention mechanisms; in addition, this research used causal information flow to reveal the expression of sensory patterns. Overall, in the present study, we investigated the effects of interstimulus competition on the cognitive demand of top-down spatial attention in audiovisual divided and selective attention tasks. To reveal the neural mechanisms that drive behavioral performance, we examined fMRI activation and conducted Granger causality analysis. We considered activity related to spatial attention, audiovisual integration and specific activation in the VAS task, and finally, the differences in effective connectivity between the divided attention task and the selective attention task were obtained. We further observed the differences between the visual and auditory selective attention tasks.
The spatial attention-related regions found in the present study are consistent with previous studies [39, 40]. These brain regions include the bilateral IPL, MFG, and DLPFC. We showed that the bilateral IPL and MFG (including the FEF) are all involved in spatial attention during both selective and divided attention processing, suggesting that the regions regulated in spatial attention are mostly bilateral [41–43]. Our results reflected broader activation of the DLPFC in the right hemisphere, which is consistent with the results of spatial attention regulating the dominance of the frontoparietal network in the right hemisphere [44, 45]. In addition, the large BOLD signal changes within the right SPL during the divided attention task agree with a theory of audio-visual stimuli shifting [46, 47]. Therefore, we believe that we have successfully modulated attention in each of the tasks.
4.1 Different neural mechanisms within spatial attention in divided vs. selective attention
Our results shown in Fig. 3 revealed the differences in the spatial attention-associated regions in the dorsal FPN among the three attentional tasks. On the basis of the findings from a meta-analysis [39], we concluded that the bilateral SPL (BA7), IPL (BA40), MFG (BA6/8), and DLPFC (BA46) are associated with spatial attention, as well as spatial working memory. These regions were considered not only for selective attention with a single target but also for a divided attention process with multiple targets. The role of the dFPN in spatial attention orientation was reported in an fMRI study [48, 49], which is consistent with our findings of widespread activation of both unilateral and bilateral networks, suggesting that spatial attention is not mediated by isolated cortex or unilateral networks but requires extensive bilateral frontoparietal networks.
In our study, we applied GC analysis to confirm the different neural mechanisms by which divided attention and selective attention regulate the process of audiovisual integration [50]. Our results demonstrated significantly higher activation in the divided spatial attention task than in the selective attention tasks. We also found that the effective connection strength of divided attention was higher than that of selection attention (Figs. 7(A) and (C), Table 3), which suggests that there is an interaction between spatial attention allocation and working memory. When observing multiple stimuli, the workload increases compared to focusing on a single stimulus, manifested by increased cortical activation and enhanced effective connection strength [12]. This is consistent with our behavioral results, with increased reaction times and a decreased correct answer rate in the divided attention task compared to those in selective attention tasks (Fig. 2). We also found more directional connections from the dFPN to the basal cortex during divided attention, confirming that the increase in spatial cognitive load requires support from the frontoparietal network [22, 51].
4.2 Effect of spatial selective attention on visual dominance in multisensory integration
We separately investigated the differential effects of selective attention on visual and auditory perception during audiovisual integration in a spatial cue task. Compared with the auditory selective attention task, the visual selective attention task is associated with higher activation levels and better behavioral performance, and our GC results indicated more information flows in higher cortices, such as the frontoparietal network (Figs. 2, 3, 4 and 7(C)). The current Bayesian framework of selective attention based on causal inference [52, 53] highlights how selective attention can be state-dependent or context-dependent to modulate the accuracy of sensory perception in goal-oriented and task-dependent search tasks, while sensory reliability has been shown to be an important factor in the inference process [54]. This is consistent with the modality-appropriateness hypothesis, which holds that when the brain is presented with bimodal stimuli, sensory channels with higher acuity in the task play a dominant role in forming the combined percept [36, 55]. Therefore, we separately attend to the visual and auditory parts of the audiovisual stimuli, and selective attention guides the competition of attentional resources between channels, resulting in different degrees of stimulus weighting in the process of audiovisual integration. In general, vision has higher spatial resolution than audition, and our results revealed a dominant effect of visual modality in a spatial cue task.
4.3 The putamen contributes to spatial attention allocation and prediction
Evidence from fiber tractography on diffusion spectrum imaging data and resting state fMRI data [56] shows converged structural and functional connectivity of DLPFC and IPL in the human striatum. In particular, the fiber connectivity between the neocortex and the putamen supports the idea that these projections are linked to signal processing, which is necessary for visuospatial attention. Furthermore, a previous visual spatial attention study [57] using the Posner paradigm with valid and invalid cues demonstrated that the activation of the putamen can reflect the processing of stimulus contingencies and probabilistic inference and the coding of prediction errors. Our results suggested that effective connections to the putamen are stronger in the selective attention task than in the divided attention task (Figs. 7(A) and (B)). According to attention load theory [58], selective attention is likely to be disrupted under low load conditions [59, 60]. An anatomical neurological study [61] confirmed that the components of the basal ganglia, such as the putamen, regulate the redistribution of attention resources by receiving signals from higher functional areas, such as the frontoparietal network. These signals allow the basal ganglia to selectively filter interfering stimuli, improving working memory and avoiding distraction. Thus, our findings were consistent with the spatial attention redistribution of the putamen. Previous research [62] has reported that the basal ganglia guides selective attention gating by suppressing irrelevant information and enhancing relevant information from multiple prefrontal cortical target representations. However, the spatial attention tasks employed here did not address the role of the putamen in the switching cost of dividing attention tasks and selective attention tasks.
4.4 Functional separation of the salience network in spatial attention tasks
The right ACC and right INS, which were activated in the divided attention task (Fig. 6), are considered key nodes in the salience network [63–65]. The salience network is involved in the detection, filtering, and orientation of external stimuli. Therefore, the higher spatial saliency accuracy required in divided attention activates the salience network more extensively. Our results did not suggest a distinct role for the salient network in the divided attention task compared to selective attention tasks. Instead, functional separation of the salient network in spatial attention tasks was found (Fig. 7). We reported significant directional connections of the ACC to the putamen. Following from the above discussion on the putamen, the ACC may play a role in the directional selection of the target task. We also reported directional information flows from the insula to the basal sensory cortex (such as AC/VC), speculating that the insula may be involved in the detection and filtering of visual and auditory tasks. A recent study [22] suggested that the salience network is interdependent with the dFPN, and our tasks did not show relevant associations, possibly related to specific differences in task demands.
4.5 Potential bias in fMRI reports
Small sample sizes in fMRI studies lead to selective reporting bias, which reduces the power of the studies. A meta-analysis [66] showed that 94% of studies had fewer than 30 subjects, which challenged subsequent statistical work because weak statistical power is accompanied by a lower positive predictive value, increasing the possibility of false positive results [67, 68]. We used NeuroPower Tools for analysis and reported statistical power (see Methods Section). Before conducting statistical analysis, we applied random-effects group analysis, which is commonly used in fMRI studies to assess the variability between subjects and to infer whether results obtained in individual subjects are generalizable to the population. Overall, small fMRI studies should report their exact statistical results seriously and apply different methods to assess potential bias to improve study standardization.
5 Conclusion
Our results demonstrate that different neural mechanisms are involved in top-down divided and selective spatial attention. Divided attention to bimodal targets, even without high-level informational content, produces multisensory integration. There was more activity in some brain regions during attention to bimodal targets than to unimodal targets. Further GC analysis confirmed enhanced information flow due to the cognitive load of divided versus selective attention. GC analysis also confirmed the visual dominance effect in unimodal spatial selective attention. Additionally, we found an important contribution of the putamen in attention allocation and functional separation of salience networks with spatial attention.
Footnotes
Ethical approval
The study was approved by the Ethics Committee of the Peking University Health Science Centre in accordance with the Declaration of Helsinki (2008).
Consent
Written informed consent was obtained from each participant.
Conflict of interests
All contributing authors report no conflict of interests in this work.
Funding
The study was supported by the National Natural Science Foundation of China (Grant Nos. 62171300, 61727807).
Authors’ contribution
Zhongtian Guan, Meng Lin, Qiong Wu, Jinglong Wu, Kewei Chen, Hongbin Han, Dehua Chui, Xu Zhang, Chunlin Li contributed to the conception and design of the work; Zhongtian Guan, Meng Lin, Chunlin Li participated in the data collection of fMRI experiments; Zhongtian Guan, Meng Lin, Chunlin Li drafted the manuscript. All the authors have approved the final manuscript.