
Abstract
In the fatigue state, the neural response characteristics of the brain might be different from those in the normal state. Brain functional connectivity analysis is an effective tool for distinguishing between different brain states. For example, comparative studies on the brain functional connectivity have the potential to reveal the functional differences in different mental states. The purpose of this study was to explore the relationship between human mental states and brain control abilities by analyzing the effect of fatigue on the brain response connectivity. In particular, the phase‐scrambling method was used to generate images with two noise levels, while the N‐back working memory task was used to induce the fatigue state in subjects. The paradigm of rapid serial visual presentation (RSVP) was used to present visual stimuli. The analysis of brain connections in the normal and fatigue states was conducted using the open‐source eConnectome toolbox. The results demonstrated that the control areas of neural responses were mainly distributed in the parietal region in both the normal and fatigue states. Compared to the normal state, the brain connectivity power in the parietal region was significantly weakened under the fatigue state, which indicates that the control ability of the brain is reduced in the fatigue state.
Keywords
1 Introduction
The fatigue state can lead to changes in the brain’s cognitive function. In the state of fatigue, the body is unable to initiate or sustain specific performance intensity during physiological activities and appears to be dysfunctional during the process of carrying out or maintaining certain activities. Cognitive tasks can induce fatigue, while an increase in the cognitive load can lead to an increase in the intensity of fatigue. The brain cognitive ability is reduced in the fatigue state compared to the normal state. However, the specific mechanism of the brain functioning during the fatigue state has not been intensively studied yet. There are many representations of the fatigue state in the human brain. For example, fatigue can be evaluated based on various neurophysiological parameters of the brain that change with the mental state. The mechanism of fatigue is quite complex. While fatigue can be caused by a central nervous system dysfunction, it can also involve a chain reaction from the body’s receptors, through the spinal cord, central nervous system, and specific functional areas of the brain, to the terminal mitochondria. The bioelectric signals such as electromyography, electroencephalogram (EEG), electrocardiogram (ECG), and retinal electricity induced by the above mechanisms are closely related to life states, and thus, can be used to characterize and monitor brain fatigue states.
EEG is a general reflection of the electro‐physiological activity of brain cells on the surface of the cortex or scalp. EEG is widely used in the fields of brain–computer interfaces [1, 2], fatigue monitoring [3], disease diagnosis [4], and cognitive science [5]. Several previous studies have shown that some characteristics of EEG can describe the fatigue state. For example, the fatigue state has been demonstrated to induce the increase in gamma (0.5–4 Hz) and theta (4–8 Hz) brain activity [6, 7]. The latency of event‐related potential has been shown to be delayed, while its amplitude reduced, when subjects enter the state of fatigue, signaling the decrease in subjects’ attention resources when they enter the state of fatigue [8 –10]. Furthermore, studies based on brain–computer inter‐faces have confirmed that the recognition performance of subjects significantly decreases when they enter the fatigue state [11]. Due to the sensitivity of EEG to fatigue, EEG has been used in driver fatigue monitoring [12, 13].
Among various EEG components, alpha activity is thought to be closely related to performing cognitive tasks. It has been effectively used to study the relationship between the fatigue state and brain functions. Alpha activity is the dominant oscillatory activity of the human brain [14]. It has been found to be the strongest in the frontal brain regions and high in posterior parts of the right hemisphere [15]. It has been associated with basic cognitive functions such as attention and memory, as well as more complex cognitive processes such as divergent thinking (i.e., creative idea generation). A number of EEG studies have further revealed that EEG alpha activity is associated with creativity‐related aspects of tasks and ideas. In particular, high alpha activity has been observed during divergent thinking [16, 17] and generating creative ideas [18 –22], as well as after successful creativity‐enhancing interventions [23, 24]. These findings suggest that creative cognition is reliably associated with increased alpha power‐levels in the brain [15].
Previous studies mostly focused on the effect of the fatigue state on the basic characteristics (e.g., amplitude and latency) of EEG, which is far‐fetched to reveal the impact of fatigue on brain connections due to the lack of a comparative analysis of the information flow from a holistic perspective. Traditional network analysis methods include canonical correlation analysis and directed transfer function. Brain connections analysis widely used in brain science provides an intuitive method for assessing the brain function state, which intuitively reflects the relationship between the mental state and the brain control network from the perspective of the information flow. According to this method, the entire brain is regarded as a complex network representing human responses to stimulations and emotional behaviors. In simulated networks, a node refers to a neuron or a group of nerve cells, while an edge refers to a neural connection. Thus, the results of network analysis reflect structural or functional connections between various brain regions that could provide more clues for explaining the complex mechanisms of different brain states. Toolboxes such as eConnectome can be used for mapping and imaging the brain functional connectivity at both the scalp and cortical levels from EEG.
This study attempts to reveal the differences in the brain connectivity caused by different mental states so as to reflect the effect of mental states on brain functions using the method of brain connections analysis based on EEG, focusing on its alpha component in particular. In this study, the phase‐scrambling method was used to generate images with two noise levels, while the paradigm of rapid serial visual presentation (RSVP) was used to induce the steady‐state visual evoked potential (SSVEP). Both clear and noisy images were used as visual stimulus images of RSVP to verify the effect of noise on the brain functional connectivity. The N‐back task was used to induce the fatigue state in subjects. Brain connections analysis between normal and fatigue states was conducted using the open‐source eConnectome toolbox. The relationship between the subject mental states and their brain control abilities was explored by analyzing the effect of fatigue on the brain response connectivity. This study aims to reveal the profound impact of the fatigue state on the brain functioning by analyzing the evidence of the effect of the fatigue state on the brain functional connectivity.
2 Methods
2.1 Subjects
Sixteen healthy subjects (5 females, 11 males, 20–36 years old, mean age 25 years) with normal or corrected‐to‐normal vision were recruited for this study. Each subject signed an informed consent form prior to the experiment and received a monetary compensation for his/her participation. This study was approved by the Research Ethics Committee of Tsinghua University.
2.2 Data acquisition
EEG data were recorded using the Synamps2 system (Neuroscan, Inc.) at a sampling rate of 1000 Hz. All 64 electrodes were used to record SSVEPs, referenced to the electrode at the position vertex “Ref”. All electrodes were placed according to the international 10–20 system. Electrode impedances were kept below 10 kΩ. During the experiment, subjects were seated in a comfortable chair placed in a dimly lit soundproof room at a distance of approximately 70 cm from the monitor. The recorded EEG data were filtered from 1 to 100 Hz using a band‐pass filter.
2.3 Data analysis
Data epochs were extracted according to event triggers generated by the stimulus program. In this study, time 0 of SSVEP represented the beginning of each image‐stimulus period (marked by a trigger), and the SSVEP amplitude and initial phase were calculated using the averaged SSVEP data within the time interval from 0 to 1000 ms.
2.4 Statistical analysis
Statistical analysis was conducted using the SPSS software (IBM SPSS Statistics, IBM Corporation). One‐way repeated‐measures analysis of variance (ANOVA) was used to test the difference in the SSVEP amplitudes across images with different noise levels. The Greenhouse– Geisser correction was applied if data did not conform to the sphericity assumption (assessed using Mauchly’s test of sphericity). All pairwise comparisons were adjusted using the Bonferroni correction. Statistical significance was defined as p < 0.05. Two‐way repeated‐measures ANOVA was used to test the difference in SSVEP amplitudes across different noise and fatigue levels in the experiment described in Section 4. Statistical significance was defined as p < 0.05.
2.5 Image scrambling method
EEG characteristics in the normal and fatigue states were compared based on two types of images with different noise levels according to the RSVP experimental paradigm.
The phase‐scrambling method was adopted to generate visual stimuli images with different noise levels. One of the remarkable features of this method is its ability to keep the global physical properties of images unchanged while changing their noise levels. In particular, the phase‐scrambling method employs a Fourier transform to randomize the phase component of an image while preserving its spectrum, allowing to distort the content‐related information [25 –27]. The phase coherence level was traditionally quantified as the percentage of pixels remained untransformed by the phase‐scrambling method. For intuition, in this study the concept of noise level was used to quantify the percentage of pixels transformed by phase‐scrambling method.
Fig. 1 illustrates the process of generating an image with noise using the phase perturbation method. In this study, street images were employed as visual stimuli. Images with 0% noise level corresponded to original images, while images with 50% noise level corresponded to images with noise. The noise level value represented the proportion of pixels processed using the phase‐scrambling method. Untransformed pixels were randomly selected in the image according to the noise level. The basic physical properties (e.g., brightness and contrast) of clear and noisy images remained the same [28].
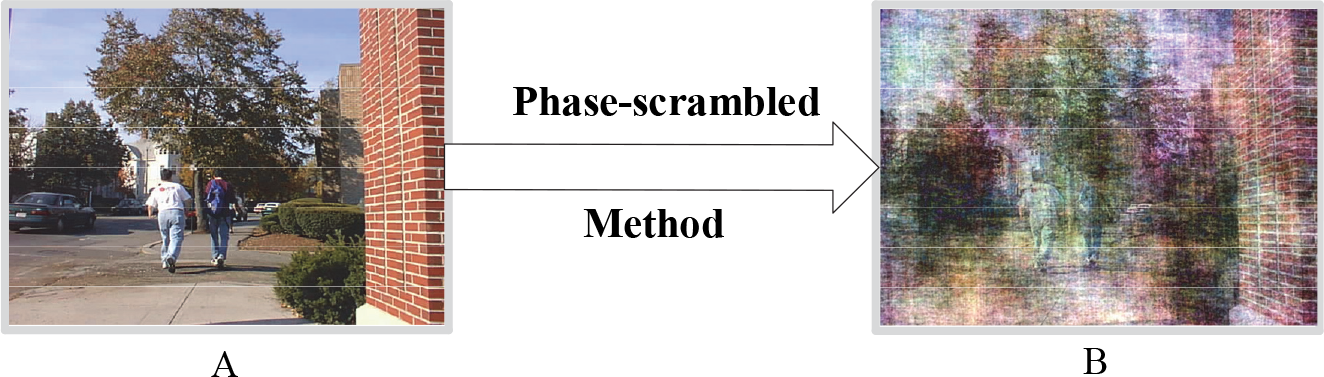
Phase‐scrambled images. (A) Noise level of 0%. (B) Noise level of 50%.
2.6 Rapid serial visual presentation stimuli
A 23.6‐inch liquid‐crystal display screen was used to display visual stimuli. The resolution of the screen was 1920 × 1080, while the refresh rate was 60 Hz. The visual stimuli images were presented within a 1200 × 800‐pixel square in the center of the screen, which was surrounded by a gray contour [RGB: (128, 128, 128)].
Fig. 2 shows the timing of the RSVP paradigm. Each cycle lasted for 100 ms and was divided into two periods, namely, the 16.7‐ms pre‐stimulation period and 83.3‐ms image‐stimulation period. At the juncture of these two phases, a trigger was sent to the acquisition system to mark the currently rendered stimulus image. The RSVP stimulus paradigm used images with two noise levels, namely, noise levels of 0% and 50%, as stimuli images, which were generated using the phase‐scrambling method as described in Section 2.1. While the noise level of the stimulus images used in a single trial was consistent, it could be different across the trials.
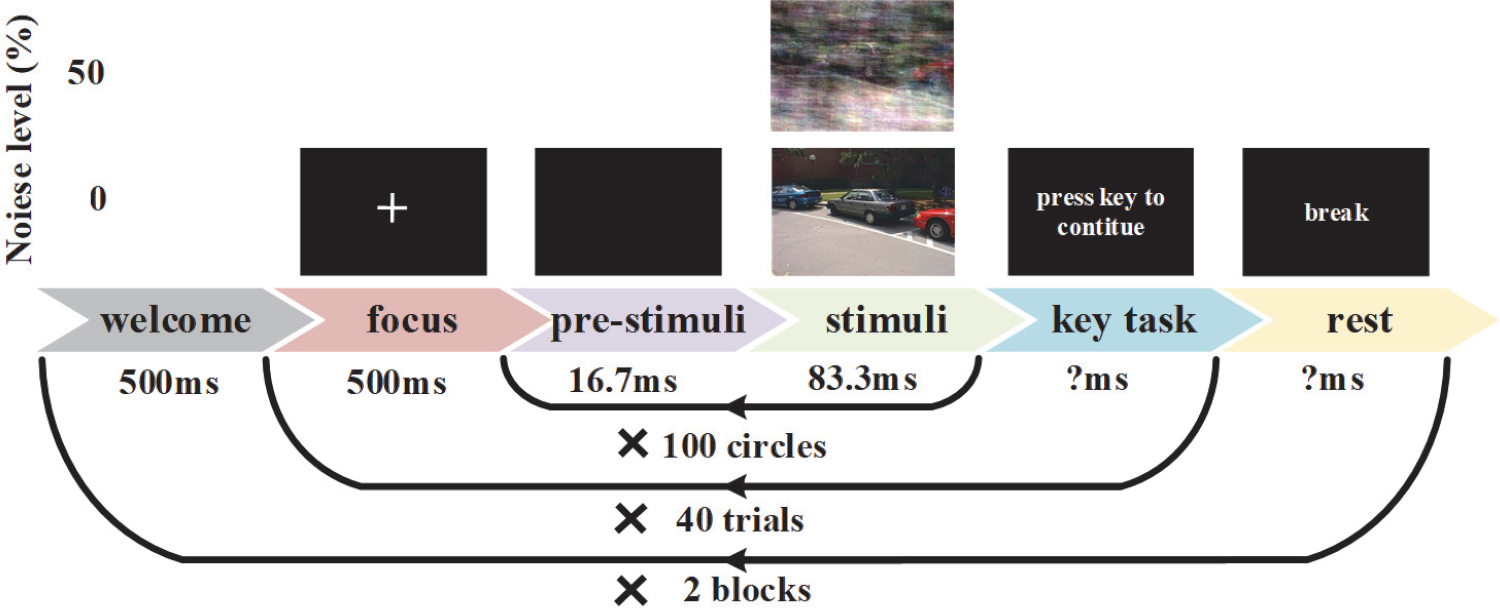
Flowchart of the rapid serial visual presentation paradigm.
The stimulus images used in this study were street view images of two categories: target images showing people and non‐target images not showing people. The target images accounted for about 3.5% of all stimulus images. During viewing the RSVP sequence, subjects were asked to search for the target images in a subjective manner. The SSVEP was produced under the periodical stimulation of the RSVP image sequence. The studied SSVEP signals corresponded to non‐target images to avoid the impact of target‐specific ERP signal components. The EEG data were evoked by the target image and the next five non‐target images were excluded.
The RSVP experiments were divided into two sets according to the subjects’ mental state: RSVP1 under the normal state and RSVP2 under the fatigue state. The stimulation frequency in RSVP1 and RSVP2 was 10 Hz. Both RSVP1 and RSVP2 covered two blocks, each containing 40 trials, 20 of which included images with noise. Each trial consisted of 100 images, including 3 or 4 target images. Images within one trial were presented in a random order. In RSVP1, subjects were given some rest time between blocks. In RSVP2, subjects were not given a rest time between blocks. The duration of the RSVP1 and RSVP2 experimental processes was about 20 and 15 minutes, respectively.
2.7 N‐back task
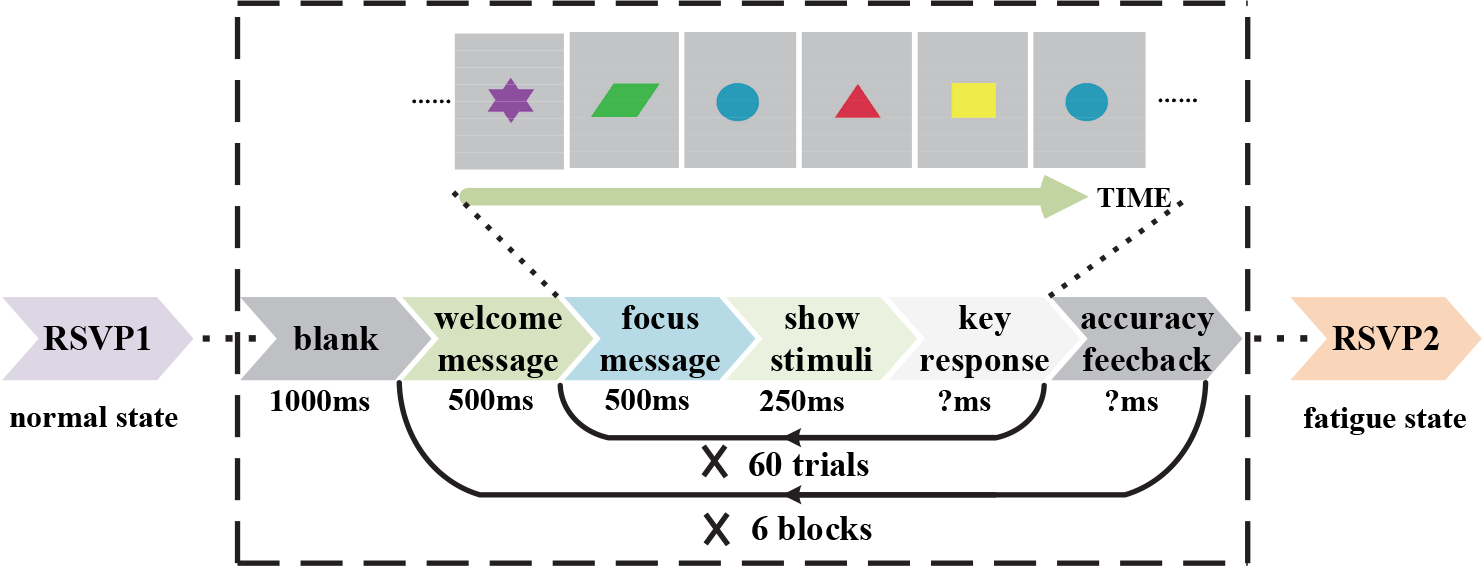
The N‐back working memory task can be used to induce and assess the fatigue state of subjects [29, 30]. In this study, the N‐back working memory task was performed between RSVP1 and RSVP2 to enable the subjects to enter the fatigue state from the normal state.
During the N‐back experiment, 25 images (including five colors and five shapes) were used as stimuli (Fig. 3). The participants had to perform the 3‐back working memory task, i.e., compare the current stimuli and the stimuli from the previous three trials. Each subject completed six blocks of 60 trials each. Each trial consisted of four phases: focus period (500 ms), image stimuli (250 ms), key response, and idle period (3000 ms). A brief training session was conducted with each subject to explain the N‐back task prior to starting the experiment. The left and right buttons of a keyboard were used to record the feedback results of the subjects. The accuracy and reaction time were recorded at the same time. The N‐back working memory task took about 20 minutes to complete.
Timing of N‐back tasks.
2.8 Brain functional connectivity analysis
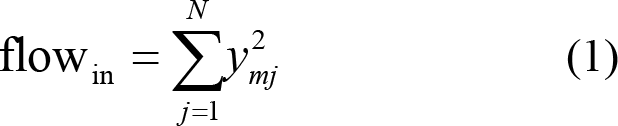
Brain functional connectivity analysis was used to represent the brain structure and functional differences between the normal and fatigue states. In this study, the eConnectome toolbox [31 –33] was used to compute the directed transfer function (DTF) and information flow. The major functions of eConnectome include EEG/ECoG preprocessing, scalp spatial mapping, cortical source estimation, connectivity analysis, and visualization. Granger causality measures such as DTF and adaptive DTF were implemented to estimate the directional interactions of brain functional networks over the scalp and cortical sensor spaces. Cortical current density inverse imaging was implemented using a generic realistic geometry brain–head model from scalp EEG. The information flow of region m was calculated as
where
The information flow gain ρ, defined as the ratio of the outflow and inflow information, was computed according to Ref. [34] as
where the value of ρ positively correlates with the contribution of a node to the transmission of network information.
3 Results
3.1 The results of the N‐back task
The behavioral statistical results for the N‐back working memory task are illustrated in Fig. 4. It can be noticed from Fig. 4(A) that the averaged discrimination accuracy across the subjects is lower in the first block (75.4%), higher in the second to fifth blocks (84.3%, 84.9%, 84.8%, and 83.6%), and significantly lower in the last block (77.8%). From Fig. 4(B), it can be noticed that the averaged reaction time of the subjects gradually decreased from block 1 to block 4 (2.47 s, 2.00 s, 1.88 s, and 1.78 s) and then gradually increased from block 4 to block 6 (1.78 s, 1.95 s, and 2.03 s). These behavioral statistical results indicate that the subjects required some time at the beginning to get familiar with the task. In the middle stage of the task, the subjects were in the normal state since the discriminant accuracy was relatively high and the reaction time was relatively short. At the end of the task, the recognition accuracy became relatively low and the reaction time became relatively long, indicating that the subjects became fatigue.
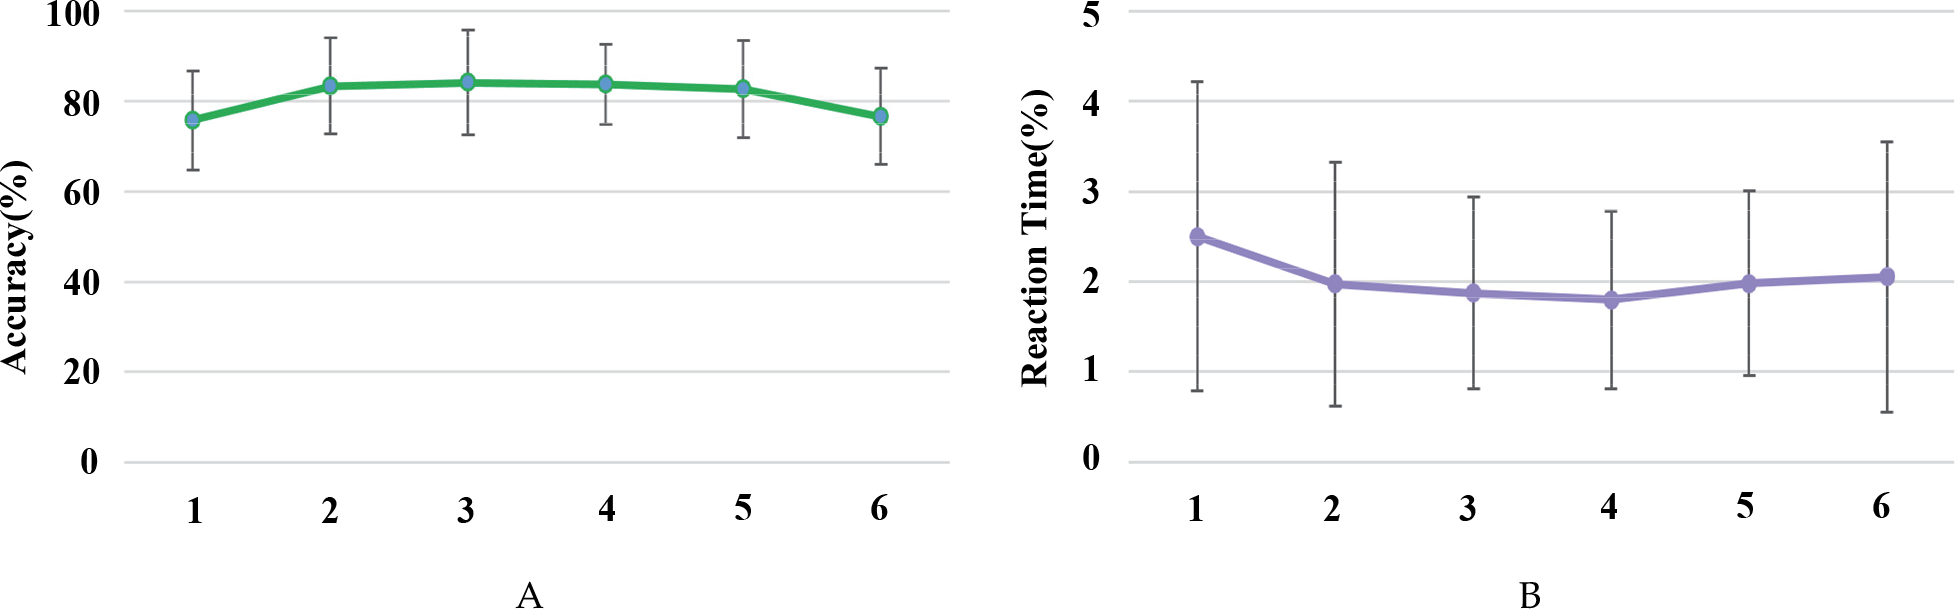
Behavioral statistical results for the N‐back task. (A) Discrimination accuracy. (B) Reaction time.
3.2 The results of brain connectivity analysis
Figs. 5(A)–(D) show the information flow chart of the brain in the frequency bands of [2, 4] Hz, of the brain in the frequency bands of [2, 4] Hz, [5, 7] Hz, [8, 13] Hz, and [14, 30] Hz, respectively. The information flow values were calculated in the four different brain regions: frontal, parietal, temporal, and occipital. The largest information values can be observed for the parietal region in all frequency bands, mental states, and image noise conditions. For example, for the frequency band of [2, 4] Hz [Fig. 5(A)], the information values in the frontal, parietal, temporal, and occipital regions are 0.018, 0.091, 0.054, and 0.012 in the fatigue state and clear image condition; 0.041, 0.066, 0.064, and 0.006 for the fatigue state and clear image condition; 0.032, 0.085, 0.051, and 0.010 for the fatigue state and clear image condition; and 0.046, 0.078, 0.051, and 0.005 for the fatigue state and clear image condition, respectively. Furthermore, the information flow values for the parietal region in the fatigue state and noise image condition are much lower than the values in the other three conditions. For example, for the frequency band of [5, 7] Hz [Fig. 5(B)], the information flow values in the parietal region are 0.090, 0.066, 0.085, and 0.080 for the conditions of “fatigue state, clear images”, “fatigue state, noise images”, “normal state, clear images”, and “normal state, noise images”, respectively.
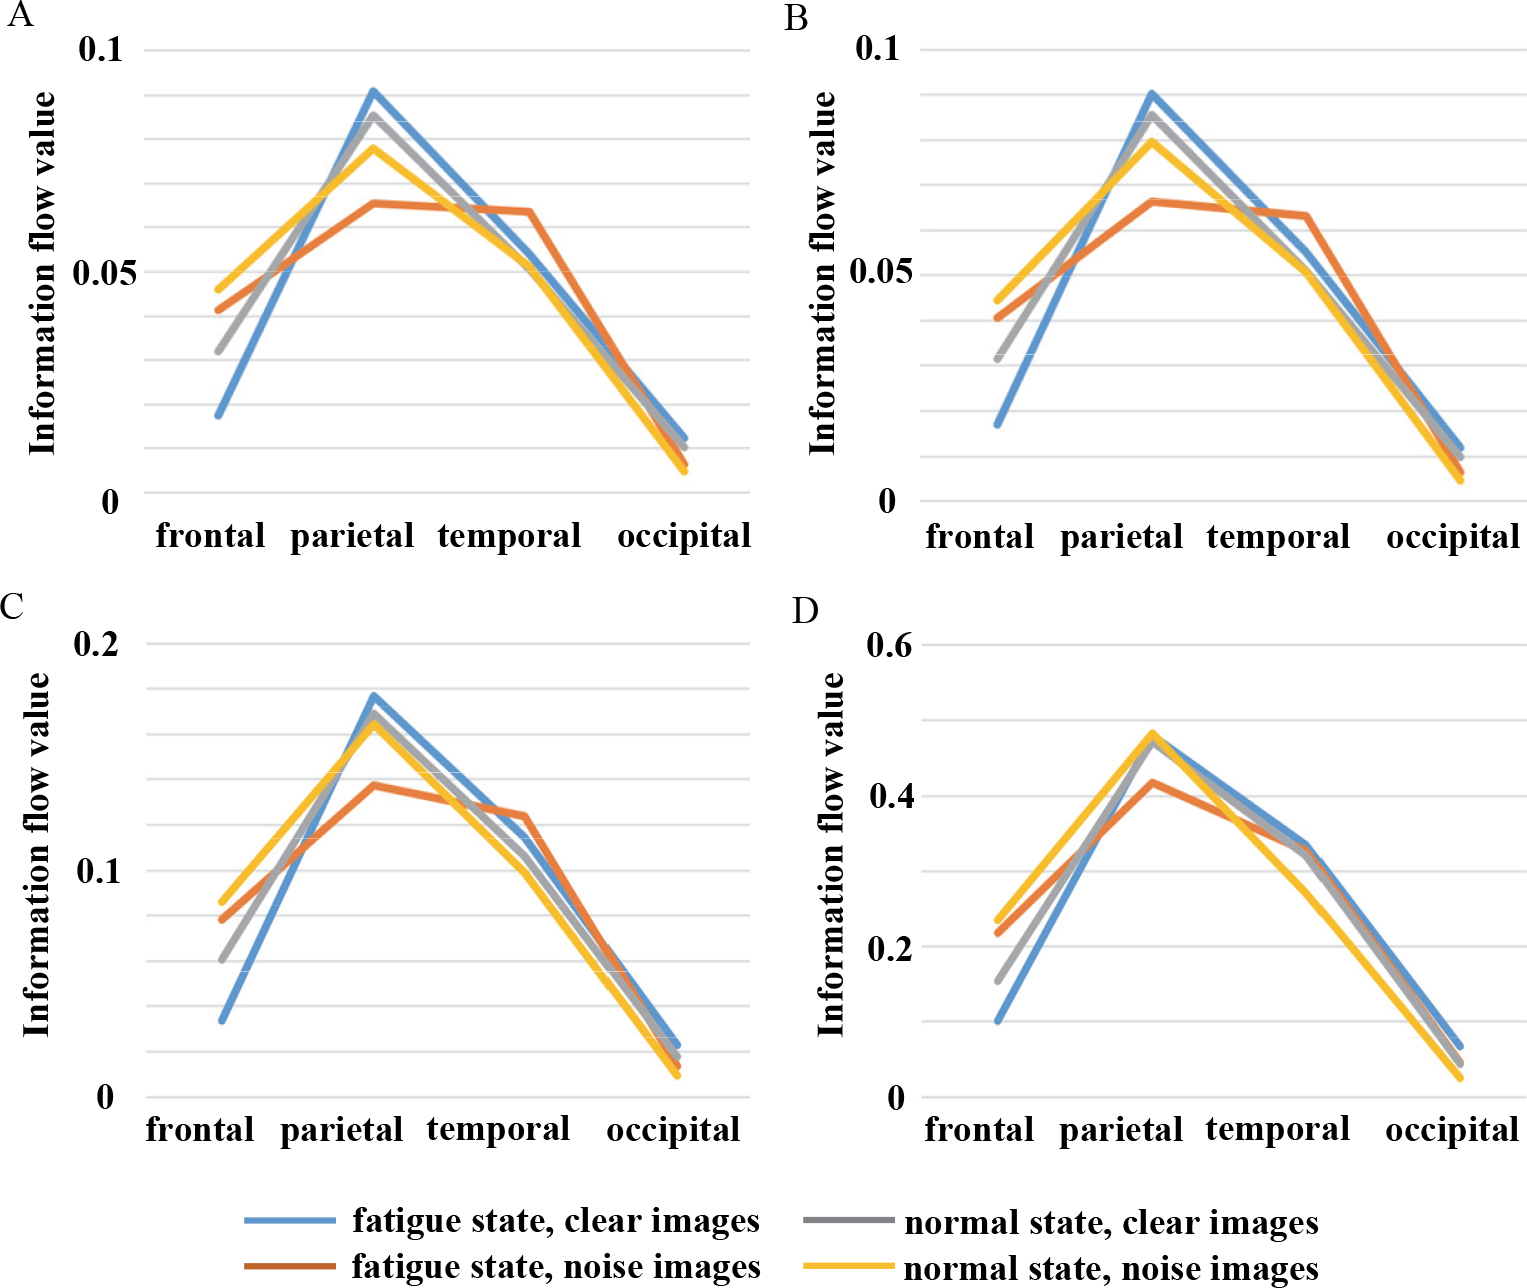
Fig. 6 shows the information flow values in the alpha‐band (8–13 Hz) in different EEG channels grouped into frontal, parietal, temporal, and occipital regions, as shown in the abscissa. The values of information flow shown in the figure represent the intensity of information flowing to other regions. These values are normalized and color‐coded. For example, the information flow values in the parietal region are 0.177, 0.137, 0.169, and 0.165 for the conditions of “fatigue state, clear images”, “fatigue state, noise images”, “normal state, clear images”, and “normal state, noise images”, respectively.
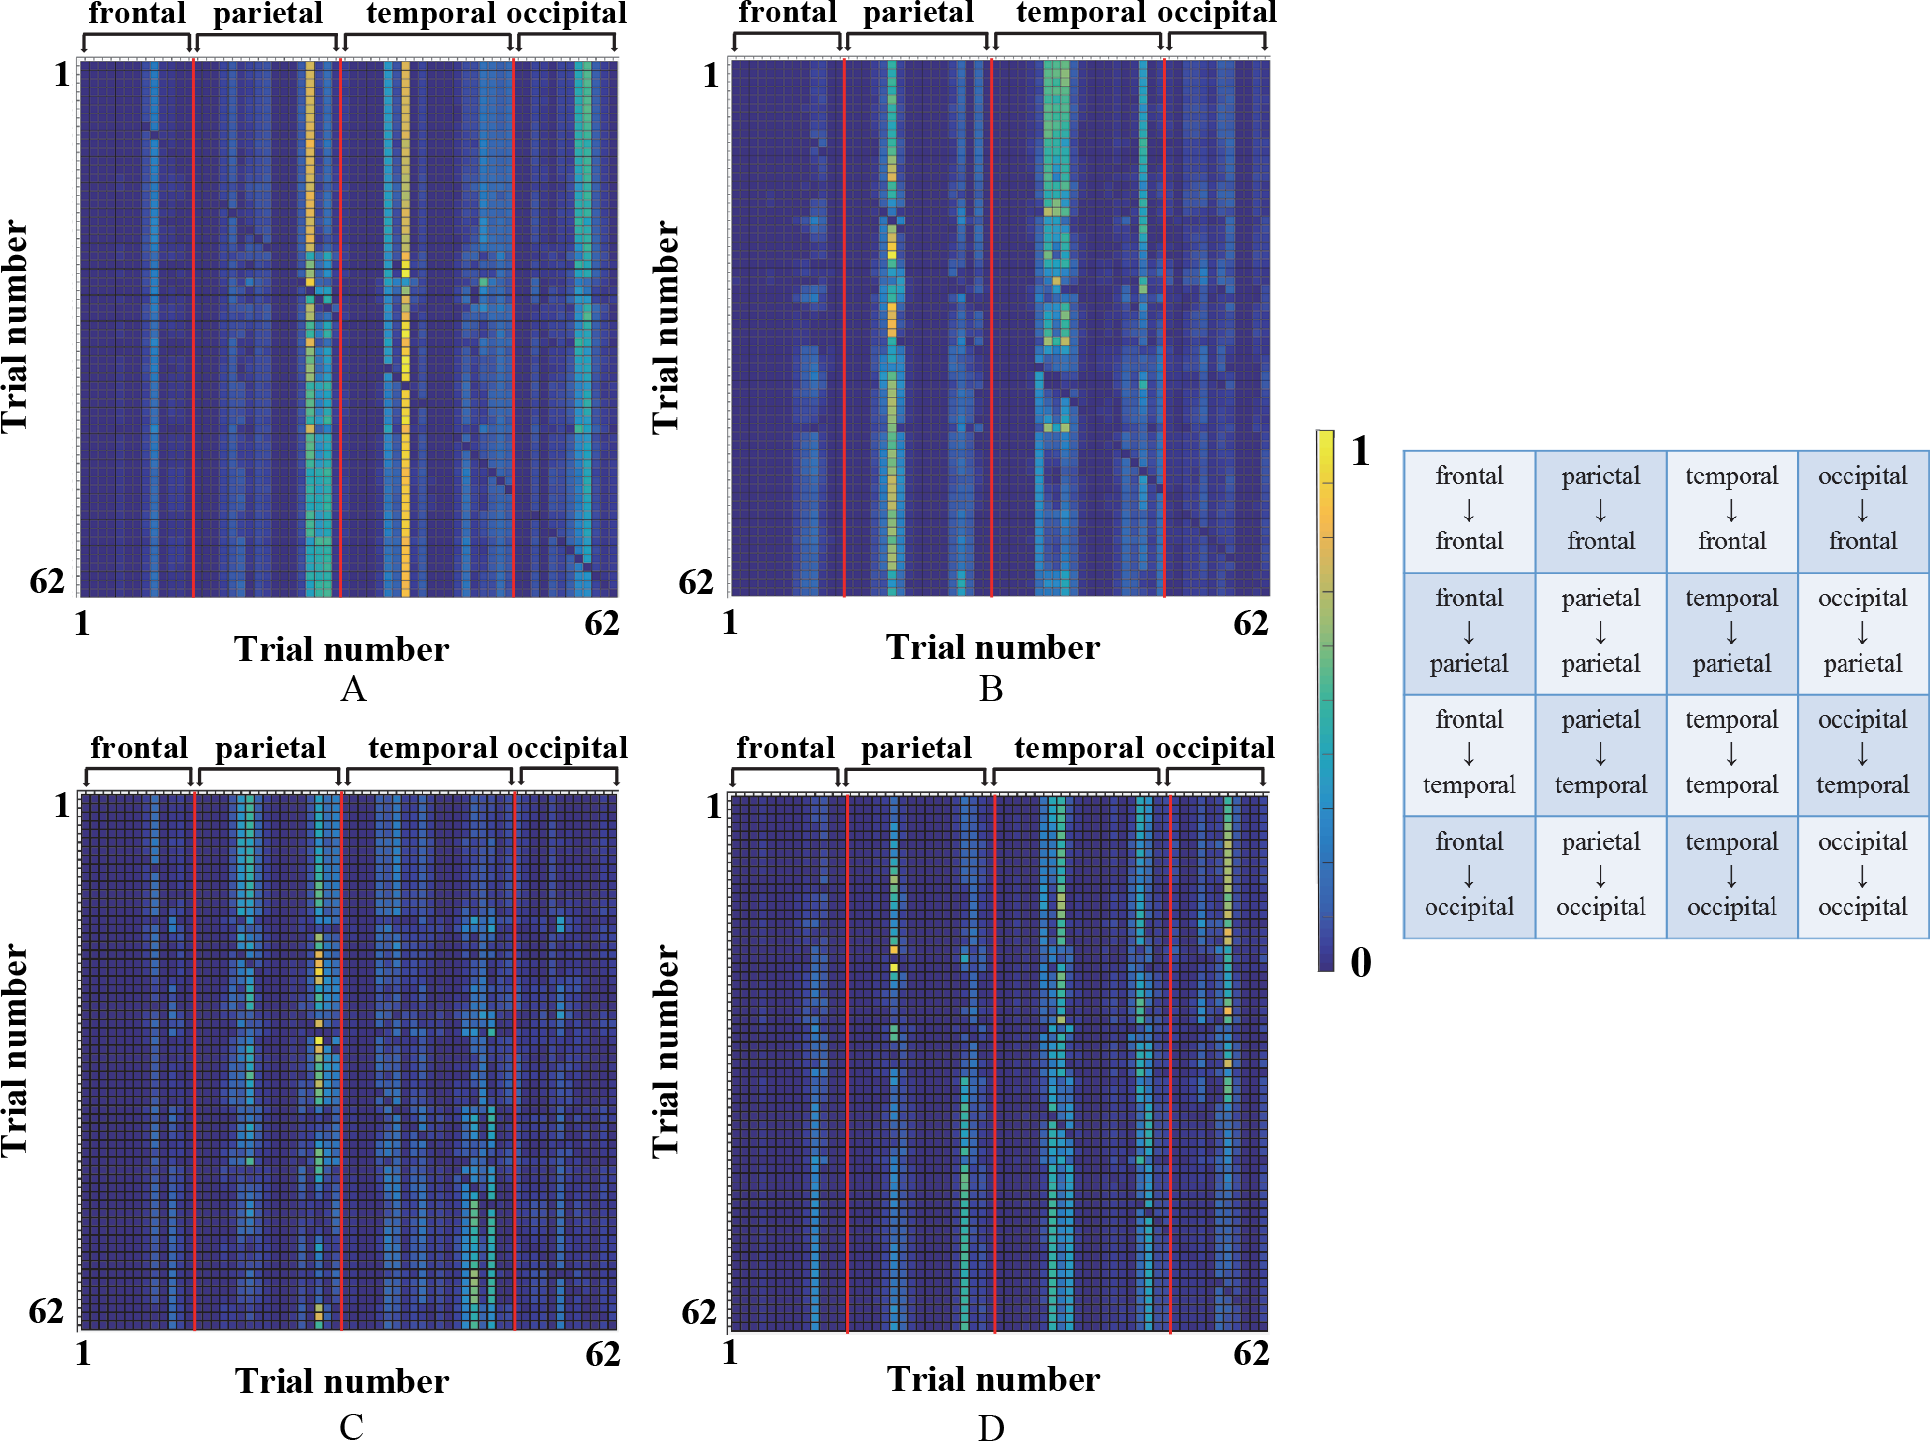
Information flow charts for the brain in the alpha‐band. (A) Normal state, noise images. (B) Fatigue state, noise images. (C) Normal state, clear images. (D) Fatigue state, clear images.
Fig. 7 illustrates the information flow (alpha‐band) in different brain and image noise states. The figure visually demonstrates the intensity of the information flow from the parietal region to the occipital region. It can be noticed from the figure that the intensity of the information flow in the “fatigue state, noise images” condition is significantly lower than that in the other three conditions, indicating that different mental states and image noise conditions have significant effects on the brain connectivity.
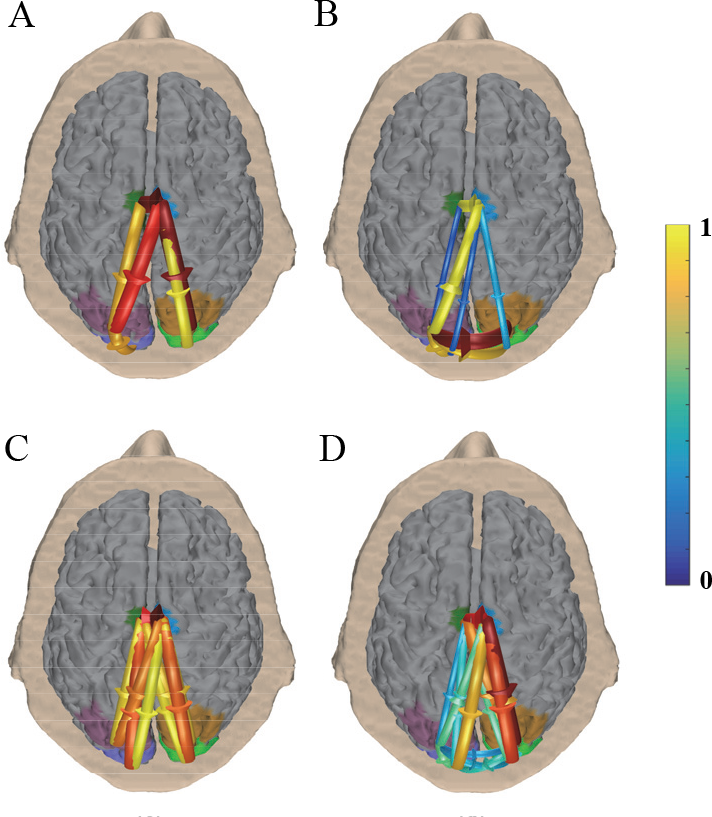
Information flow (alpha‐band) in different brain states. (A) Normal state, noise images. (B) Fatigue state, noise images. (C) Normal state, clear images. (D) Fatigue state, clear images.
4 Discussion
4.1 Effects of fatigue and image noise on brain connectivity networks
The results illustrated in Figs. 5 –7 demonstrate the impact of the mental states and image noise conditions on brain connectivity networks. It can be noticed from Fig. 5 that the fatigue state and image noise have significant effects on the information flow in the parietal region regardless of the EEG frequency band. While for the frontal, temporal, and occipital regions, the effects of the fatigue state and image noise on brain networks was inconspicuous. The sensitivity of brain connectivity networks in the parietal region to fatigue was consistent with the theory stating that the parietal region is involved in the control of brain activities [31, 34]. Thus, the parietal region has the most obvious response when the state of the brain changes due to fatigue.
The comparative analysis performed in this study reveals that the fatigue state has a greater impact on EEG when induced by noise images compared to clear images. This result can be explained by the theory of attention resource allocation of the brain. According to the RSVP paradigm, the task of searching for clear images corresponds to a simple task consuming a small amount of attention resources, whereas the task of searching for noisy images corresponds to a difficult task requiring a lot of attention resources. A simple RSVP task has less impact on the brain function since it requires a small amount of attention resources. Thus, the difference of brain connectivity networks between the normal and fatigue states was less for the easy task involving clear images compared to the difficult task involving noisy images. While there was no significant difference in the brain network between the clear and noisy image conditions in this study, the difference can potentially be amplified by increasing the difficulty of tasks and level of subjects’ fatigue.
At the same time, the information flow values in the clear image condition were larger than those in the noise image condition, which is consistent with the fact that clear images represent an easy task yielding high detection results.
4.2 Distribution of the information flow (alpha‐band)
EEG research has a long tradition of studying the oscillatory brain activity related to various cognitive tasks and emotional states. EEG alpha activity is the dominant oscillatory activity of the human brain [14], and has been associated with basic cognitive functions such as attention and memory [35]. The brain mental states have the potential to be reflected by brain connectivity networks for EEG in the alpha‐band, which was the focus of this study.
Alpha synchronization has been found to be associated with brain control functions. Examining the functional significance of the EEG alpha and beta activities, Ray and Cole [36] found that the alpha power is lower in sensory‐intake tasks compared to intake‐rejection tasks. The authors suggested that the alpha activity reflects attentional demands and is higher for tasks requiring internal attention focus than tasks requiring external attention focus. It has been proposed that alpha increases may reflect active top‐down inhibition of task‐irrelevant brain regions such as inhibition of the access to semantic long‐term memory [35] and inhibition or disengagement of visual areas to suppress the processing of irrelevant visual information [37]. The alpha activity thus plays an important role in attention by supporting processes within the attention focus and blocking processes outside its focus.
Using brain connectivity analysis, this study found that the main control area of the alpha‐band information flow is concentrated in the parietal region, which is consistent with previous studies. In particular, alpha synchronization has been found to be the strongest in the frontal brain regions but also high in the posterior parts of the right hemisphere [15]. As early as 1985, Ray and Cole [36] found a correlation between the overall parietal alpha‐band and mental tasks in two experiments designed to examine the relationship between the mental effort and EEG during cognitive tasks of an emotional nature. Their conclusions reflected the reliability and rationality of the experiments presented in this paper.
The results of this study provide new evidence for previous research on the distribution of the alpha activity in brain connectivity networks. Furthermore, this study reveals the effects of the fatigue state on brain connectivity networks and proposes a method for evaluating and detecting the fatigue state. In particular, the introduction of image noise allows to reflect the interaction between attention resource allocation and brain networks.
5 Conclusion
This study investigated the brain functional connectivity using EEG data collected during normal and fatigue states of subjects. The results of the study verified the distribution of the control area of the brain and demonstrated the effect of the fatigue state on the functional connections of the brain. Under normal and fatigue conditions, the energy of the brain functional connections was found to be distributed mainly in the parietal region regardless of the employed visual stimuli (clear or noisy images). The brain neural response control area was confirmed to come mainly from the occipital region. The alpha information flow in the brain, especially in the parietal region, was found to be significantly decreased under the fatigue state compared to the normal state. The results of this study are expected to provide new objective measures for evaluating the fatigue status.
Footnotes
Conflict of interests
The authors declare no conflict of interests in this work.
Acknowledgments
This work was supported by the Key R&D Program of Guangdong Province, China (No. 2018B030339001); National Key R&D Program of China (No. 2017YFB1002505); and National Natural Science Foundation of China (No. 61431007).