
Abstract
To date, there is no definitive demonstration of the utility of positron emission tomography (PET) in studying glucose metabolism in cultured cell lines. Thus, this study was designed to compare PET to more standardized methods for the quantitative assessment of glucose uptake in nontransformed and transformed living cells and to validate PET for metabolic studies in vitro. Human colon and breast carcinoma cell lines and mouse embryo fibroblasts were evaluated for [18F]fluorodeoxyglucose ([18F]FDG) uptake by PET and autoradiography and 2-deoxyglucose (2-DG) incorporation by colorimetric assay and analyzed for the radiotoxic effects of [18F]FDG and the expression levels of glucose transporters. Indeed, [18F]FDG incorporation on PET was comparable to [18F]FDG uptake by autoradiography and 2-DG incorporation by colorimetric assay, although radiotracer-based methods exhibited more pronounced differences between individual cell lines. As expected, these data correlated with glucose transporters 1 to 4 and hexokinase II expression in tumor cell lines and mouse fibroblasts. Notably, [18F]FDG incorporation resulted in low apoptotic rates, with fibroblasts being slightly more sensitive to radiotracer-induced cell death. The quantitative analysis of [18F]FDG uptake in living cells by PET represents a valuable and reproducible method to study tumor cell metabolism in vitro, being representative of the differences in the molecular profile of normal and tumor cell lines.
THE MAJORITY OF solid tumors exhibit enhanced glucose consumption under aerobic conditions, a phenomenon known as the Warburg effect. This information has been used for diagnostic purposes to discriminate tumors from normal tissues and detect malignant disease using positron emission tomography (PET) and the glucose analogue 2-[18F]-2deoxy-D-glucose ([18F]FDG) as a radiotracer. 1 Indeed, [18F]FDG is transported intracellularly by the same glucose transporters (GLUTs) as glucose and is retained within tissues with high glucose metabolism as malignant tumors.2,3 Among several GLUT isoforms, many human tumors upregulate the expression of GLUT1 as a major mechanism responsible for increased glucose uptake and preferential glycolytic metabolism. 4 7 Thus, measuring [18F]FDG uptake in a heterogeneous cell population is of great interest because it may help discriminate between transformed and untransformed cells and further our understanding of the heterogeneous metabolic alterations displayed by tumors.
Many different technologies have been developed to image the structure and function of human malignancies, including autoradiography, optical imaging, PET, magnetic resonance imaging, and x-ray computed tomography (CT). Among these methods, PET is the only noninvasive technology that can simultaneously measure metabolic, biochemical, and functional activity in vivo.8,9 Indeed, PET is a widely used technology for the diagnosis and staging of various tumor entities, as well as for monitoring the therapeutic activity of radiation and chemotherapy. In particular, PET offers great potential to monitor cell metabolism, proliferation, angiogenesis, perfusion, hypoxia, or apoptosis using a wide range of specific radiotracers with exquisite sensitivity.8,9
In vitro cancer models are important and widely used research tools for the understanding of tumor disease processes and the evaluation of novel therapies. Recently, tumor metabolism has begun to emerge as a relevant field of interest in cancer cell biology and translational research for the development of novel therapeutic strategies and the characterization of prognostic and predictive biomarkers.10,11 Thus, appropriate technologies to evaluate tumor cell metabolism and assess the metabolic responses induced by novel molecular targeted agents in living tumor cells are needed.
At present, the methodologies used to evaluate glucose uptake in mammalian cell lines are (1) enzymatic methods based on unlabeled 2-deoxyglucose (2-DG) by fluorescence and colorimetric assays and (2) methods based on fluorescent or radiolabeled glucose analogues. Because a recent article suggested that the evaluation of glucose uptake in cultured cells is within the detection limits of PET, 12 this study was conceptualized with the aim of establishing PET as a valuable procedure for the quantitative assessment of [18F]FDG uptake in nontransformed and transformed cell lines, as well as to compare radiotracer measurement using PET with a nonradioisotopic photometric assay.
Materials and Methods
Cells and Chemicals
Human breast MCF7 and colon HCT116, HT29, and CaCo2 carcinoma cell lines and immortalized mouse embryo NIH3T3 fibroblasts were purchased from ATCC (Manassas, VA) and cultured in Dulbecco's Modified Eagle's Medium (DMEM) containing 10% (v/v) fetal bovine serum, 1.5 mmol/L glutamine, and 100 units/mL penicillin and streptomycin in standard conditions. Cell lines were routinely monitored in our laboratory by microscopic morphology checks. The authentication of cell lines was checked 12 months prior to beginning this study using standardized techniques of DNA profiling, immunocytochemistry for estrogen receptors in MCF7 cells, mutational analysis for codon 13 RAS mutation in HCT116 cells, and V600E BRAF mutation in HT29 cells according to the ATCC product description. Unless otherwise specified, chemicals were purchased from Sigma-Aldrich (Saint-Louis, MO) and cell culture reagents from Gibco (Carlsbad, CA).
[18F]FDG Uptake Assay
The experimental set-up for the quantification of [18F]FDG uptake by PET and autoradiography is schematically represented in Figure 1. For radiolabeling experiments, 1 × 10 cells were seeded in 100 mm plates and incubated in a culture medium until attachment. After 48 hours, cells were washed with phosphate-buffered saline (PBS) and cultured in glucose-free DMEM for 2 hours. Next, the cells were detached with 0.5% (v/v) trypsin and counted using a Bürker chamber, after which 3 × 10 6 cells were incubated in glucose-free DMEM containing 1.31 ± 0.06 MBq [18F]FDG at 37oC for 30 minutes in shake-up. The activity of radiolabeled FDG was measured using an automated gamma-counter (Isomed 1000, version 2.11, Nuclear-Medizintechnik, Dresden, Germany). Radiotracer concentration, decay-corrected, was measured using a commercial PET/CT scanner (GE Discovery VCT scanner, GE, Waukesha, WI) that combines a PET scanner and a LightSpeed VCT 64-row multidetector CT system (pitch X 1.5; 120 mAs; 120 kVp). Radioactivity was acquired for 5 minutes (one bed position) for the daily standard before and after washing cells with PBS by spin-dry at 1,500 g for 10 minutes. Raw CT data were reconstructed into transverse images with a 0.625 mm section thickness. Raw PET data were reconstructed with and without attenuation correction into transverse, sagittal, and coronal images, according to a standard procedure. Attenuation correction was based on CT attenuation coefficients, which were determined by iterative reconstruction. For the quantitative assessment of [18F]FDG, however, only uncorrected images were used. [18F]FDG uptake was expressed as kBq/mL and determined within a volumetric region of interest encompassing the plate image. Maximum and mean standardized uptake values (SUVmax and SUVmean) were also used to ensure consistency with diagnostic PET methodology. The ratios between these parameters obtained after cell washing (cell-specific radioactivity) with respect to the same parameters measured before cell washing (total radioactivity added to the cell culture) were calculated. Finally, data were normalized to the total cell numbers calculated in the same cell populations after each experiment.

Graphical representation of the experimental set-up for the quantification of [18F]FDG uptake by positron emission tomography (PET) scan and autoradiography.
To confirm that the radiotracer incorporation by cell lines was specific, autoradiography (Cyclone Plus Storage Phosphor System, PerkinElmer, Waltham, MA) was used, in parallel with PET acquisitions, to determine the radioactive signal of labeled cells with respect to the total radiotracer added to the culture medium. To this end, the Cyclone Plus Storage Phosphor System was used to obtain high-resolution filmless autoradiography of both the cell medium solution and the cell monolayer.13,14 This method was selected because it is well suited to detecting PET radiopharmaceuticals. The emulsion was apposed for 30 seconds to the labeled cell plate, and the autoradiograph was obtained before and after washing cell monolayers. The distribution of radioactivity along the plates was measured and analyzed using OptiQuant image analysis software (PerkinElmer). The radioactivity in cells and medium was measured to determine the cell-bound radioactivity fraction, and the percentage of internalized radioactivity was decay- and background-corrected and calculated for each time point. Autoradiography raw data were normalized to cell numbers and expressed as digital light units per square centimeter (DLU/mm2). Experiments were performed three times using three replicates for each experimental condition.
In selective experiments, a comparative cell uptake analysis was also carried out using the same methodology but with images acquired through a two-dimensional conventional nuclear medicine modality. To this purpose, 25.9 ± 0.1 MBq of 123I were added to each cell culture, and images were assessed by gamma-camera (Infinia VC Hawkeye 4, GE, Milwaukee, WI).
2-DG Uptake Assay
To evaluate 2-DG uptake, a colorimetric assay was used according to the manufacturer's protocol (ab136955, Abcam, Cambridge, UK). Briefly, cells were plated at 8 × 10 4 cells/well in 24-well cell culture plates and incubated in a standard culture medium for 24 hours. Cells were washed twice with Krebs-Ringer-phosphate-HEPES (KRPH) buffer (20 mM HEPES, 5 mM KH2PO4, 1 mM CaCl2, 136 mM NaCl, 4.7 mM KCl, pH 7.4) and cultured in glucose-free DMEM for 1 hour. Subsequently, the cells were incubated in a KRPH buffer containing 2% (v/v) bovine serum albumin for 40 minutes in the presence and absence of 10 mM 2-DG for 20 minutes. Next, cells were washed three times with PBS to remove exogenous 2-DG, lysed with extraction buffer, frozen once, heated at 85° C for 40 minutes to degrade endogenous nicotinamide adenine dinucleotide phosphate (NAD(P)), and centrifuged at 500 rpm for 2 minutes. The resulting supernatant was analyzed for 2-deoxyglucose-6-phosphate (2-DG6P) content by a microplate reader at 412 nm (Das, Rome, Italy). Lysates of cells not exposed to 2-DG were analyzed to obtain the blank value. Data are expressed as nanomoles of 2-DG. Authentic 2-DG6P was used as a standard. Experiments were performed three times using three replicates for each experimental condition.
Immunoblot Analysis
Cell pellets were lysed in lysis buffer containing 1% (v/v) Triton X-100, 0.1% (w/v) sodium dodecyl sulfate (SDS), and protease inhibitors at standard concentrations; lysates were centrifuged for 10 minutes at 1,500 rpm to remove nuclei and unbroken cells. The protein concentration was determined using the Bradford protein assay reagent according to the manufacturer's protocol (Bio-Rad Laboratories, Hercules, CA). Equal amounts of protein (60 μg) were separated by 10% (w/v) SDS-polyacrylamide gel electrophoresis (PAGE) and transferred to polyvinylidene fluoride (PVDF) membranes. The membranes were incubated with 5% (v/v) milk in PBS–Tween 20 for 1 hour at room temperature to block nonspecific binding, with primary antibodies (anti-GLUT1 polyclonal antibody, Abcam Ab32551; anti-GLUT2 rabbit polyclonal sc-9117, anti-GLUT3 mouse monoclonal sc-74497, anti-GLUT4 mouse monoclonal sc-53566, anti–glyceraldehyde 3-phosphate dehydrogenase [GAPDH] monoclonal antibody sc-47724, Santa Cruz Biotechnology, Dallas, TX; anti–hexokinase II rabbit polyclonal C6465 2867S, Cell Signaling Technology, Beverly, MA) overnight at 4°C and, subsequently, with secondary antibodies (goat antimouse horseradish peroxidase conjugate, 170-6516 Bio-Rad Laboratories) for 1 hour at room temperature. Immunoreactive bands were visualized by enhanced chemiluminescence (Clarity Western ECL Substrate, Bio-Rad Laboratories).
Cytotoxicity Assay
To determine [18F]FDG cytotoxicity in labeled cells, 1 × 10 5 cells were stained with 5 μL of annexin V and 5 μL of 7-amino***actinomycin-D (7-AAD) using the fluorescein isothiocyanate (FITC) annexin V/7-AAD kit according to the manufacturer's protocol (Beckman Coulter, Milan, Italy). Positive cells were evaluated by cytouorimetric analysis using the automated benchtop flow cytometry system FACSCalibur (Becton Dickinson, Franklin Lakes, NJ). Positive staining for annexin V and double staining for annexin V and 7-AAD were interpreted as signs of early and late phases of apoptosis, respectively.15,16
Statistical Analysis
One-way analysis of variance (ANOVA) and Tukey multiple comparison tests were used to establish the statistical significance between different levels of glucose uptake in tumor cell lines and immortalized fibroblasts. The paired Student t-test was used to establish the statistical significance between apoptotic levels in each cell line in the presence and absence of [18F]FDG.
The statistical correlations between [18F]FDG uptake as measured by PET (kBq/mL) or autoradiography and 2-DG uptake as measured by colorimetric assay were calculated by the Pearson correlation test. A Pearson product-moment correlation coefficient (r) of 1 was considered indicative of a perfect linear relationship between variables. Furthermore, a regression coefficient (β) with a related confidence interval (CI) was calculated to estimate the relationships among variables, and the R-squared (R 2 ) coefficient was measured to test how close the data were to the fitted regression line. A Bland-Altman plot was used to analyze the agreement between different assays, calculating the difference mean and standard deviation. A p value < .05 was considered statistically significant.
Results
FDG Uptake by Normal and Cancer Cell Lines
To establish a PET methodology to measure [18F]FDG uptake in vitro, we used a panel of different tumor cell lines derived from human colon (HCT116, HT29, and CaCo2 cells) and breast (MCF7 cells) carcinomas and immortalized normal mouse fibroblasts (NIH-3T3 cells) grown in standard conditions and maintained in the log phase. Autoradiography was used to confirm [18F]FDG incorporation by cells, as determined on the PET scan, and 2-DG uptake was evaluated by colorimetric assay in the same cell cultures as a comparative method.
Before evaluating glucose uptake, cells were depleted of glucose by incubation in a glucose-free medium, and subsequently, [18F]FDG or 2-DG uptake was evaluated after the incubation of cell lines in the presence of 1 MBq [18F]FDG or 10 mM 2-DG. Glucose uptake data were normalized according to total cell numbers and are reported in Figure 2. Indeed, PET detected clear differences in [18F]FDG incorporation between different tumor and normal cell lines, as shown by color-based images (red scale range) (see Figure 2A) and quantitative uptake data (see Figure 2B). It should be noted that [18F]FDG incorporation expressed as kBq/mL was comparable to radiotracer uptake expressed as SUVmax or SUVmean (see Figure 2B). The comparative analysis of glucose uptake by autoradiography ([18F]FDG) and colorimetric (2-DG) assays showed comparable profiles of glucose incorporation in the panel of tumor and normal cell lines (see Figure 2, C and D). Specific differences between the three methods are evident: (1) a higher statistical correlation was observed between glucose uptake values measured by PET (kBq/mL) and autoradiography (Figure 3A) with minimally divergent data (Pearson correlation test, p < .01, r = .98; R 2 = .974; β = 0.84, CI 0.58–1.06) and negligible standard deviations (Figure 3B), and (2) a less stringent statistical significance was observed between PET and colorimetric assay data (Figure 3C) (Pearson correlation test, p < .05, r = .91; R 2 = .83; β = 6.21, CI 1.06–11.04), with a more pronounced discordance between uptake values and higher standard deviations (Figure 3D). These differences are most likely due to the lower capacity of the photometric assay to emphasize minimal differences in glucose incorporation between different cell lines. Indeed, PET and autoradiography detected statistically significant differences in radiotracer uptake between tumor cell lines (Table 1, Tukey multiple comparison test), whereas the colorimetric assay failed to highlight the vast majority of these metabolic differences between the same tumor cell lines, being only able to detect significant differences between tumor cells and mouse fibroblasts (see Table 1).
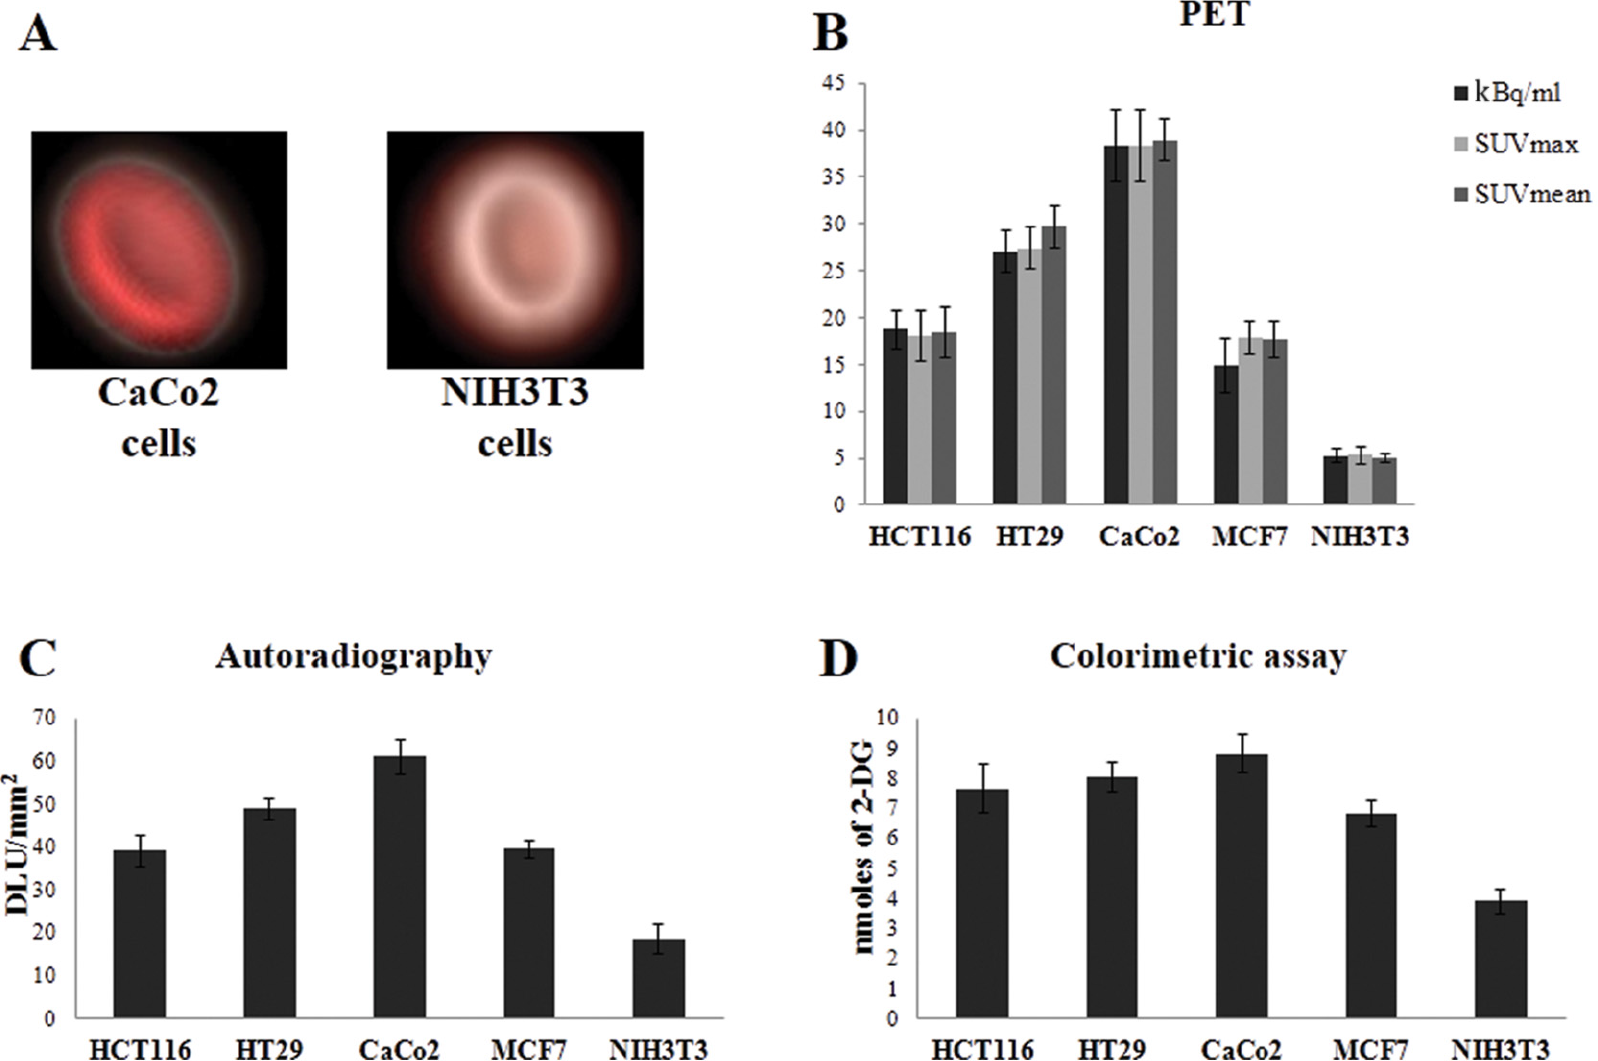
[18F]FDG and 2-DG uptake by normal fibroblasts and cancer cell lines. (A) Positron emission tomography (PET) three-dimensional images representative of [18F]FDG uptake (red color range) in cell culture plates with tumor (CaCo2 cells) and normal (NIH3T3 cells) cell lines. (B) Cells in the log phase were incubated with 1 MBq [18F]FDG in a glucose-free medium and the amount of radiotracer retained in the cells was measured by PET scan, normalized according to the amount of radiotracer added in the medium and total cell numbers and expressed as kBq/mL, SUVmax, and SUVmean (see Methods). Data represent the average (± SD) of three independent experiments, each performed in triplicate. (C) Cells were cultured as in panel (A) and [18F]FDG accumulation was detected by autoradiography and expressed as digital light units per square centimeter (DLU/mm2) (± SD). (D) Cells in the log phase were incubated with 10 mM 2-DG in Krebs-Ringer-phosphate-HEPES buffer; the amount of 2-DG6P was measured by a microplate reader. Data represent the average (± SD) of three independent experiments, each performed in triplicate.
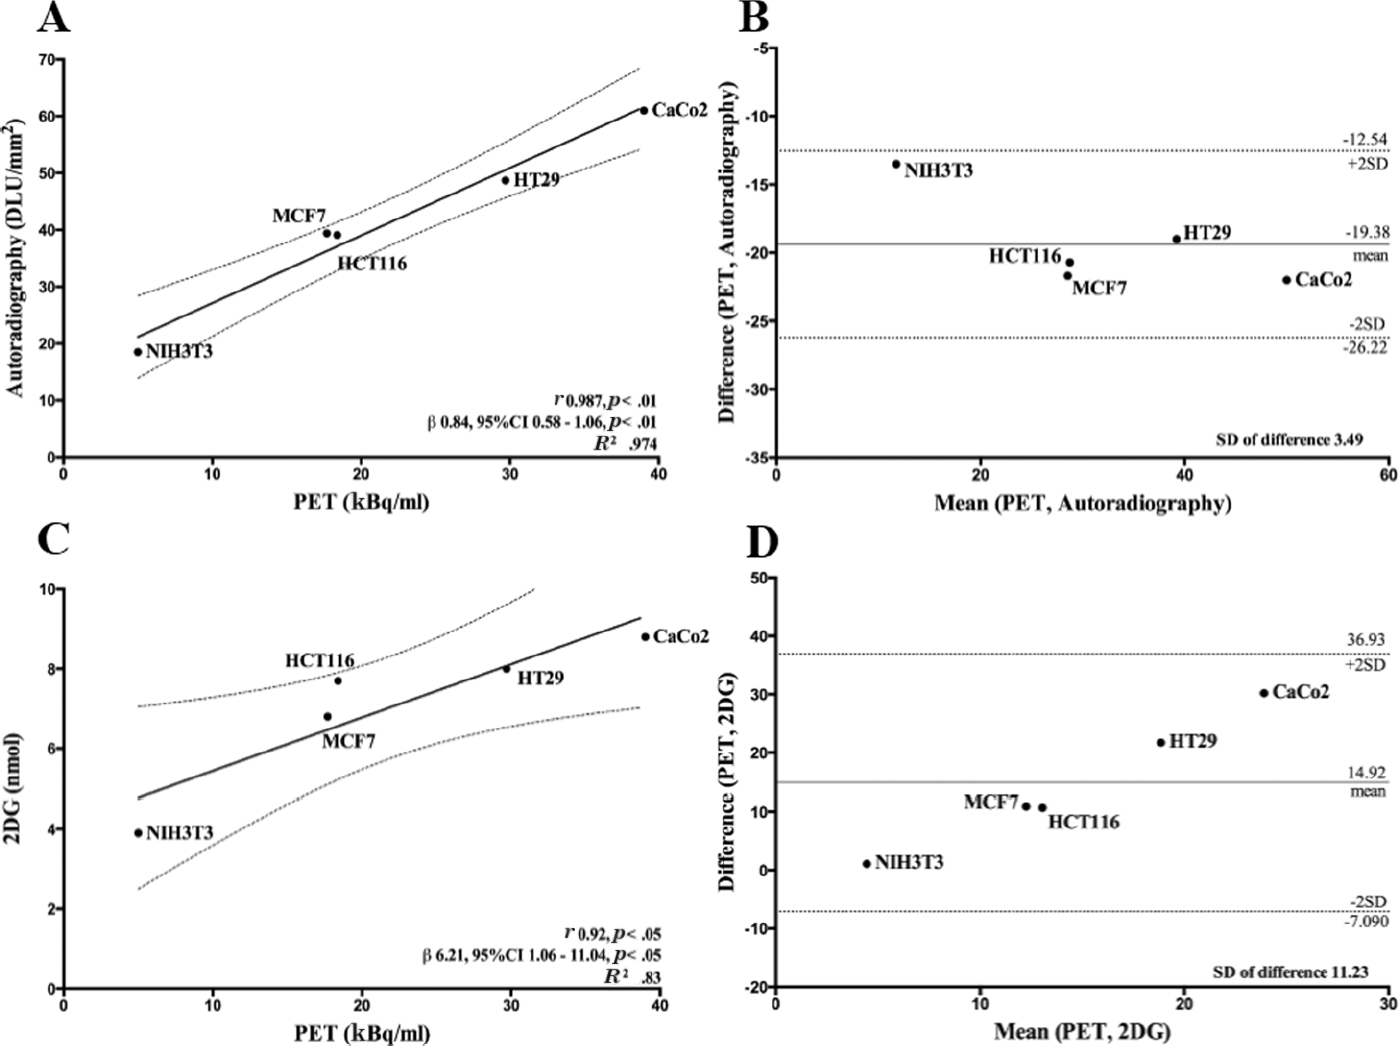
Statistical correlations and agreements between [18F]FDG uptake by positron emission tomography (PET) and [18F]FDG/2-DG uptake by autoradiography or colorimetric assay. Scatter plots (A and C) and Bland-Altman plots (B and D) of [18F]FDG uptake as measured by PET (kBq/mL) and autoradiography (A and B) or [18F]FDG uptake (kBq/mL) as measured by PET and 2-DG uptake as measured by colorimetric assay (C and D); p and r values were calculated by the Pearson correlation test. R2, regression coefficient (β) and related confidence interval (CI) were calculated using the linear regression method. The mean difference (or estimated bias) was calculated for Bland-Altman analysis, and the standard deviation (SD) of difference was used to identify possible outliers.
Correlation Between [18F]FDG Uptake by PET and GLUT Expression
Because PET enhanced the differences in [18F]FDG uptake between all the tested cell lines (see Table 1), we further evaluated whether these differences were specific for glucose and representative of biologically relevant metabolic differences between tumor cell lines and mouse fibroblasts. Thus, CaCo2 colon carcinoma cells and mouse fibroblasts were evaluated for the incorporation of radioactive iodine, which is known to be transported into the cell through a different carrier than glucose. 17 Interestingly, no major differences in 123I uptake were observed between CaCo2 cells and mouse fibroblasts (data not shown), thereby suggesting that glucose uptake measured by PET is representative of a glucose-specific transport mechanism.
In parallel experiments, the panel of tumor cells and mouse fibroblasts was analyzed for the expression of GLUTs 1 to 4 and hexokinase II. GLUTs are a family of membrane glycoproteins responsible for constitutive glucose uptake, and a portion of them are upregulated in several cancer cell models18,19; hexokinase is the first enzyme of the glycolytic pathway responsible for catalyzing the phosphorylation of glucose to yield glucose 6-phosphate, thereby maintaining the downhill concentration gradient that favors the transportation of glucose into cells. 20 Interestingly, colon and breast tumor cell lines showed higher levels of GLUTs 1 to 4 and hexokinase II compared to mouse fibroblasts (Figure 4A). These data are consistent with the higher capacity of colon and breast carcinoma cell lines to retain glucose compared to normal fibroblasts and support the notion that [18F]FDG uptake measured in living cells by PET and autoradiography is representative of the molecular profile of each cell line.
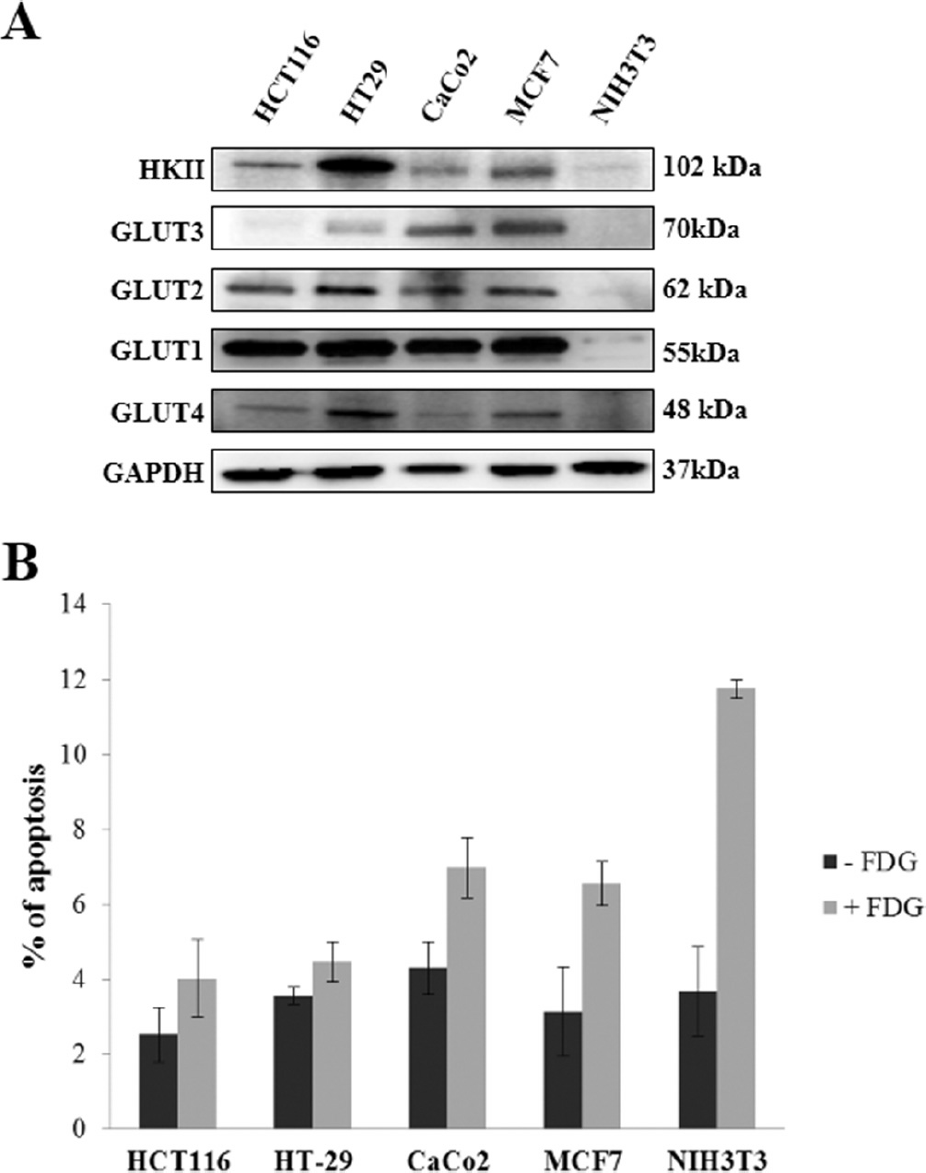
Glucose transporters (GLUTs) 1 to 4/hexokinase II (HKII) expression and radiotoxicity of [18F]FDG labeling in tumor and normal cell lines. (A), Immunoblot analysis of GLUTs 1 to 4 and hexokinase II expression in colon HCT116, HT29, and CaCo2 and breast MCF7 carcinoma cells and NIH3T3 mouse fibroblasts. (B), Apoptotic levels in colon HCT116, HT29, and CaCo2 and breast MCF7 carcinoma cells and NIH3T3 mouse fibroblasts after labeling with [18F]FDG, measured as a percentage of annexin V–stained cells. Data represent the average (± SD) of three independent experiments, each performed in triplicate. GAPDH = glyceraldehyde 3-phosphate dehydrogenase.
Statistical Significance of Glucose Uptake Differences in Tumor Cell Lines and Immortalized Mouse Fibroblasts (as represented in Figure 2)

2-DG = 2-deoxyglucose; NS = not significant; PET = positron emission tomography.
Tukey multiple comparison test was used to evaluate differences among cell lines. For each assay, mean differences and statistical significance (p) were calculated. A p value < .05 was considered statistically significant.
Determination of Tracer Radiotoxicity
The effect of radiolabeling with [18F]FDG on cell viability was analyzed by evaluating apoptotic cell death in labeled versus unlabeled cells. Tumor cell lines labeled with [18F]FDG and stained for annexin V showed minimal and statistically not different levels of apoptosis compared to their respective unlabelled controls; normal mouse fibroblasts exhibited slight but statistically significant increases in levels of apoptotic cell death on incorporation of [18F]FDG (p = .011; Figure 4B).
Discussion
There is an extensive body of literature on the use of PET for in vivo research and diagnostics. This technique produces three-dimensional images of functional processes in the body and is applied in diagnostics and different areas of research21,22; however, limited comparative evidence has been reported concerning [18F]FDG uptake by PET and other standard technologies to detect glucose uptake in vitro, although a linear relationship was described between [18F]FDG uptake measured by PET in vitro and the number of cells, with the detection limit of PET falling in the magnitude of 10 5 to 10 6 malignant cells. 12 In this study, we compared glucose uptake in living cells by PET, autoradiography, and colorimetric assays, three methods that are extremely dissimilar in terms of their technological complexity, feasibility, and costs. The comparative data show a direct correlation between [18F]FDG incorporation by PET and [18F]FDG or 2-DG uptake by autoradiography or colorimetric assays (see Figure 3), which are known to be traditional and standardized technologies for assessing glucose incorporation by cells. 23 However, radiolabeled glucose detection with PET and autoradiography in cell cultures provided a better signal to noise ratio compared to photometric assays for 2-DG uptake as PET and autoradiography were able to emphasize the differences in glucose uptake between different tumor cell lines that were, by contrast, underestimated by the photometric assay (see Figure 2). Indeed, detection methods based on [18F]FDG showed statistically significant differences between breast and colon tumor cell lines that were not evident on 2-DG evaluation by the colorimetric assay (see Table 1); furthermore, the comparison of PET and photometric data exhibited wider standard deviations with respect to autoradiography and PET data (see Figure 3). Thus, this evidence suggests a higher detection capacity of methods based on radioactive tracers with respect to the more feasible and less costly colorimetric assay. It should be noted, however, that the experimental conditions used for the evaluation of [18F]FDG by PET and autoradiography are slightly different from those used for 2-DG uptake assessment as [18F]FDG incorporation was performed under cell suspension conditions to reduce the nonspecific background, whereas 2-DG uptake was evaluated in standard adherent cell cultures. Thus, it is not possible to rule out the hypothesis that the higher differences in glucose uptake observed under [18F]FDG-based methods are dependent on these anchorage-independent conditions. It is also important to note, however, that the same anchorage-independent conditions did not produce significant apoptotic rates in either the absence or presence of [18F]FDG in tumor cell lines, whereas they induced minimal apoptosis in mouse fibroblasts incubated with [18F]FDG, with the vast majority of the cell population remaining alive and capable of incorporating glucose. These differences in apoptosis between normal and cancer cells are likely representative of the higher apoptotic threshold of tumor cells with respect to mouse fibroblasts. 24 Indeed, annexin V staining detects the externalization of phosphatidylserine from the inner to the outer leaflet of the plasma membrane as an early event in the apoptotic cascade of downstream cytochrome C release from mitochondria. 25 Thus, the activation of anti***apoptotic pathways in tumor cells is most likely responsible for inhibition of phosphatidylserine externalization and lower apoptotic cell death on the incorporation of radioactive glucose.
A relevant issue that must be discussed is the usefulness of PET with respect to autoradiography for in vitro studies. From this perspective, the technological complexity and higher costs represent a clear weakness for using PET in these types of studies, which is likely the reason why autoradiography is widely considered a standard technology for metabolic studies. 26 It is important to note, however, that there is a growing body of evidence that PET semiquantitative assessment of tumor-specific [18F]FDG variability and avidity predicts tumor aggressiveness, response to therapy, and even patient outcomes in several human malignancies. 27 In such a scenario, this study provides evidence that semiquantitative PET imaging, routinely used in diagnostics, can be implemented for cancer cell metabolic studies and may represent an experimental technology for relocating this information on a cellular basis. The availability of a reversible and bidirectional technology (two-way track) may reinforce the translational approach to cancer, especially when animal facilities and/or microPET are lacking, thus implementing metabolic studies on tumor cell lines using a methodology routinely used in diagnostics. In this context, novel molecular agents targeting metabolic pathways or glucose uptake mechanisms are under preclinical and clinical evaluation as anticancer agents. 12 Thus, the improvement in new methods to study tumor metabolism in vitro is crucial to estimate the biological activity of novel metabolic therapeutics. PET-based assays in cultured cell lines may represent a valuable technology to monitor the activity of these agents, with the hope of ultimately implementing these studies in animal models and humans, bridging the gap between promising in vitro concepts and their clinical application. Furthermore, (1) comparative analysis of [18F]FDG with novel radiotracers; (2) evaluation of the metabolic responses of tumor cell lines to environmental stimuli or stresses; and (3) comparative analysis of tumor cell subpopulations bearing specific mutations are further potential fields of in vitro PET application with the potential to compare the results obtained from cell cultures with data provided by the same technology in animal tumor models and humans. Thus, this study validates a PET-based method for [18F]FDG detection in cultured cell lines as a proof of concept that PET represents a sensitive and reliable technology for detecting glucose uptake in living normal and transformed cell cultures.
Finally, to the best of our knowledge, this study provides the first evidence that the radioactive signal detected by PET, on cell cultures supplemented with [18F]FDG, is consistent with biological markers of glucose metabolism, an issue that has been extensively demonstrated for in vivo tumor cell models. 28 Indeed, the differences in [18F]FDG uptake detected by PET in vitro reflect the differences in GLUT and hexokinase II expression in tumor and normal cell lines (see Figure 4A). GLUTs are specific carriers of D-glucose and/or related hexoses and catalyze the energy-independent bidirectional transport of their substrates across membranes. 29 Because activated glucose transport is considered to be characteristic of cancer cells 4 and because a significant correlation between GLUT expression and [18F]FDG uptake by PET has been reported in solid tumors, 30 our data clearly suggest that the [18F]FDG signal detected by PET in cell lines is specific for glucose uptake and representative of the increased glucose metabolism of cancer compared to normal cell lines. It is important to note, however, that the upregulation of GLUTs or hexokinase II is not the only mechanism responsible for the enhanced glucose uptake of tumor cells and that additional mechanisms are most likely responsible for the differences in glucose uptake observed in our panel of cancer cell lines, as already established by a large body of literature. 31
Footnotes
Acknowledgments
We wish to thank Mrs. A. Di Leo, Mrs. N. D'Errico, and Mrs. A. Piccolella for their valuable and indispensable technical contribution in performing the studies.
Financial disclosure of authors: This work was supported by the Associazione Italiana per la Ricerca sul Cancro (AIRC) (Grant IG13128 to M.L.) and the Italian Ministry of Health (Grant GR-2010-2310057 to F.M.).
Financial disclosure of reviewers: None reported.