
Abstract
Our goal was to identify suitable image quantification methods to image 5-hydroxytryptamine2A (5-HT2A) receptors in vivo in Mdr1a knockout (KO) rats (i.e., P-glycoprotein KO) using 123I-R91150 single-photon emission computed tomography (SPECT). The 123I-R91150 binding parameters estimated with different reference tissue models (simplified reference tissue model [SRTM], Logan reference tissue model, and tissue ratio [TR] method) were compared to the estimates obtained with a comprehensive three-tissue/seven-parameter (3T/7k)-based model. The SRTM and Logan reference tissue model estimates of 5-HT2A receptor (5-HT2AR) nondisplaceable binding potential (BPND) correlated well with the absolute receptor density measured with the 3T/7k gold standard (r > .89). Quantification of 5-HT2AR using the Logan reference tissue model required at least 90 minutes of scanning, whereas the SRTM required at least 110 minutes. The TR method estimates were also highly correlated to the 5-HT2AR density (r > .91) and only required a single 20-minute scan between 100 and 120 minutes postinjection. However, a systematic overestimation of the BPND values was observed. The Logan reference tissue method is more convenient than the SRTM for the quantification of 5-HT2AR in Mdr1a KO rats using 123I-R91150 SPECT. The TR method is an interesting and simple alternative, despite its bias, as it still provides a valid index of 5-HT2AR density.
THE 5-HYDROXYTRYPTAMINE 2A (5-HT2A) receptors (5-HT2ARs) have been involved in the regulation of neuropsychological functions such as sensorimotor gating 1 and impulsivity, 2 as well as in disorders such as depression,3–5 anxiety, 6 obsessive-compulsive disorders, 7 autism, 8 and schizophrenia. 9 Nowadays, nuclear imaging is gaining considerable attention in the field of neuropsychiatry as a means of noninvasively studying the relationship between specific behavioral traits and the regional biochemical state of specific neurotransmitter pathways, in terms of receptor occupancy 10 or receptor density. 11 The 123I-R91150 radioligand 12 has been used in single-photon emission computed tomography (SPECT) studies to measure 5-HT2AR binding in baboon, 13 humans,14,15 and dogs. 16 Nowadays, the advent of dedicated small animal SPECT scanners has enabled the imaging of rodents for the preclinical study of human diseases. However, the quantification of neuroreceptors in vivo with SPECT requires a validation of the image analysis methods in the considered animal model before conducting routine studies. 17 Moreover, it has been demonstrated that the SPECT imaging of 5-HT2AR using 123I-R91150 was more amenable in a mutant rat strain, being deficient for the MDR1A transporter (also known as P-glycoprotein, or Pgp), which otherwise significantly reduces 123I-R91150 brain availability. 18
Thus, the main goal of this study was to validate the use of reference tissue methods for the quantification of 5-HT2AR with 123I-R91150 SPECT in this particular Mdr1a knockout (KO) rat strain. Multi-injection protocols 19 were used to identify the pharmacokinetic parameters of a comprehensive model of the 123I-R91150 tracer in vivo distribution (Figure 1). The parameter estimates obtained with this pharmacokinetic model, such as the available receptor density (Bavail) or tracer binding potential (BP), may be employed as gold standards to validate the use of simpler receptor quantification protocols, 17 the latter being more appropriate for routine use. Thus, the receptor density estimates of reference tissue methods such as the simplified reference tissue model (SRTM), 20 Logan reference tissue model, 21 and tissue ratio (TR) method 22 were compared to the multi-injection approach. Moreover, denoising of the dynamic data with factor analysis (FA)23,24 was investigated as a means of improving the accuracy of these methods. Finally, the ability of these methods to detect a modification of 123I-R91150 nondisplaceable binding potential (BPND) was evaluated by artificially increasing the 5-HT2AR density using an adenoviral expression vector.

Schematics of the three-tissue seven-parameter-based model used for pharmacokinetic modeling with the multi-injection protocol. The model at the top describes the kinetics of the radioligand (quantities denoted with a star). The bottom part shows the same model for the unlabeled ligand. Parameters K1 and k2 are associated with the exchanges between the plasma compartment (Cp(t)) and free ligand in tissue compartment (CFT(t)); Bavail represents the concentration of receptors available for binding; kon and koff are the association and dissociation rate constants, respectively; VR is the volume of reaction, which accounts for tissue inhomogeneities; and k5 and k6 are the rate constants associated with nonspecific binding (CNS(t)).
Material and Method
Animals
Ten male Sprague Dawley Mdr1a KO rats (SD-Abcba1tm1sage, Sigma Advance Genetic Engineering Labs, Boyertown, PA) 25 weighing 390 ± 90 g (mean ± SD) were employed for dynamic SPECT acquisitions and metabolite studies (Table 1). The Mdr1a-deficient animals are homozygous KOs and were housed under controlled 12-hour light/12-hour dark cycles, with water and food ad libitum. When blood sampling was required, the anesthesia was started 60 minutes prior to tracer injection for the implantation of catheters (rats 1–9; see Table 1). Polyethylene catheters (inner diameter = 0.58 mm, outer diameter = 0.96 mm) were inserted into the left femoral vein for radiotracer injection and the left femoral artery for blood sampling. All surgical and experimental procedures were performed in accordance with Swiss federal law on animal care, under a protocol approved by the Ethical Committee on Animal Experimentation of the Canton of Geneva, Switzerland.
Summary of Dynamic SPECT and Metabolite Study Experiments
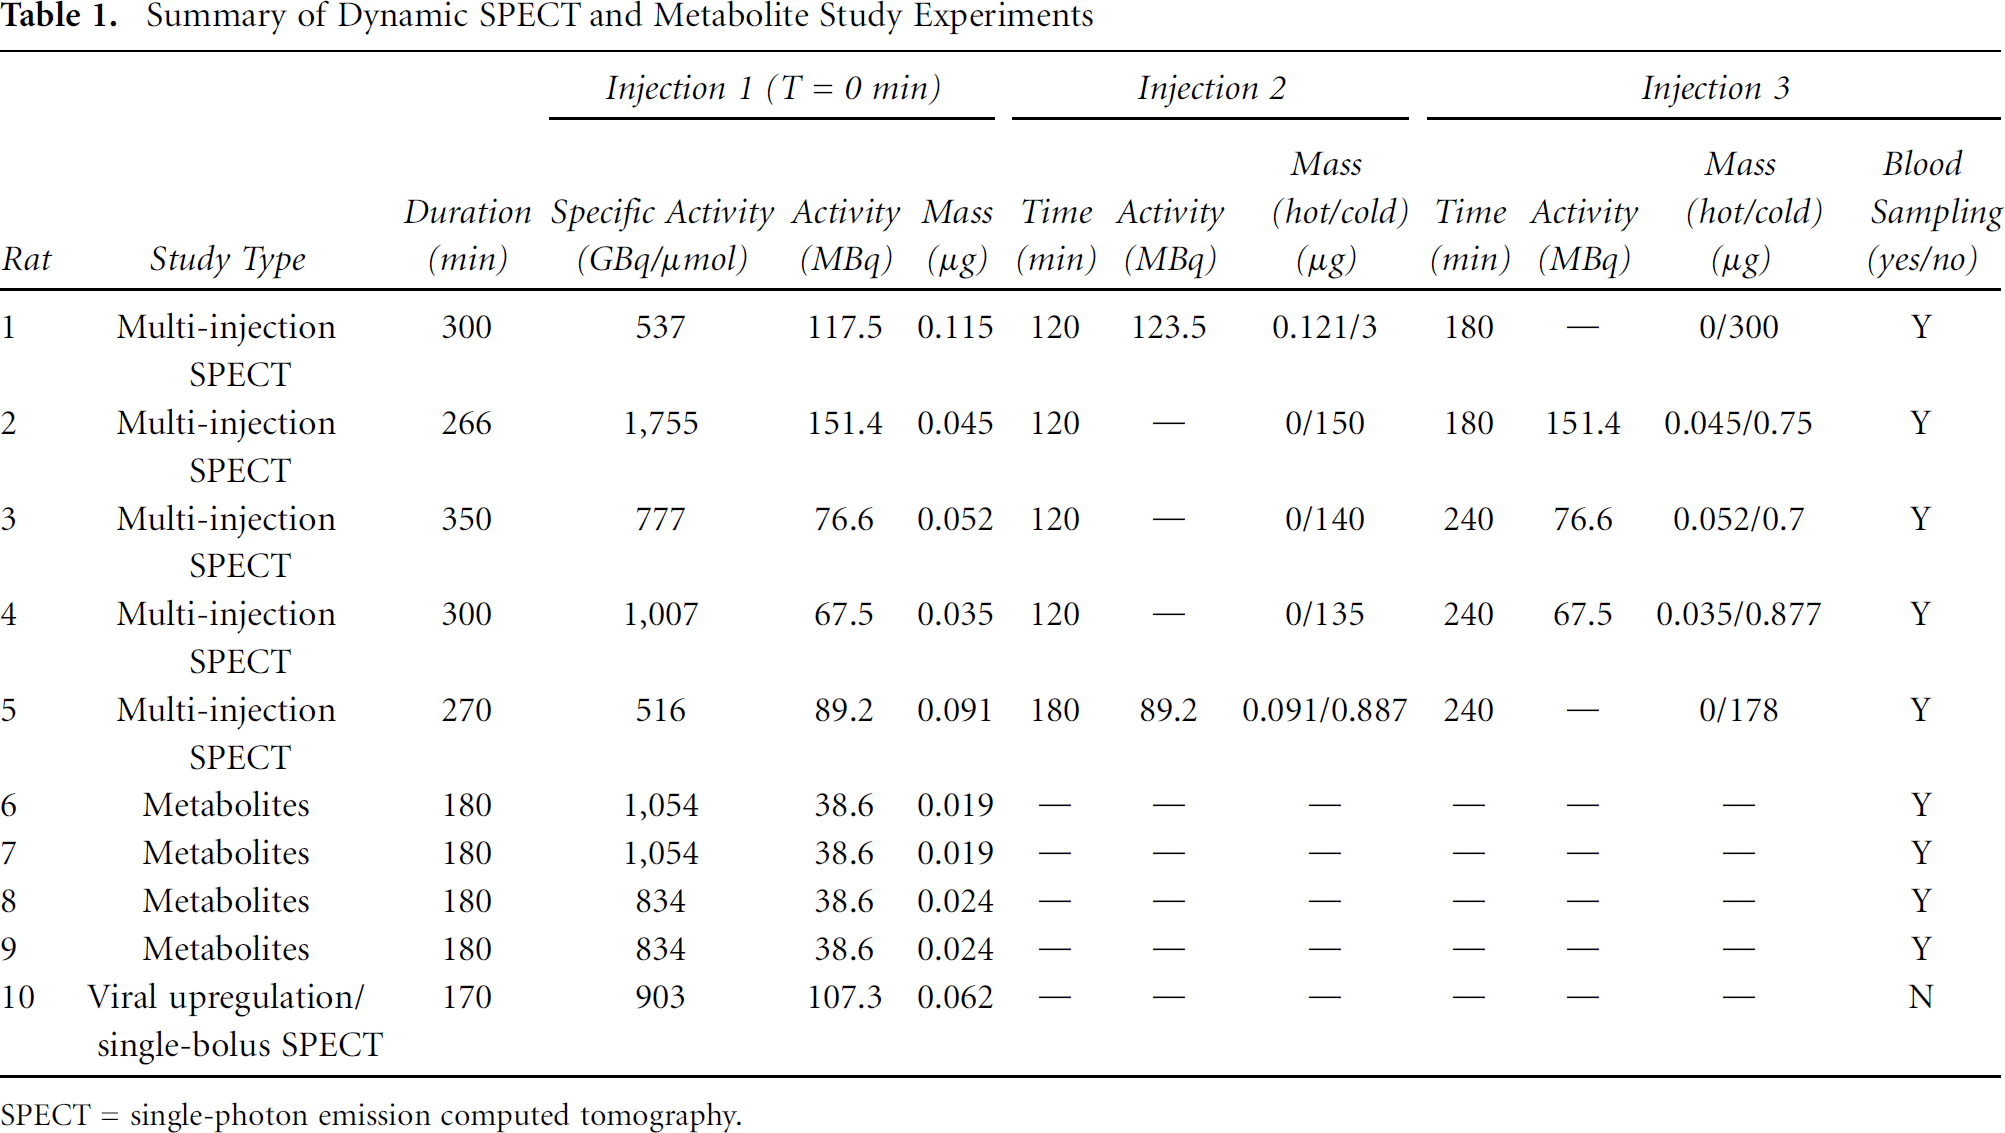
SPECT = single-photon emission computed tomography.
Chemicals and Radiochemicals
123I radioiodide was purchased from GE Healthcare (Eindhoven, the Netherlands). R91150 precursor synthesis and subsequent radiolabeling procedure were conducted as previously described. 18 Briefly, 123I-R91150 was obtained by incubation, for 20 minutes at room temperature, of a mixture containing 300 μg of R91150 precursor (4-amino-N-{1-[3-(4-fluorophenoxy)propyl]piperidin-4-yl}-2-methoxybenzamide) in 3 μL ethanol with 3 μL glacial acetic acid, 15 μL carrier-free 123I sodium iodide (10 mCi) in 0.05 M NaOH, and 3 μL of 30% H2O2. 123I-R91150 was isolated from the reaction mixture by an isocratic high-performance liquid chromatography (HPLC) run (Knauer GmbH, Berlin, Germany; acetonitrile (ACN)/water 50/50, 10 mM acetic acid buffer pH 5) on a reversed-phase column (Bondclone C18 10 μm 300 × 7.8 mm, Phenomenex, Schlieren, Switzerland) at a flow rate of 3 mL/min. The measurement of specific activity (SA) was performed thanks to calibration curves established with the cold reference compound. All other chemicals were purchased from Sigma-Aldrich (Buchs, Switzerland) with the highest purity available and were used without any further purification.
Dynamic SPECT Experiments
The animals were anesthetized with 4% isoflurane in O2 and placed in a microSPECT/CT imaging system (NanoSPECT/CT, Bioscan, Washington, DC). Anesthesia was maintained with 2.5% isoflurane in O2 during the SPECT scans, and body temperature was maintained at 37 ± 1°C using a temperature-controlled heating pad. For the multi-injection protocol, the animals received femoral vein injections of the tracer at different SAs (see Table 1). All the injections were administered over 1 minute, in a 0.6 mL volume, using an infusion pump. The displacement injection was performed following either the high-SA or the low-SA injection. Neither of these two options turned out to yield more accurate parameter estimates than the other, as assessed by the standard deviations, which were not significantly different (analysis of variance [ANOVA] F(1.384) = 0.885; p = .703). The imaging system was equipped with four gamma cameras fitted with APT5 collimators (nine pinholes of 1.5 mm diameter per head, 60 × 24 mm intrinsic field of view). After each injection, image frames of 2 minutes were recorded for 1 hour, followed by 10-minute image frames until the next injection or the end of the scan. X-ray computed tomography (CT) was performed at the end of the SPECT scans to provide anatomic reference. Additionally, a phantom consisting of a 2 mL plastic tube containing a known activity concentration was scanned with SPECT/CT under the same conditions for the purpose of realignment between SPECT and CT as well as activity calibration. SPECT and CT tomograms were reconstructed with an ordered-subsets expectation maximization algorithm using HiSPECT software (SciVis GMBH, Göttingen, Germany). SPECT data were corrected for radioactive decay; no correction of attenuation and scatter was applied.
Input Function and Metabolite Measurement
During dynamic SPECT acquisitions (rats 1–5; see Table 1), 25 μL arterial blood samples were drawn at regular time intervals and immediately centrifuged (3,000g, 5 minutes). Plasmatic radioactivity was measured with a gamma counting system to yield plasmatic time-concentration curves. This way, only the whole plasmatic activity concentration was measured; the proportion of activity due to radiometabolites was not measured for each individual experiment but was obtained from an independent set of experiments, as described by Millet and colleagues. 23 Metabolites were analyzed in four rats; the tracer-injected quantities and specific activities are given in Table 1. Fifteen arterial blood samples were drawn between 0 and 180 minutes after radioligand injection. All samples were treated using a procedure adapted from Catafau and colleagues and Blanckaert and colleagues.14,26 Arterial blood (400 μL) was collected in heparinized tubes and centrifuged for 3 minutes at 3,000g, and plasma was subsequently separated from the pellet. Plasma (200 μL) was mixed with acetonitrile (500 μL). The mixture was vortexed for 10 seconds and then centrifuged for 3 minutes at 3,000g. The liquid phase was dried using a rotary evaporator (Concentrator plus, Eppendorf, Basel, Switzerland) and dissolved in methanol (100 μL). Then 10 μL aliquots of the concentrated fractions were spotted onto aluminum-backed silica gel plate (Fluka, Seelze, Germany), and an aliquot of 123I-R91150 was also spotted as a reference. The thin layer chromatography (TLC) plates were developed in a dichloromethane/methanol mixture (88/12 with 5% triethylamine). After development, the TLC plates were dried at room temperature and exposed for 30 minutes to a phosphor imaging screen (BAS-IP MS2325, Fuji Photo Film Co., Ltd., Tokyo, Japan), along with samples of all plasma and methanol extracts, as well as a standard of different activity concentrations for calibration purpose. The radioactivity distribution on the plate, corresponding to unchanged 123I-R91150 and its metabolites, was visualized with a Fujifilm BAS-1800 II phosphorimager system and Image Reader v2.02 software (Raytest Isotopenmessgeräte GmbH, Straubenhardt, Germany). The obtained autoradiographic images were analyzed using Aida software V4.06 (Raytest Isotopenmessgeräte GmbH). The mean percentage of nonmetabolized 123I-R91150 in plasma (Pnm) was fitted using a triexponential model to obtain the following An and Bn parameters: Pnm(t) = A1*e−B1·t + A2*e−B2·t + A3*e−B3·t. To estimate jointly the pharmacokinetic model parameters and the metabolite correction model, a coupled fitting procedure was performed on a group of eight regions of interest (ROI) (orbitofrontal cortex, primary motor cortex, accumbens nucleus, parietal associative cortex, posterior hippocampus, midbrain, ventral tegmental area, and cerebellum), to adjust the mean metabolite parameters, as described by Millet and colleagues. 27 During the coupled curve fit, a parameter was added to the time variable in the Pnm(t) equation to account for a possible time shift between measured plasmatic kinetics and brain region kinetics. The 3T/7k model parameters were then estimated in each ROI using the adjusted and fixed metabolite parameter values. The free tracer plasmatic fraction (fp) was measured by gel filtration of plasma samples spiked with 0.37 MBq of 123I-R91150, on a Bio-Trap 500 MS column (Chrom Tech, Apple Valley, MN) with phosphate-buffered saline followed by elution with 50% ACN/10 mM AcOH buffered at pH 5. The free and metabolite-corrected plasmatic input function (Cp) was obtained by multiplying the total plasmatic activity (CTotal) with the nonmetabolized fraction (Pnm) and the free fraction (fp).
Receptor Quantification Methods
The dynamic SPECT images were first averaged over 120 minutes after the first injection to allow their manual coregistration to a magnetic resonance imaging (MRI) template of the rat brain using PMOD software version 3.4 (PMOD Technologies Ltd, Zurich, Switzerland). Time-activity curves (TACs) were extracted from dynamic images using the ROI defined in a rat brain atlas. 28 Parametric curve fitting on the TAC data was performed with the PMOD software for the SRTM and Logan reference tissue model or with custom MATLAB R2010b codes for the multi-injection approach. The Logan BPND were estimated with the “Logan noninvasive” model in the PMOD software: average k2’ were estimated with the SRTM, and t* was automatically determined by the software, based on the maximum relative error allowed during the steady phase, which was fixed at 10%. A 3T/7k-based model (see Figure 1) was used to analyze the time-concentration curves obtained with the multi-injection approach.19,29 The free, unchanged 123I-R91150 concentration measured in plasma was used as the input function. The vascular fraction of brain tissue was assumed to be 5%. 27 Only the SPECT data recorded following the first high-SA injection were used for analysis using reference tissue methods. The TACs recorded in the cerebellum gray matter ROI were used as the input functions to the SRTM and Logan reference tissue model, yielding BPND SRTM and BPND Logan estimates, respectively. Regional BPND were also estimated with the TR method: the specific uptake ratios (SURs) were calculated as the ratio of activity in target versus cerebellum gray matter ROI minus 1. 14 The time window yielding the highest correlation between the SUR and multi-injection Bavail estimates was identified by interpolating the SUR-time curve of all the individual dynamic SPECT experiments and then by computing the correlation coefficient of all possible time intervals with Bavail. The stability of BPND estimates obtained with the Logan reference tissue method and SRTM was examined over scan durations ranging from 40 to 120 minutes postinjection, thanks to experiments 1 to 5 (see Table 1). Both the raw and FA denoised data were analyzed to determine the minimum scan duration yielding stable BPND estimates.
The total and nondisplaceable distribution volumes were respectively calculated as VT = K1/k2*(1 + kon/VR/koff + k5/k6) and VND = K1/k2*(1 + k5/k6) using the 3T/7k parameters. These distribution volumes allowed the estimation of BPND as (VT/VND)-1 or with cerebellar VT as an estimate of all other ROI VND.
FA Denoising
FA denoising of dynamic images was performed using Pixies software (Apteryx, Issy-les-Moulineaux, France). FA allows the identification of distinct components in correlated data series such as dynamic SPECT data. 30 This way, dynamic images can be described by a combination of factors, which have a weighted spatial distribution throughout the image volume, and an error term accounting for both noise and modeling errors. It has been shown that the pharmacokinetics of radiotracers could be summarized with only three of these factors23,24 as the other factors contain essentially noise and can thus be removed to filter the dynamic data. In this study, data filtered with FA were compared with unfiltered data thanks to data simulations to ensure that no significant bias was introduced on the quantification of the biological target. The simulated dynamic SPECT images were generated with the model parameters estimated using the multi-injection approach in one individual rat (see Table 1, rat 3). These parameters were assigned to their respective atlas ROI to generate a theoretical dynamic image. The noise level of the experimental TACs was estimated with the relative standard deviation of the residual errors observed during the curve fitting (at most 10% for this experiment). These data were smoothed with a three-dimensional gaussian filter of 0.6 mm full width half-maximum to obtain the noise-free dynamic images. Noise was then added using the following noise model: datanoised = datanoise-free (1 + x(%) Random), where x was 10%, to obtained noised data mimicking real experimental data. The random numbers were generated with a normal distribution of mean 0 and variance 1. The FA procedure was then applied to the simulated noised data, as exposed above, to yield the denoised images. When using the SRTM and Logan approaches on FA denoised data, only SPECT data ensuing from the first tracer injection were employed so as to avoid the integration of information coming from the other injections during the FA denoising step. The noise-free, noised, and FA denoised data were then processed as experimental data to obtain BP estimates using the multi-injection approach, as well as the SRTM and Logan reference method.

(A) Metabolite study: triexponential fit of the nonmetabolized fraction of 123I-R91150 in arterial blood after single-bolus injection, mean of four experiments (see rats 6–9 in Table 1). Representative outcomes of a multi-injection experiment (rat 3): (B) radiotracer input function (line) and total plasmatic activity (dots); (C) cold ligand input function; (D) MRI template with an example of atlas regions of interest; (E) SPECT average images (100–120 minutes after the first injection) with MRI fusion; (F) time-activity curve (dots) and corresponding fits with the 3T/7k-based model (lines) during a multi-injection protocol. Cb = cerebellum; OFC = orbitofrontal cortex; PAC = parietal associative cortex.
Statistical Analysis
Linear regression analysis was used to compare the binding parameters obtained from the simulated dynamic SPECT images before and after FA denoising. Scatter plots were prepared with DataGraph software (Visual Data Tools, Chapel Hill, NC). The significance of the differences observed between correlation coefficients were assessed using Fisher r-to-z transformation. The slopes of the regression lines were compared using the t-test statistic. 31 The brain atlas used in this study contains 58 ROI 28 ; however, the 6 following ROI were excluded from the correlations: the 5 cerebellum ROI were excluded as they were used as the reference tissue for BPND estimations, and the pituitary gland ROI was excluded as this gland is not part of the brain. Moreover, the two frontal cortex ROI were fused to the adjacent orbitofrontal cortex ROI as they gave outlier data points due to their comparatively smaller size than other ROI of this atlas (177 voxels vs 2940 on average), which made them especially sensitive to noise otherwise.
5-HT2A Overexpression Experiment
The ViraPower Adenovirus Expression System (Invitrogen, Zug, Switzerland) was used according to the manufacturer's instructions to generate recombinant adenoviral vectors, as described by Zhang and collagues. 32 After cloning into Gateway system entry vectors (pENTR), the full-length mouse 5-HT2AR coding DNA sequence (CDS) (NCBI Reference Sequence: NM_172812.2) and mouse 5-HT4R CDS (NCBI Reference Sequence: NM_008313.4), including a terminal stop codon, were inserted into pAd/CMV/V5-DEST adenoviral vectors, under the control of cytomegalovirus promotor, by means of LR recombination. All constructs were verified by sequencing. Recombinant adenoviruses were initially produced by transfecting adenoviral constructs into HEK 293A cells using Lipofectamine 2000 (Invitrogen). Around 1 week after lipofection, the cells were harvested and lysed by three freeze/thaw cycles. The lysate was cleared from cell debris with a 15-minute 3,000 rpm centrifugation to obtain a crude viral lysate. The cleared lysate was then used to infect other 293A cell cultures for larger production batches. Finally, the viral particles were purified from the clarified lysate with ultracentrifugation (2 hours, 4°C, 115,000g, SW41 rotor, Beckmann-Coulter, Nyon, Switzerland) on a cesium chloride gradient (1 volume 4 M CsCl under 2 volumes 2.2 M CsCl). The band containing the concentrated viral particles was harvested and dialyzed against 2 × 10 L phosphate-buffered saline (Slide-A-Lyzer Dialysis Cassettes, 10 kDa molecular-weight cutoff, Pierce, Lucerne, Switzerland). The concentrated stocks of 5-HT4 and 5-HT2A receptor–expressing adenoviruses (Ad5-HT4R and Ad5HT2AR) were stored at −80°C until use.
For the 5-HT2AR overexpression experiment, one animal (see Table 1, rat 10) underwent stereotactic viral injections. The animal was anesthetized with 2.5% isoflurane in O2 and preventively treated against postoperative pain with buprenorphine (0.02 mg/kg, 0.5 mL, subcutaneous). Gel moisturizer (Lacryvisc, Alcon, Rotkreuz, Switzerland) was applied on both eyes, and a 2 mm diameter hole was carefully drilled through the skull at the injection site. Two microliters of the Ad5-HT4R (control) and Ad5-HT2AR adenoviral preparations (1010pfu/mL in PBS) were injected in the left and right thalamic areas, respectively, 33 (coordinates from bregma: anteroposterior = −2.30 mm; lateral = + or − 2.60 mm; dorsoventral = −5.60 mm). The wound was sutured, and the animal was allowed to recover for 2 weeks before undergoing 123I-R91150 SPECT scanning (see Table 1, rat 10). After 170 minutes of scanning, the animal was sacrificed by decapitation and the brain was quickly removed and frozen in precooled isopentane at −20°C. Twenty micrometer thick coronal sections were collected with a cryomicrotome (Leica, Muttenz, Switzerland) at −20°C. The sections were mounted on glass slides, air-dried at room temperature, and exposed to phosphor imaging plates overnight (Fuji Photo Film Co.). The plates were scanned with a Fuji Bio-Imaging Analyzer BAS 1800II scanner (Fuji Photo Film Co.) at 50 μm resolution to obtain the ex vivo autoradiograms. The in vivo 5-HT2A quantification was performed similarly as exposed above, with the first 120 minutes of data.
Results
The mean percentage of nonmetabolized 123I-R91150 (Pnm) over time was measured in a group of four rats (see Table 1, rats 6–9) and fitted with a triexponential model for each experiment (Figure 2A), of which the mean parameter estimates were A1 = 0.4002; B1 = 1.049; A2 = 0.2529; B2 = 0.2135; A3 = 0.4131; and B3 = 0.0003295. The free tracer plasmatic fraction was 97 ± 3% (mean ± SD, n = 3). The blood samples drawn during SPECT experiments, along with the mean nonmetabolized fraction (Pnm) and free fraction (fp), allowed the determination of the input function of the radiotracer (C*p(t)), an example of which can be seen in Figure 2B. The input function for the cold compound (Cp(t)) was subsequently generated from these data (Figure 2C), knowing the injected doses of cold compound. Indeed, the blood kinetics of high- and low-SA injections was assumed to be linearly scalable. This assumption was supported by the comparison of input functions observed during high- and low-SA injections (see Figure 2B).
After coregistration with MRI template and brain atlas (Figure 2D), the recorded dynamic SPECT data (Figure 2E) allowed the extraction of TACs for each of the atlas ROI (Figure 2F). The regions of highest uptake were observed in the frontal cortical regions such as the orbitofrontal cortex, with approximately 1.16 pmol/mL at 110 minutes (before displacement), whereas more caudal cortical regions, such as the parietal associative cortex, showed more moderate level of activity uptake, with approximately 0.52 pmol/mL at 110 minutes. In contrast, cerebellum showed a much lower uptake, with approximately 0.21 pmol/mL at 110 minutes. The injection of a large quantity of nonradiolabeled R91150 at 120 minutes elicited a dramatic decrease in activity in orbitofrontal cortex and parietal associative cortex but not in cerebellum. The numerical values of the parameter estimates resulting from the curve fits with the 3T/7k-based model can be seen in Table 2.
Multi-injection Approach Parameter Estimates: Mean of Experiments 1 to 5 (see Table 1) ± SD

Acb = accumbens nucleus; Amy = amygdala; Aud = auditory cortex; Cb = cerebellum; CgC = cingulated cortex; Col Inf = inferior colliculus; Col Sup = superior colliculus; Cpu = caudate putamen; EntC = entorhinal cortex; Hip A = anterior hippocampus; Hip P = posterior hippocampus; Hyp = hypothalamus; InsC = insular cortex; MB = midbrain; MC = primary motor cortex; Med = medulla; MPFC = medial prefrontal cortex; OFC = orbitofrontal cortex; PAC = parietal associative cortex; PAG = periaqueductal gray; RSC = retrosplenial cortex; Spt = septum; SSC = somatosensory cortex; Thal = thalamus; Tu = olfactive tubercles; VsC = visual cortex; VTA = ventral tegmental area.
Estimates in paired regions are the means of left and right areas; Kd*VR is not a fitted parameter but is calculated as koff/(kon/VR).
All high-SA injections resulted in less than 10% receptor occupancy (between 4.8 and 7.7%). Our results indicate that an R91150 dose of 250 ng/kg (476 pmol/kg) will result in a peak occupancy of less than 10% of receptors in Mdr1a KO animals.
The highest available receptor concentrations (Bavail) were recorded in orbitofrontal cortex (21.6 ± 8.4 pmol/mL), and the lowest value was recorded in cerebellum (6.7 ± 3.2 pmol/mL). A nonnegligible nonspecific binding was found in all regions with k5 and k6 values ranging from 0.32 ± 0.09 to 0.48 ± 0.33 min−1 and from 0.05 ± 0.01 to 0.10 ± 0.05 min−1, respectively, as shown by the comparison of 3T/7k and 2T/5k model fits, which yielded a minimum F-test of 26.94, for a critical value of 1.48 (p < .0001). The mean Kd*VR was 1.42 ± 0.66 nM; however, this value was not uniform across all ROI according to ANOVA (F(1.57) = 2.63, p < .001). A post hoc Tukey test indicated that KdVR estimates in cerebellum differed from those in other regions. The average K1 was 1.77 ± 0.30 mL·min−1·cm−3 (after weighting by region volume). Across all ROI, the VND ranged from 29.3 to 49.8 mL·cm−3 and were not uniform according to ANOVA (F(1.57) = 5.14). However, the VT in cerebellum was not statistically different from the mean VND in the rest of the brain (mL·cm−3): 41.7 ± 9.8 vs 40.4 ± 5.2 (p = .8). Moreover, no statistically significant difference was observed between (VT/VND)-1 and (VT/VT_Cb)-1 for any ROI except for cerebellum itself (p < .01) (see Table 3).
With the SRTM, 120 minutes of raw data proved insufficient to obtain stable BPND estimates in high–target density regions such as the orbitofrontal cortex (Figure 3A). However, with the FA denoised data, the SRTM BPND estimate recorded in the orbitofrontal cortex was readily stable with 110 minutes of scanning. Meanwhile, the faster tracer kinetics in low–target density regions such as the pons yielded stable BPND SRTM estimates with less than 40 minutes’ scan duration with raw data and 90 minutes with FA denoised data. It is worth noting that for BPND SRTM estimates in orbitofrontal cortex using raw data (mean of five experiments ± SD), a temporary plateau was reached for scan durations between 80 (3.56 ± 0.15) and 100 (3.68 ± 0.25) minutes. Nevertheless, the mean BPND estimate then decreased to converge toward the FA denoised BPND estimates (3.00 ± 0.39 at 120 minutes).

BPND estimates obtained with the SRTM (A) and Logan reference tissue model (B), in orbitofrontal cortex (OFC) (full lines) and pons (dashed lines), with raw (black) or FA denoised data (red), as a function of the scan duration employed for the modeling (mean of 5 experiments ± SD).
For the Logan reference tissue model, the BPND estimates in high–target density regions such as the orbitofrontal cortex were stable after 90 minutes of scanning using either raw or FA denoised data (Figure 3B). With 90 minutes of scanning, estimates were 3.14 ± 0.25 for raw data and 3.02 ± 0.28 for FA denoised data; which was not significantly different from their respective values with 120 minutes of scanning: 3.27 ± 0.88 for raw data (p = .759) and 3.07 ± 0.39 for FA denoised data (p = .822). Similarly, the BPND Logan estimates in low–target density regions such as the pons stabilized after 90 minutes of scanning with either raw or FA denoised data.
On average, with 120-minute scans, BPND estimates obtained in the orbitofrontal cortex with the SRTM differed from Logan reference BPND estimates by +2% in raw data and by −3% in FA denoised data. At 120 minutes, with either the SRTM or Logan method, BPND estimates in the orbitofrontal cortex were on average 9% higher in raw data compared to FA denoised data.
Figure 4 presents average SPECT images obtained from the simulated noise-free (see Figure 4A), noised (see Figure 4B), and FA denoised data (see Figure 4C). As expected, FA denoising resulted in a reduced spread of dynamic SPECT data (see Figure 4D). The Bavail estimates obtained with the multi-injection approach from the noise-free data were taken as reference for the BP estimates obtained from the noised and FA denoised data sets. The multi-injection approach BP estimates, in either noised or FA denoised data, showed high correlation to Bavail obtained in noise-free data (r = .9235 for noised data, r = .9251 for FA denoised data) (see Figure 4E). Similarly, the BPND estimates obtained with reference tissue methods were also highly correlated to the noise-free BP estimates, whether measured with the SRTM (see Figure 4F) (r = .9233 for noised data, r = .9194 for FA denoised data) or the Logan reference tissue model (see Figure 4G) (r = .8999 for noised data, r = .9127 for FA denoised data). The differences in the correlation coefficients of noised and FA denoised data to the noise-free data, with either multi-injection, SRTM, or Logan reference, were not statistically significant (p = .9601, p = .8966, p = .7263, respectively). Neither were the differences observed between the slopes of noised and FA denoised data regression lines for either the multi-injection approach, SRTM, or Logan reference tissue model (p = .5294, p = .9079, p = .8602, respectively).

Image frames of the different simulated data sets at 120 minutes: (A) noise-free data; (B) noised data; (C) FA denoised data; (D) time-activity curves from noised data (circles) and FA denoised data (lines). Scatter plots of BP estimates in noised and denoised data sets versus noise-free data set, obtained with the multi-injection approach (E), SRTM (F), and Logan reference tissue model (G) (correlations obtained over 50 regions of interest; theoretical data were simulated with the 3T/7k parameters obtained for rat 3).
The effect of FA denoising on experimental data was also examined by comparing the correlation of BPND estimates obtained with the reference tissue methods against the Bavail obtained with the multi-injection approach (Figure 5). A small difference was observed between the correlations of the BPND SRTM estimates to Bavail when examined in raw (r = .9383) and FA denoised data (r = .8901), but this difference was not statistically significant (p = .1285). However, we observed a statistically significant difference between the slopes of the linear regressions of raw and FA denoised data, (respectively, 0.19825 vs 0.15821, p = .01342). The Logan reference tissue BPND were also highly correlated to Bavail (r = .9145 and r = .9022 for raw and FA denoised data, respectively), with no statistical difference in their correlation coefficient (p = .7188) or in the slope of their regression lines (0.1675 versus 0.1699, p = .8729).

Scatter plots showing the correlation between BPND observed with SRTM (A) or Logan reference tissue model (B) in experimental data for 120-minute scans and the absolute density of receptor measured with the multi-injection approach over 50 regions of interest.
The use of the tissue ratio method as a simple means of 5-HT2AR quantification was also investigated. This method was applied only to the raw data as it will eventually be applied to static images, on which FA denoising cannot be used. The highest correlation between SUR and Bavail was observed for the SUR calculated at 110 minutes after single-bolus injection; we thus investigated the suitability of a short time window centered on the 110th minute to estimate the regional BPND values with the SUR (Figure 6). The SURs calculated on the 100- to 120-minute time interval (SUR100–120) were highly correlated to Bavail (r = .9124), as well as to the BPND SRTM (r = .9918 for raw and r = .9951 for FA denoised data) and to the Logan reference BPND (r = .9912 for raw and r = .9954 for FA denoised data). The numerical values of receptor density estimates using the different approaches can be seen in Table 3. The mean differences (± SD) observed across 50 ROI between SUR100–120 and SRTM BPND estimates, respectively, in raw and FA denoised data, were +13.1 ± 8.8% and +8.1 ± 7.4%, whereas the mean differences between SUR100–120 and BPND Logan reference, respectively, in raw and FA denoised data, were +22.7 ± 9.2% and +24.1 ± 9.4%.
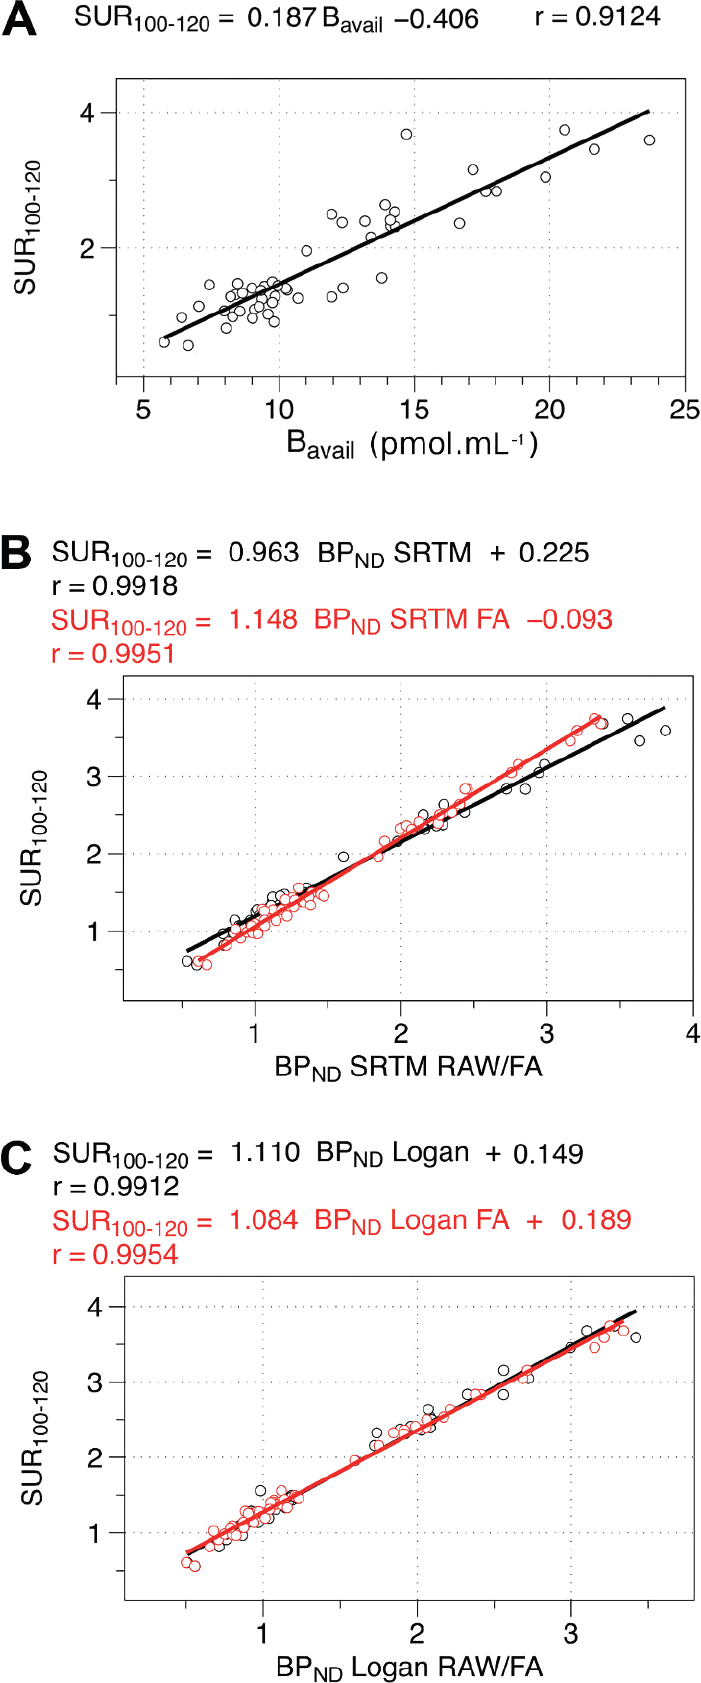
Scatter plots showing the correlation between specific uptake ratios (SURs) calculated on the 100- to 120-minute time window (SUR100–120) versus the absolute density of available receptor measured with the multi-injection approach (Bavail) (A) and versus BPND estimates obtained with the SRTM (B) and Logan reference tissue model (C) over 50 regions of interest.
Mean Receptor Density Estimates (mean ± SD, n = 5)

Acb = accumbens nucleus; Amy = amygdala; Aud = auditory cortex; BPND = nondisplaceable binding potential; Cb = cerebellum; CgC = cingulated cortex; Col Inf = inferior colliculus; Col Sup = superior colliculus; Cpu = caudate putamen; EntC = entorhinal cortex; FA = factor analysis; Hip A = anterior hippocampus; Hip P = posterior hippocampus; Hyp = hypothalamus; InsC = insular cortex; MB = midbrain; MC = primary motor cortex; Med = medulla; MPFC = medial prefrontal cortex; OFC = orbitofrontal cortex; PAC = parietal associative cortex; PAG = periaqueductal gray; RSC = retrosplenial cortex; Spt = septum; SRTM = simplified reference tissue model; SSC = somatosensory cortex; Thal = thalamus; Tu = olfactive tubercles; VsC = visual cortex; VT = total distribution volume; VTA = ventral tegmental area; VTND = nondisplaceable distribution volume.
To test the efficiency of 123I-R91150 SPECT for the detection and quantification of a variation in the 5-HT2AR density in vivo, one animal was scanned after injection of the viral vectors in the thalamus (Figure 7). The percentages of increase in tracer binding observed with the different methods in the 5-HT2AR adenovirus–injected area versus the control area treated with the 5-HT4R adenovirus were compared: the SRTM recorded BPND variations of +87% with FA denoised data (3.14 vs 1.68) and +84% with raw data (2.30 vs 1.25), whereas Logan BPND estimates showed variations of +93% with FA denoised data (2.60 vs 1.35) and +81% with raw data (2.35 vs 1.30). Meanwhile, the SUR100–120 recorded a 105% increase in raw data (3.59 vs 1.75).
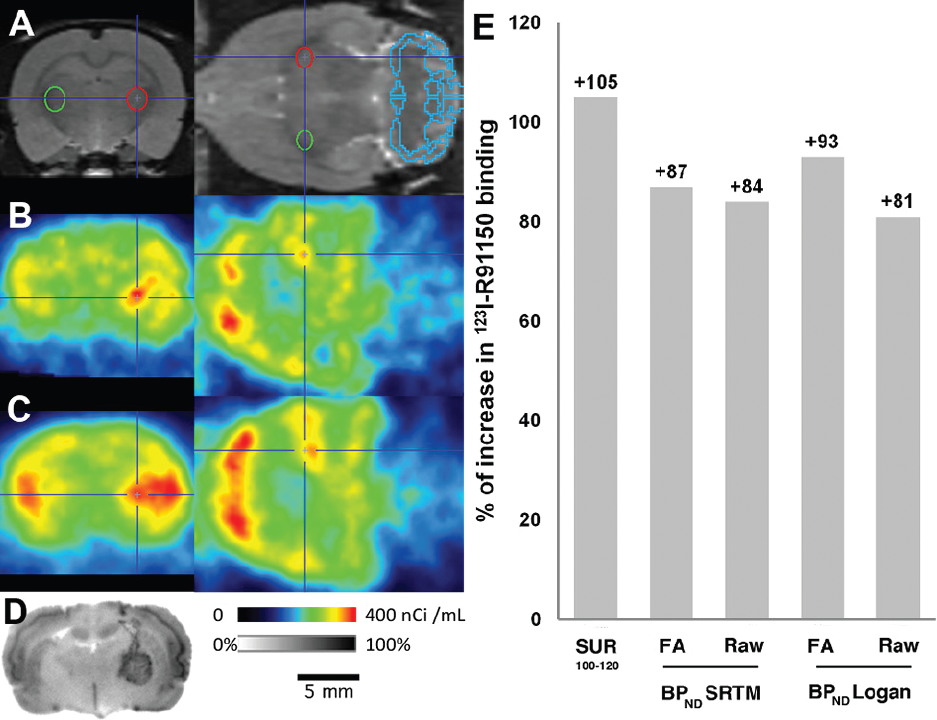
Adenoviral overexpression of 5-HT2A receptors. MRI template with cerebellum and adenovirus injection-site regions of interest (ROI) (Ad5-HT2AR = red ROI; Ad5-HT4R = green ROI) (A); averaged SPECT images between 100 and 120 minutes after tracer injection in raw (B) and FA denoised data (C); autoradiogram (D); percentage of increase in receptor density estimates, measured with different methods, in the Ad5-HT2AR- versus the Ad5-HT4R-treated area (E).
Discussion
Validation of simple SPECT quantification methods of 5-HT2A receptors in rat models will be useful for the study of the mechanism of action of drugs of interest in human medicine, notably atypical antipsychotics, by allowing the measurement of the occupancy of 5HT2A receptors. 34 Here we chose to employ Mdr1a KO rats as it has been shown that the R91150 signal to noise ratio was greatly enhanced in this rat strain compared to wild type. 18 Nevertheless, the absence of MDR1A transporters may affect other physiologic processes, and care should be taken to ascertain that the relevant model features are preserved in Mdr1a KO animals before further studies.
A variety of tracers for the 5-HT2AR have been described; see Paterson and colleagues for a review. 35 Among the existing SPECT tracers for 5-HT2A receptors, R91150 is the one with the highest target to background ratio, although positron emission tomographic (PET) tracers such as 18F-altanserin offer an even higher target to background ratio. However, PET tracers require the proximity of a sophisticated radiochemical facility, whereas SPECT tracer radiolabeling can be performed with commercially available radioiodine.
In this study, the 5-HT2AR distribution observed with 123I-R91150 SPECT in Mdr1a KO rats was in agreement with the reports found in the literature, which describe a markedly anteroposteriorly graded distribution of these receptors throughout the cortex, with a higher density of 5-HT2AR in frontal cortical regions and a lower receptor density in caudal cortical regions.36,37 The multi-injection approach requires labor-intensive and invasive procedures (metabolite analysis, blood sampling, multiple injections) and is thus not the most convenient method to study large cohorts in routine practice. Nevertheless, it constitutes a sound reference for the validation of simpler quantification methods such as reference tissue models as it allows the absolute quantification of the density of available receptors (Bavail). 17
The Bavail values observed in this study with the multi-injection approach were on the same order as that reported by others: for instance, Mertens and colleagues found a 5-HT2AR density in rat frontal cortex of 38.0 ± 0.7 fmol/mg using 123I-R91150 in vitro binding, 38 which is equivalent to 39.5 pmol/mL, assuming a brain tissue density of 1.04 g·mL−1. 39 In our study, the Bavail value observed in frontal cortex before pooling with orbitofrontal cortex was 25.6 ± 18.0 pmol/mL.
In vivo, SPECT imaging does not allow access to the Kd alone but only to Kd*VR due to the heterogeneity of tracer concentration in tissue. 40 However, a crude estimate of VR may be obtained based on the partition coefficient of the ligand at pH 7.4. 40 The logP of R91150 was estimated in silico at 2.19 (MarvinSketch 14.11.10.0, 2014, ChemAxon, Cambridge, MA), giving a VR estimate of 6.25 mL/mL. Thus, a mean estimate of Kd may be given by 1.42/6.25 = 0.23 nM, which is on the same order of magnitude as the 0.1 nM Kd reported in the literature. 38 Our results also indicate that Kd*VR values were not homogeneous across all ROI; however, the regions that diverged the most from the average Kd*VR were the ones with a low 5-HT2AR density (e.g., cerebellum or medulla), which is not surprising as a low target density is known to hamper the estimation of koff during the displacement phase. 41
We report here a mean K1 of 1.77 ± 0.30 mL·min−1·cm−3 (after weighting by region volume). This K1 value might seem unusually high; however, it can be explained by an elevated extraction coefficient: indeed, Mdr1a KO animals are lacking a transporter protein that is normally responsible for an active transport of R91150 back into blood. This hypothesis is supported by a number of studies on the effect of competitive inhibition of MDR1A transporters. For instance, Liow and colleagues measured the extraction coefficient of 11C-loperamide (which is an MDR1A substrate) in a PET study in monkey, with and without pharmacologic inhibition of MDR1A transporters; their results showed a dramatic increase in the extraction coefficient (from 0.09 at baseline up to 0.58 in treated animals). 42 A similar observation has been made by Blanckaert and colleagues with 123I-R91150 in rat during pharmacologic inhibition of MDR1A proteins, which resulted in a fivefold increase in cerebral uptake of tracer. 26 Thus, as observed in wild-type animals during inhibition of MDR1A transporter, a high extraction coefficient is expected in KO animals.
Considering an extraction coefficient close to 1, then a K1 of 1.77 ± 0.30 mL·min−1·cm−3 does not seem so far from what is presented in the literature for rat cerebral blood flow (CBF) under isoflurane anesthesia: 1.47 ± 0.19 mL·g−1·min−1, 43 and 1.57 ± 0.18 mL·g−1·min−1. 44 Moreover, CBF varies greatly with the conditions of anesthesia; for instance, Wegener and colleagues reported a CBF of 1.80 ± 0.31 mL·g−1·min−1 in rat under isoflurane anesthesia during hypercapnia, induced with 5% CO2. 45 Others have reported CBF values higher than 4 mL·g−1·min−1 during anesthesia with isoflurane in 1:1 N2O:O2. 46 Thus, we suspect these high K1 values to be due to a high extraction coefficient in Mdr1a KO animals and possibly to a high CBF induced by our anesthesia protocol, although CBF was not measured during the experiments.
Additionally, experimental errors may, of course, contribute to these high K1 values: the measurement of the initial peak of the input function is not easy due to its brevity, and the error on this measurement directly influences K1. Missing part of the peak will result in the underestimation of the input function and eventually cause an overestimation of K1. A shift between input function and tissue kinetics is also possible; however, a delay parameter was included in the model fit to minimize it. Moreover, errors on the measurement of K1 do not influence the Bavail parameter, which was the main outcome measurement of the multi-injection protocols.
The Bavail value observed in cerebellum was approximately one third of the value observed in frontal regions, as similarly observed by Eastwood and colleagues on human brain samples and by Watabe and colleagues in a PET study in monkey.47,48 Due to the presence of a nonnegligible proportion of 5-HT2ARs in the cerebellum, care should be taken to ascertain that no significant variation in 5-HT2AR occurs between case and control conditions before using this region as a reference for relative quantification. This condition is likely to be met in inbred rodent populations but will, of course, be more seldom in humans. Nevertheless, the VT_Cb was not significantly different from the VND in other ROI, nor were the (VT/VT_Cb)-1 and (VT/VND)-1 BPND estimates, thereby supporting the use of cerebellum signal as a valid estimate of the nondisplaceable signal in other regions of the brain. Concordantly, a high level of correlation was observed between the SRTM BPND and the multi-injection Bavail.
The use of the SRTM was supported by the fact that two-tissue compartment model fits were not significantly better than one-tissue compartment model fits as the highest F-test observed in any ROI was F(1.848) = 0.989; p = .519 (data not shown).
For the SRTM and Logan reference tissue model, a prerequisite step to the comparison with the multi-injection gold standard was the study of the minimum scan duration required to obtain stable estimates of BPND as it has been shown that different scan durations could substantially affect these measurements.49,50 In the absence of image treatment for denoising, the SRTM required more than 120 minutes of scanning to yield stable BPND estimates in the regions of highest receptor density, whereas the Logan reference tissue method only required dynamic scans of 90 minutes. Moreover, it has been demonstrated that FA denoising of 123I-iomazenil dynamic SPECT data could shorten the scan duration required to obtain stable BPND estimates without introducing any bias on the receptor quantification. 24 We thus examined whether FA denoising would similarly affect the 5-HT2AR BPND estimates obtained with 123I-R91150: the simulation study of the effect of FA denoising on dynamic data showed that there was no statistical difference in the correlation of raw or FA denoised data to noise-free data for either the SRTM or Logan reference tissue model, thus indicating that FA denoising did not introduce any bias in the receptor quantification. In agreement with the results of the simulations, no significant differences in the correlation of the Logan reference method BPND estimates to the Bavail gold standard were observed between the raw and FA denoised experimental data sets. With the SRTM, BPND estimates from raw and FA denoised data both showed high correlation coefficients to the Bavail gold standard, with no statistically significant difference. However, a significant difference was observed between the slopes of the regression lines obtained with SRTM BPND in raw and FA denoised data. This difference is probably due to the fact that, with 120 minutes of dynamic data, the stability of SRTM BPND estimates was not yet reached with raw data, whereas it was already reached with FA denoised data. Moreover, as the Logan reference tissue method did not require FA denoising and could rely on shorter dynamic SPECT acquisition (90 minutes), we would thus recommend the use of the Logan reference tissue method over the SRTM for the quantification of 5-HT2AR using 123I-R91150 SPECT in Mdr1a KO rats.
It is also worth noting that the extraction of TACs in relatively large ROI was readily a means of minimizing the effect of noise on the model fits; thus, the advantages of using FA denoising might be more prominent when considering smaller ROI or even single voxels.
As BPND = Bavail *fND/(Kd*VR), the expected slope of BPND to Bavail correlation should be fND/(Kd*VR) = k6/(k5 + k6)*kon/(koff*VR). This average measurement across all ROI amounted to 0.124 ± 0.045 mL·pmol−1. The expected slope value was thus lower than that observed between the reference tissue methods and Bavail, thereby indicating that BPND may be biased with an overestimation in high–target density regions. As estimated by the regression equations, for a Bavail of 25 pmol·mL−1, this overestimation could reach +36% for the SRTM (+20% with FA denoised data) and +19% for the Logan reference tissue method (+20% with FA data). Nevertheless, the SRTM and Logan reference tissue method remain interesting quantification approaches as their BPND estimates are highly correlated to Bavail.
The TR method can also be a convenient method of receptor binding quantification as it only requires a single static image to be acquired at the time of transient equilibrium. 22 We found the 100- to 120-minute interval to be suited to obtain accurate BPND estimates, exhibiting high correlation to the Bavail gold standard, as well as to the BPND estimates obtained with either the SRTM or Logan reference tissue method. The TR method is inherently less robust than the analysis of dynamic data using the SRTM or Logan reference tissue model with appropriate scan durations owing to the fact that a dynamic scan contains more information than a single static image. Nevertheless, this relatively higher noise vulnerability can be reduced by the extension of the time frame of the static image; here the use of a 20-minute static image resulted in estimates with comparable standard deviations to those obtained with the SRTM or Logan reference tissue model (see Table 3). Another shortcoming of the use of TR on a single time window for all ROI is that different ROI with different receptor densities will reach transient equilibrium at different times (the higher the density, the later the transient equilibrium time).51,52 Using a common time window for ROI of various target density could thus result in biased BPND estimates. It is also worth noting that SUR100–120 estimates tended to be higher than the SRTM and Logan reference tissue model estimates; this limitation arises when pseudoequilibrium is not achieved, as explained by Carson and colleagues and Slifstein.53,54 However, despite these biases, the SUR100–120 will still be a convenient outcome measurement of 5-HT2AR density as it remained highly correlated to the Bavail gold standard (r = .9124).
Finally, the adenoviral 5-HT2AR overexpression experiment confirmed that 123I-R91150 SPECT is amenable to detecting variations in 5-HT2AR density in vivo, as evidenced by the concurring measures obtained with SRTM, Logan reference tissue model, and TR methods. However, the recombinant adenovirus used for this experiment is a potent means of increasing receptor expression; thus, more moderate fluctuations in receptor density should be expected under ordinary physiologic conditions.
Conclusion
Among the methods under evaluation here, the Logan reference tissue method was the most adequate for the quantification of 5-HT2ARs using 123I-R91150 SPECT. Indeed, this method required only 90 minutes of dynamic SPECT scanning to yield stable BPND estimates with a high level of correlation to the Bavail gold standard, whereas the SRTM required longer scan durations, even with the use of FA denoising. Compared to the Logan reference tissue method, the use of the TR approach can be advantageous timewise as this method afforded BPND estimates with a similar level of correlation to the Bavail gold standard, with only a 20-minute scan. Nevertheless, an overestimation of the BPND by approximately 23% compared to the Logan method should be considered in this case.
Footnotes
Acknowledgments
This work was supported by the Swiss National Science Foundation (grant no. 310030_156829), the Geneva Neuroscience Centre, and the Ernst and Lucie Schmidheiny Foundation. The authors wish to thank Pr. Laurent Roux and Dr. Dominique Garcin of the University Medical Center of Geneva University for their advice and support on adenovirus-related experiments. The authors are grateful for the contribution of the “Association IFRAD Suisse”, created in 2009 at the initiative of the “Fondation pour la Recherche sur Alzheimer” (formerly IFRAD France).
Financial disclosure of authors and reviewers: None reported.