
Abstract
Contrast agents that specifically enhance cancers on magnetic resonance imaging (MRI) will allow earlier detection. Vanadium-based chelates (VCs) selectively enhance rodent cancers on MRI, suggesting selective uptake of VCs by cancers. Here we report x-ray fluorescence microscopy (XFM) of VC uptake by murine colon cancer. Colonic tumors in mice treated with azoxymethane/dextran sulfate sodium were identified by MRI. Then a gadolinium-based contrast agent and a VC were injected intravenously; mice were sacrificed and colons sectioned. VC distribution was sampled at 120 minutes after injection to evaluate the long-term accumulation. Gadolinium distribution was sampled at 10 minutes after injection due to its rapid washout. XFM was performed on 72 regions of normal and cancerous colon from five normal mice and four cancer-bearing mice. XFM showed that all gadolinium was extracellular, with similar concentrations in colon cancers and normal colon. In contrast, the average VC concentration was twofold higher in cancers versus normal tissue (p < .002). Cancers also contained numerous “hot spots” with intracellular VC concentrations sixfold higher than the concentration in normal colon (p < .0001). No hot spots were detected in normal colon. This is the first direct demonstration that VCs selectively accumulate in cancer cells and thus may improve cancer detection.
NONINVASIVE METHODS for early detection of colon cancer, such as magnetic resonance imaging (MRI), could greatly improve patient outcomes by detecting cancer early and guiding therapy. MRI can provide an important noninvasive alternative to conventional colonoscopy and allows cancer detection without radiation associated with computed tomography or positron emission tomography (PET).1–6 This would be facilitated by an MRI contrast agent that preferentially accumulates in cancer cells. Such an agent could strongly and selectively enhance cancers on high-resolution three-dimensional images and clearly delineate tumor boundaries and morphology.
Previous in vivo MRI studies showed that vanadyl bis-acetylacetonate [VO(acac)2] selectively enhances signal from prostate cancers implanted in mice. 7 This may also be the case for other vanadium chelates (VCs). 8 The mechanism of selective enhancement has not been established. It is possible that the leaky vasculature of cancers allows preferential leakage of VO(acac)2 from the blood into tumor. 7 However, studies of cell cultures suggest that VCs target cancer cells due to their increased rate of glycolysis. 8 It has not yet been established whether these compounds accumulate inside the cancer cells or remain as membrane-bound, extracellular species. 9
VCs have a good patient safety profile and are used clinically to treat diabetes with low toxicity.10–12 This suggests that tumor-specific vanadium-based contrast agents could be safely used in patients. If VCs are preferentially taken up by cancer cells with high rates of glycolysis, 13 the use of vanadium-enhanced MRI to detect such cells would be analogous to PET but would have several advantages, including improved anatomic resolution and elimination of radioactivity. The sensitivity of VCs to cancer metabolism could improve sensitivity and specificity and allow noninvasive evaluation of cancer aggressiveness based on glycolytic activity. Thus, VCs could become important new tools for anatomic and functional/metabolic imaging of cancer.
Here we report on the use of x-ray fluorescence imaging of the microscopic distribution of VO(acac)2 in normal murine colon and murine colon cancer and compare it to that of a clinically used gadolinium-based agent (Omniscan, GE Healthcare, Oslo, Norway). We studied a mouse model of colon cancer induced by the standard azoxymethane/dextran sulfate sodium (AOM/DSS) protocol. 14 Images of tissue slices were acquired at submicron resolution using x-ray fluorescence microscopy (XFM).15,16 In addition, x-ray absorption spectroscopy, in particular x-ray absorption near edge structure (XANES), was used to determine the oxidation state of vanadium in colonic tissue.
Due to limited time at the Advanced Photon Source, Argonne National Laboratory (Argonne, IL), distributions of VO(acac)2 and Omniscan were sampled by XFM at only a single time after injection. Previous work in this laboratory showed that VCs are sequestered inside colon cancer cells for at least 2 hours. 8 In vivo VC-enhanced MRI studies of rodent prostate cancers 7 and atomic absorption measurements of excised tissue from prostate cancers also showed that VCs remain in cancers in vivo for at least 2 hours after injection. 8 Therefore, the distribution of VO(acac)2 was sampled by XFM at 120 minutes after injection to test for prolonged and selective intracellular retention of VCs in cancers. Since Omniscan remains extracellular and washes out of normal tissue and colon cancers rapidly,17,18 Omniscan distribution was sampled by XFM at 10 minutes after injection.
Materials and Methods
Animal Model
Animal protocols were approved by the Institutional Animal Care and Use Committee of The University of Chicago. Pathogen-free CF1 female mice were purchased from Charles Rivers (Wilmington, MA; weight, ≈ 15 g). The mice were allowed to habituate for 2 weeks before the study was initiated. Nine CF1 female mice were included in this study. To induce colitis-associated colorectal tumors, mice were given one 10 mg/kg dose of AOM (Midwest Research, Kansas City, MO) intraperitoneally at 8 weeks of age. Mice then received 2.5% (weight/volume) DSS (MP Biomedical LLC, Solon, OH; molecular weight 36,000–50,000 Da) in their drinking water for two cycles lasting 5 days each, with one cycle beginning at week 2 and the following cycle at week 6 after the AOM injection. 14 Early colon cancers generally appeared at weeks 20 to 24. An additional control group (five mice) was given saline injection followed by normal drinking water.
Mice were scanned between weeks 20 and 24 at 9.4 T to identify early colorectal cancers. Once the colorectal tumors were identified (1–4 mm in size) by MRI, mice were injected intravenously with Omniscan, a Food and Drug Administration–approved, gadolinium-based contrast agent and VO(acac)2 (grade 99.99%; Sigma-Aldrich, Milwaukee, WI). Both contrast agents were given at a dose of 0.13 mmol/kg of the body weight, in saline.
Both Omniscan and VO(acac)2 were injected into each mouse; each mouse was sacrificed at 10 minutes after gadolinium injection and 120 minutes after vanadium injection. In addition, tissue samples were prepared after sacrificing five tumor-bearing mice without injecting any contrast agent, and those samples served as baseline controls.
Tissue Harvesting for Immuno-histochemistry and XFM
Sections of colon with and without tumors were excised and fixed in 10% formalin for histology or embedded in Tissue-Tek optimal cutting temperature compound (Miles, Elkhart, IN) and frozen in liquid nitrogen for XFM and for hematoxylin-eosin (H&E) stain. After cryosectioning, frozen 7 μm thick slices of normal colon or colonic tumors were mounted on silicon nitride windows (Silson Ltd., Blisworth, England) 2.0 mm × 2.0 mm in size, air dried, and kept in a desiccator until XFM studies. Adjacent to 7 μm thick slices for XFM, 5 μm thick slices were prepared for H&E staining to facilitate lesion identification.
H&E-stained sections were prepared in the Human Tissue Resource Center at the Pathology core of The University of Chicago Medical Center. Histologic images were evaluated for inflammation and to identify adenomas by a gastrointestinal pathologist (J.H.) as previously described.17,18
X-Ray Fluorescence Microscopy
XFM was performed at Beamline 2-ID-E at the Advanced Photon Source. The x-ray microprobe has been described previously.15,16 Samples were mounted in a helium-filled chamber using a kinematic mount. Undulator-derived x-rays were monochromatized to 10 keV incident energy using a single-bounce Si(111) monochromator and focused to a spot size of 0.9 μm in the horizontal direction and 0.9 μm in the vertical direction using Fresnel zone plate optics (Xradia, Concord, CT). Incident flux was 109 photons per second. Fluorescence spectra were recorded using a Vortex ME4 silicon drift detector (SII NanoTechnology USA Inc., Northridge, CA).
Rapid fly scans were performed on whole tissue sections, typically with 5 μm resolution and 100 ms dwell time per pixel. Elemental maps were aligned to optical images taken using a Leica optical microscope (Leica Microsystems, Weltzar, Germany). Elemental images were used in conjunction with optical images to locate appropriate regions of interest for high-resolution scans. For high-resolution scans, samples were raster-scanned through the focused x-ray beam using 1 to 2 μm steps. Fluorescence spectra were collected for 1 second per pixel for the entire slice of 2.0 mm × 2.0 mm in size.
Because the field of view of XFM is limited, and because limited time is available on the beamline, it was not possible to scan the entire colon at higher resolution. Therefore, smaller regions of interest (≈ 40 μm × 40 μm or 20 μm × 20 μm) were selected for XFM scans at high resolution (0.3 μm in-plane resolution). Mouse colonic tissue samples for XFM from tumor-bearing mice were selected to contain mostly cancerous regions (about 80% of tissue) with some muscle and lymphoid aggregates (about 20% of tissue). Colonic tissue samples for XFM from normal mice contained mostly colonic crypts (90% of tissue) and peripheral muscle (10% of tissue). The tissue types, corresponding to adenomas, lymphoid aggregates, normal colonic crypts, and muscle, for all XFM samples were assessed on the basis of H&E-stained histologic sections by a gastrointestinal pathologist (J.H.).
Single cells were located for submicron resolution imaging where appropriate. A second zone plate (Xradia) was used to focus x-rays to a spot size of 0.3 μm horizontal and 0.3 μm vertical. Samples were raster-scanned through the focused x-ray beam using 0.3 μm steps, with 1-second dwell time per pixel.
Quantitation and image processing were performed using MAPS software. 19 Normalized fluorescence intensities for each element at each pixel were converted to a two-dimensional concentration in micrograms per square centimeter by fitting spectra against the spectra obtained from the National Institute of Standards and Technology (Gaithersburg, MD) thin-film standards NBS-1832 and NBS-1833.
X-Ray Absorption Spectroscopy
Samples were scanned at bending magnet Beamline 8-BM at the Advanced Photon Source. A 7 μm thick mouse colon slice treated with VO(acac)2 was fixed to a silicon nitride window as described previously and mounted in an He-filled box. The beam was monochromatized to 5.6 keV incident energy using a double crystal monochromator and defined by a 500 μm pinhole. To locate appropriate regions for imaging, the sample was raster-scanned through the beam in 250 μm steps and with a 10-second dwell time per pixel. Full fluorescence spectra were collected at each point using a Vortex-ME4 four-element Ge detector (SII NanoTechnology USA Inc.).
Once regions of interest were chosen for x-ray absorption studies, the incident energy was scanned between 5,370 eV and 5,600 eV in 0.25 eV steps. The integration time was 40 seconds per data point. Three air-filled ion chambers were placed in the beam path, one upstream of the sample to measure incident intensity and two downstream of the sample. Energy calibration was achieved by placing a vanadium foil between the second and third ion chambers. The intensity of the V-Kα fluorescence line was recorded as a function of incident energy using the Vortex-ME4 detector. Five regions of interest in total were collected over the tissue slice.
For comparison, a dry sample of VO(acac)2 was mounted between two pieces of Kapton tape and scanned through the beam in 0.25 eV steps and 1-second dwell time. Absorption of x-rays was monitored by calculating the ratio of the first and second ion chamber readings. For the VO(acac)2 standard, the raw signal was taken as the ratio of the first and second ion chamber readings, and the signal was normalized using a straight line fit to both the pre-edge and postedge regions.
Data analysis was carried out using SixPACK software. 20 Energy calibration was established by defining the first inflection point in the vanadium foil scan to be 5,465 eV and shifting collected spectra accordingly. For the fluorescence data, the raw signal was calculated as the ratio of the fluorescence intensity to the incident intensity at each point. Data were normalized by fitting the pre-edge region (−200 to −50 eV below the edge) to a gaussian tail and the postedge region (+20 to +120 eV above the edge) to a second-order spline with five regions. Principal component analysis was performed on the five normalized absorption spectra from the selected regions of interest to check for significant variation from region to region.
Data Analysis
XFM data were processed using software written in IDL (Exelis VIS, Inc., Boulder, CO) and were analyzed using MAPS software 19 and SixPACK software. 20 A Student t-test was performed for statistical analysis. A p value less than .05 was considered significant.
Results
Figure 1 compares ex vivo images of excised colonic tissue samples from a control mouse: panel A shows a light microscopy image, panel B shows an XFM image of the phosphorus distribution of the same tissue, and panel C shows an H&E image of an immediately adjacent slice of the excised colonic tissue from the same mouse. The histologic (H&E-stained) slices, adjacent to slices for XFM, were prepared for precise image coregistration and lesion identification, as shown in Figure 1. Figure 2 shows a light microscopy image and an H&E image and compares distributions of phosphorus, sulfur, iron, gadolinium, and vanadium (labeled P, S, Fe, Gd, and V, respectively, in the figure) for a tissue slice taken from a normal mouse colon after administration of both Omniscan and VO(acac)2. Two regions of interest are labeled as muscle (M) and normal colonic crypts (C) in the top left panel. High-resolution XFM images show that in the normal colonic tissue, the accumulation of gadolinium in either muscle or normal crypts was significantly higher than vanadium accumulation. (This was expected because gadolinium was injected only 10 minutes before sacrifice, whereas vanadium was injected 120 minutes before sacrifice.)

Comparison of ex vivo images of the excised colonic tissue from a control mouse. Panel A shows a light microscopy image and panel B shows a low-resolution x-ray fluorescence microscopy (XFM) image (fly scan) of mouse colon tissue placed on a 2 mm × 2 mm silicon nitride membrane. C, A hematoxylin-eosin (H&E)-stained image of an adjacent slice of the excised colonic tissue from the same (control) mouse. The columnar colonic crypts and the surrounding colonic muscle in the excised colonic tissue samples from a control mouse as seen in all three panels appear to be identical. The slice thickness was typically about 5 microns for H&E or 7 microns for XFM. Scale bars of 200 microns are indicated in all three images.

Distributions of elements in colonic tissues. Comparison of a light microscopy image (top left, labeled as LM) and an x-ray fluorescence microscopy (XFM) image showing phosphorus (P), sulfur (S), iron (Fe), gadolinium (Gd), and vanadium (V) (as labeled) distributions for a tissue slice taken from a normal mouse colon after administration of both Omniscan and VO(acac)2. Two regions of interest are labeled as M, muscle, and C, normal colonic crypts, in the top left panel; the inset shows a histologic image (hematoxylin-eosin stained) of these regions. High-resolution XFM images (5 μm in-plane resolution) show that in the normal colonic tissue, the accumulation of gadolinium in either muscle or normal crypts is significantly higher compared to that of vanadium accumulation. Each image is scaled to its minimum (0) and maximum (1) gadolinium or vanadium concentration, as indicated by color bars. Scale bars of 200 μm corresponding to all images are shown. A red circle in each image indicates a cutting artifact during this tissue preparation.
Figure 3 compares x-ray fluorescence spectra from colonic tissue in a tumor-bearing mouse that was not injected with contrast agent to spectra from similar tissue in a tumor-bearing mouse that was injected intravenously with both VO(acac)2 and Omniscan. Panels A and B show XFM images of the phosphorus distribution in tissue sections from the two mice. X-ray fluorescence spectra were taken from hypercellular areas (the red boxes in panels A and B) indicated by high phosphorus concentrations. These regions contained colonic adenomas; this was confirmed by a gastrointestinal pathologist (J.H.) based on examination of the H&E-stained histologic sections shown in the insets. Panels C and D show x-ray fluorescence spectra integrated over all individual pixels in the regions of interest defined by the red boxes in panels A and B, respectively. The spectral features for vanadium (in violet) and gadolinium (in black) were not found in panel C (mouse not injected with contrast agents), as indicated by the dashed lines at the expected energies. However, peaks for vanadium and gadolinium were clearly evident in panel D, as indicated by color-coded solid lines. The characteristic x-ray fluorescence lines of vanadium (Kα and Kβ lines, left to right) and gadolinium (Lα, Lβ1, and Lβ2 lines, left to right) do not overlap significantly with spectral lines from other elements. This demonstrates that specific elemental maps of vanadium and gadolinium can be produced.

Detection of gadolinium and vanadium in colonic tissues. A, X-ray microprobe image of the phosphorus distribution of a tissue slice taken from a cancerous mouse colon. Colorectal tumors in CF1 female mice developed after an azoxymethane/dextran sulfate sodium protocol (see the Materials and Methods section). B, X-ray microprobe image of the phosphorus distribution of a tissue slice also taken from a cancerous colon but after administration of gadolinium-based Omniscan and bis(acetylacetonato)oxovanadium(IV) [VO(acac)2]. In each panel, the red box indicates a region of interest (ROI) highlighting adenomatous cells. In the inset of both panels, hematoxylin-eosin–stained images, corresponding to ROI, show adenoma. C, Integrated x-ray fluorescence spectrum taken over the ROI defined in panel A. The dashed lines show the expected positions for the K lines from vanadium (violet) and the primary L lines from gadolinium (black), demonstrating that these elements are not naturally present in adenomas from mice that did not receive contrast agents. The K lines for Mn (weak Kα) and Fe (Kα and Kβ) are indicated by green and red arrows, respectively. D, Integrated x-ray fluorescence spectrum taken over the ROI defined in panel B. The vertical lines show the positions of the major vanadium (violet) and gadolinium (black) fluorescence spectral peaks in this energy range, confirming the presence of both elements in colonic adenomas. As seen in panel D, the Lβ2 line for Gd overlaps with the strong Kβ line of Fe.
Figure 4 compares XFM images of gadolinium and vanadium uptake in excised colonic tissue from a tumor-bearing mouse at week 22 after AOM/DSS treatments. Panel A is a light microscopy image and panel B is an XFM “fly scan” image (2 μm in-plane resolution) showing the phosphorus distribution. Higher-resolution XFM images of gadolinium (panel C) and vanadium (panel D) were obtained from the regions shown by the red boxes. The boxes contain (1) muscle, (2) lymphoid aggregate, and (3) adenoma as determined by the histology of adjacent sections. Each image is scaled based on the minimum and maximum gadolinium and vanadium concentrations (0 [purple] = minimum concentration; 1 [red] = maximum concentration) to maximize dynamic range. XFM shows that the average gadolinium concentration was lower in the adenoma (panel C3) than in muscle and lymphoid aggregate (panels C1 and C2). In contrast, vanadium concentration was higher in adenoma (panel D3) than in regions of muscle and lymphoid aggregate, especially in the “hot spots” scattered throughout the adenoma.

Preferential distribution of vanadium in cancerous colonic tissue. Comparison of (A) a light microscopic image and (B) an x-ray fluorescence microscopy (XFM) image showing phosphorus distributions in a colonic tumor section taken from a mouse administered both Omniscan and VO(acac)2. Three regions of interest are highlighted: 1 = muscle; 2 = lymphoid aggregate; 3 = adenoma, identified by the histology of adjacent sections. C, High-resolution XFM images of the gadolinium distribution in the highlighted regions of interest (ROI), as labeled. The XFM images indicate that gadolinium accumulates primarily in the muscle (ROI-1) and in lymphoid aggregates (ROI-2) and to a much lesser extent within adenoma (ROI-3). The corresponding XFM images of the vanadium distribution in the same regions of interest are shown in panel D. Note that there is much higher vanadium accumulation in the adenoma (ROI-3)—especially in scattered hot spots—compared to muscle (ROI-1) and lymphoid aggregates (ROI-2). Each image was scaled to its minimum and maximum gadolinium or vanadium concentration (0–1), as indicated by color bars. Scale bars of 100 microns in panels A and B and 20 microns in panels C and D are shown.
To quantitatively compare vanadium and gadolinium uptake in adenomatous and normal crypts, as well as in muscle and lymphoid aggregate regions, we identified these regions with the help of an expert gastrointestinal pathologist (J.H.) independent of the elemental maps, to exclude bias in the selection of regions of interest. The pathologist selected regions of interest without knowledge of gadolinium or vanadium distributions, based on light microscopy and H&E-stained tissue. Figure 5 shows a section containing adenoma and illustrates the selection of regions of interest. Rectangular fields of view were selected, as indicated by the red boxes in Figure 5 (panels A and B). A total of eight such regions from eight sections (two sections from each of four mice injected with both VO(acac)2 and Omniscan) were scanned with XFM at a resolution of 2 microns. Panel D shows the images from the regions defined by the red boxes in panels A and B. Average elemental concentrations were calculated over the entire field of view shown in panel D, excluding a 10-micron border around the box (indicated by yellow boxes in panel D). Similar boxes were defined in eight regions in normal crypts (from one to two sections from each of five control mice that were not treated with AOM/DSS). The average concentration of vanadium in regions of interest in adenomas was 0.46 ± 0.11 mM. This was significantly higher (p < .002 by Student t-test) than the average concentration in normal crypts (0.21 ± 0.06 mM). In the same regions of interest, the average gadolinium concentration in adenomatous lesions was 0.48 ± 0.23 mM, compared to 0.68 ± 0.21 mM in normal crypts (this difference was not statistically significant). Concentrations of vanadium and gadolinium in regions of interest in normal muscle, normal crypts, and adenomas are summarized in Table 1.
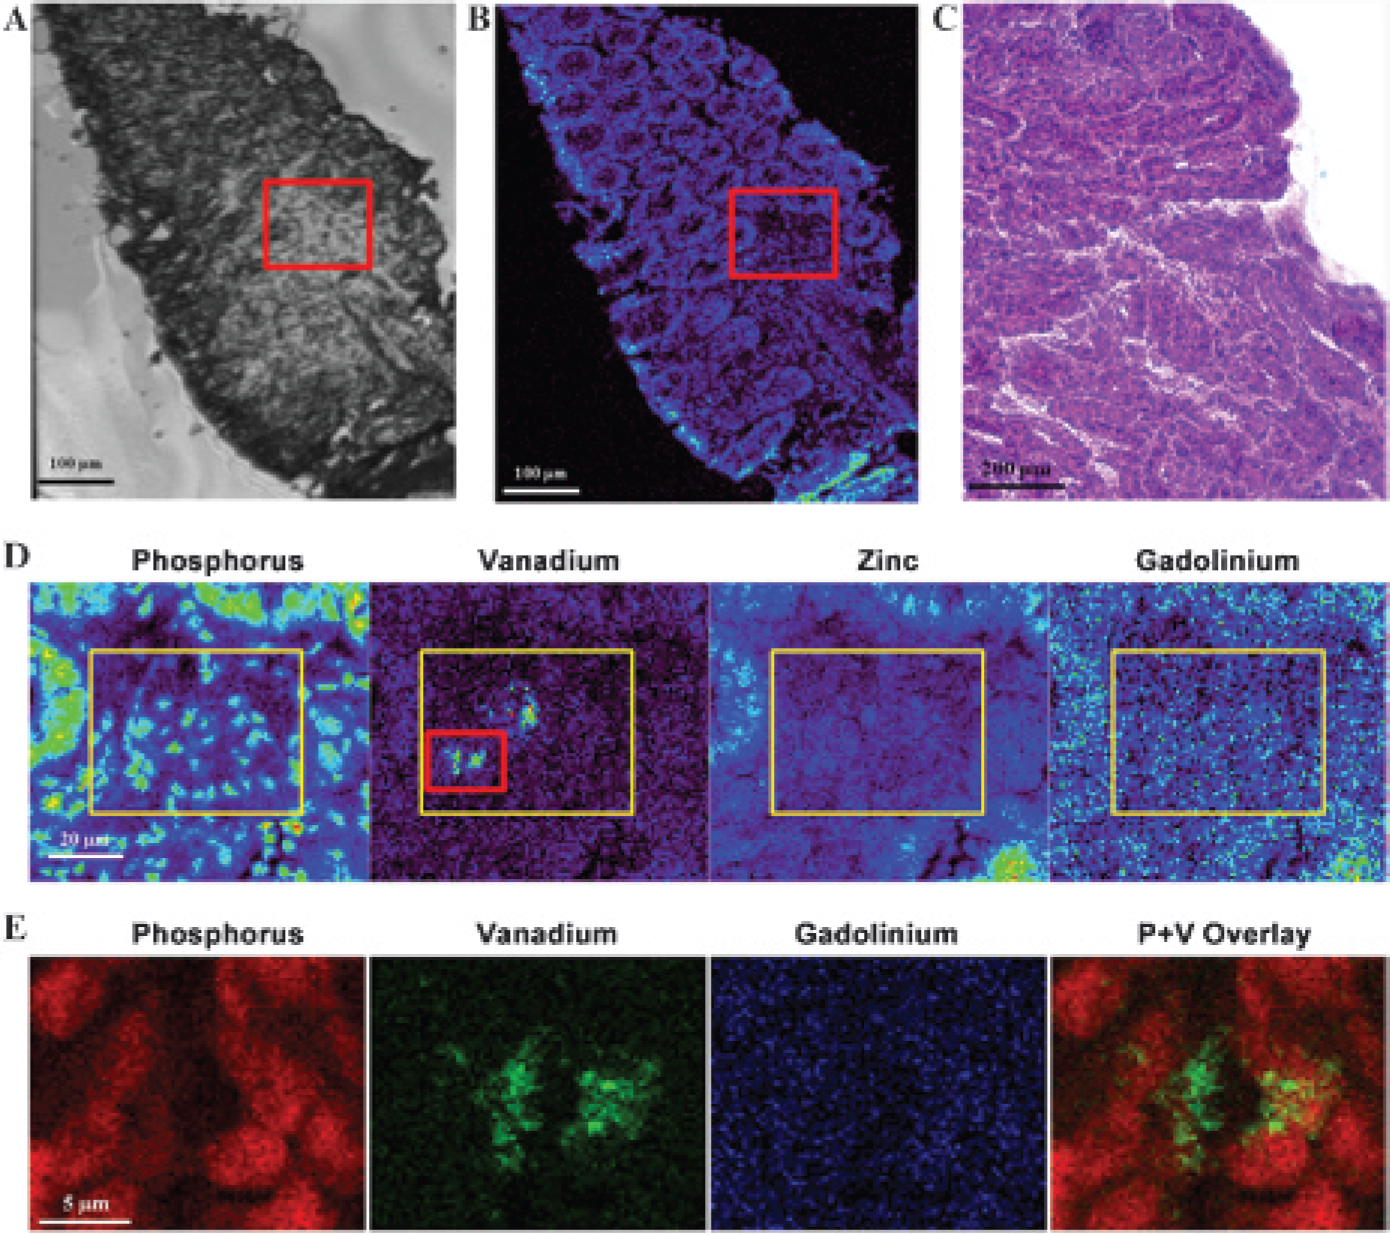
Intracellular accumulation of vanadium in cancerous colonic tissue. The top panel compares ex vivo light microscopic, x-ray fluorescence microscopy (XFM), and histologic images of the excised colonic tissue from a tumor-bearing mouse. Panel A shows a light microscopy image, and panel B shows an XFM image of phosphorus distributions in mouse colon tissue placed on a 2 mm × 2 mm silicon nitride membrane. Panel C shows a histologic image of an adjacent slice of the excised colonic tissue from the same tumor-bearing mouse. The hematoxylin-eosin (H&E) image (×20 original magnification) shows adenoma (cancer). The slice thickness was typically about 5 microns for H&E or 7 microns for XFM. The middle panel (D) shows elemental maps of phosphorus, vanadium, zinc, and gadolinium within an adenoma, indicated by red boxes in panels A and B, in a tumor tissue slice taken from a mouse treated with both Omniscan and VO(acac)2. Two boxes are drawn in panel D, the yellow box of 50 μm × 40 μm in each image and a red box of 18 μm × 20 μm only in the vanadium map, to calculate precise elemental concentrations (see text). The bottom panel (E) shows an ultra-high-resolution XFM scan with in-plane resolution of 0.3 μm and compares the distributions of phosphorus (red), vanadium (green), and gadolinium (blue) within an adenomatous region indicated by a red box in the vanadium map in panel D. Also, in the rightmost panel of E, an overlay map of phosphorus and vanadium is shown. Scale bars of 100 or 200 microns in the top panel, 20 microns in the middle panel, and 5 microns in the bottom panel are shown.
Concentrations of Vanadium and Gadolinium in Colonic Tissues

Concentrations of vanadium and gadolinium (in mM) in regions of interest from normal muscle, normal crypts, and adenomas were determined by x-ray fluorescence microscopy.
In addition to regions containing adenomas, regions of lymphoid aggregate and muscle tissues in tumor-bearing mice were selected to measure the concentrations of vanadium and gadolinium, and they were as follows: lymphoid aggregates: vanadium = 0.32 ± 0.09 mM and gadolinium = 0.92 ± 0.32 mM; and in muscle: vanadium = 0.26 ± 0.08 mM and gadolinium = 0.66 ± 0.21 mM.
The average concentration of contrast agent was also measured in hot spots. As demonstrated in panel D of Figure 5, vanadium distribution was heterogeneous, and several regions of high vanadium concentrations were found in each XFM scan of adenomas. These hot spots were found next to areas with a high phosphorus signal on XFM, suggesting high cellular density and/or enlarged nuclei. To evaluate these hot spots quantitatively, all pixel clusters greater than 20 microns in linear dimension, with contrast media concentrations higher than 1.0 mM, were selected in XFM images from all adenomas scanned, and average contrast media concentrations in these hot spots were measured. To avoid bias, the hot spots were not manually segmented. Rather, a rectangular box (≈ 20 μm × 25 μm) was drawn to encompass the hot spots, as illustrated by the small red box in Figure 5D. In addition to the hot spots, these boxes also contained tissue with lower concentrations of contrast media, as shown in Figure 4D. A representative box, shown in Figure 5D (outlined in red), contained two hot spots for vanadium but no hot spots for gadolinium. (Although there is diffuse gadolinium in the area just outside the lower left corner of the large yellow box in Figure 5D, this gadolinium is not inside the red box used for hot spot calculations and is not in the cancer but rather in neighboring muscle.) From eight adenomatous regions in four mice, a total of 10 hot spots were detected for vanadium, with an average concentration of 1.59 ± 0.12 mM. This was significantly higher than the concentration in normal crypts and muscle (p < .0001). These hot spots comprised approximately 10 to 15% of tissue in the selected regions of interest in cancers. No hot spots were detected for gadolinium in adenomas, and no hot spots for gadolinium or vanadium were detected in normal crypts.
Ultra-high-resolution scans (0.3 microns) were used to image the intracellular concentration of contrast agents. The bottom panel (E) in Figure 5 shows an ultra-high-resolution XFM scan with in-plane resolution of 0.3 micron comparing the distributions of phosphorus, vanadium, gadolinium (labeled P, V, and Gd, respectively, in the figure), and an overlay of phosphorus and vanadium maps within an adenomatous region indicated by a red box in the vanadium map in panel D. The phosphorus distribution defines the positions of individual nuclei, and the overlay image of phosphorus and vanadium indicates that vanadium selectively accumulated in regions very close to cell nuclei. This strongly suggests that vanadium was intracellular. Vanadium does not overlap with cell nuclei, as indicated by the high concentration of phosphorus, but intracellular vanadium does overlap with intracellular sulfur, generally associated with macromolecules that are present in the cytoplasm. The pattern shown in Figure 6 was observed in ultra-high-resolution scans of eight different regions involving adenomas. To estimate the intracellular concentration of vanadium, the average concentration of vanadium was measured in 8 to 10 small clusters of intracellular pixels, less than ≈ 5 microns from high concentrations of phosphorus (indicating the position of the nucleus), selected from eight scans of adenomas in four mice. The average concentration of vanadium in these clusters was 1.59 ± 0.11 mM. The peak concentration in these clusters was 3.69 ± 0.11 mM (based on the two pixels in each cluster with the highest vanadium concentration). In contrast, no gadolinium was detected near cell nuclei in normal or adenomatous tissue.

The accumulation of vanadium inside the cancerous cells. The four panels show elemental maps of phosphorus, sulfur, vanadium, and an overlay map of phosphorus, sulfur, and vanadium within a cancerous crypt region in a tumor tissue slice taken from a mouse treated with both Omniscan and VO(acac)2. The intracellular distributions of phosphorus (red), sulfur (green), and vanadium (blue) and their overlay map within an aberrant crypt region indicate that vanadium distribution overlaps with the intracellular sulfur distribution. A scale bar of 5 microns in the vanadium map is shown, and the elemental maps are labeled.
X-ray absorption near edge structure (XANES) was used to determine the oxidation state of vanadium in colonic tissue. In Figure 7, panel C shows the individual XANES scans of the vanadium signal over the five regions of interest, as indicated in Figure 7, A and B. All of these scans were compared to the standard [VO(acac)2] that has vanadium with the oxidation state of +4 (see panel D). The edge position was not shifted in the tissue slice compared to the VO(acac)2 standard, suggesting that the vanadium in the tissue slice is in the +4 oxidation state. Thus, vanadium persists in the paramagnetic state in tissue and therefore can produce contrast in magnetic resonance images.
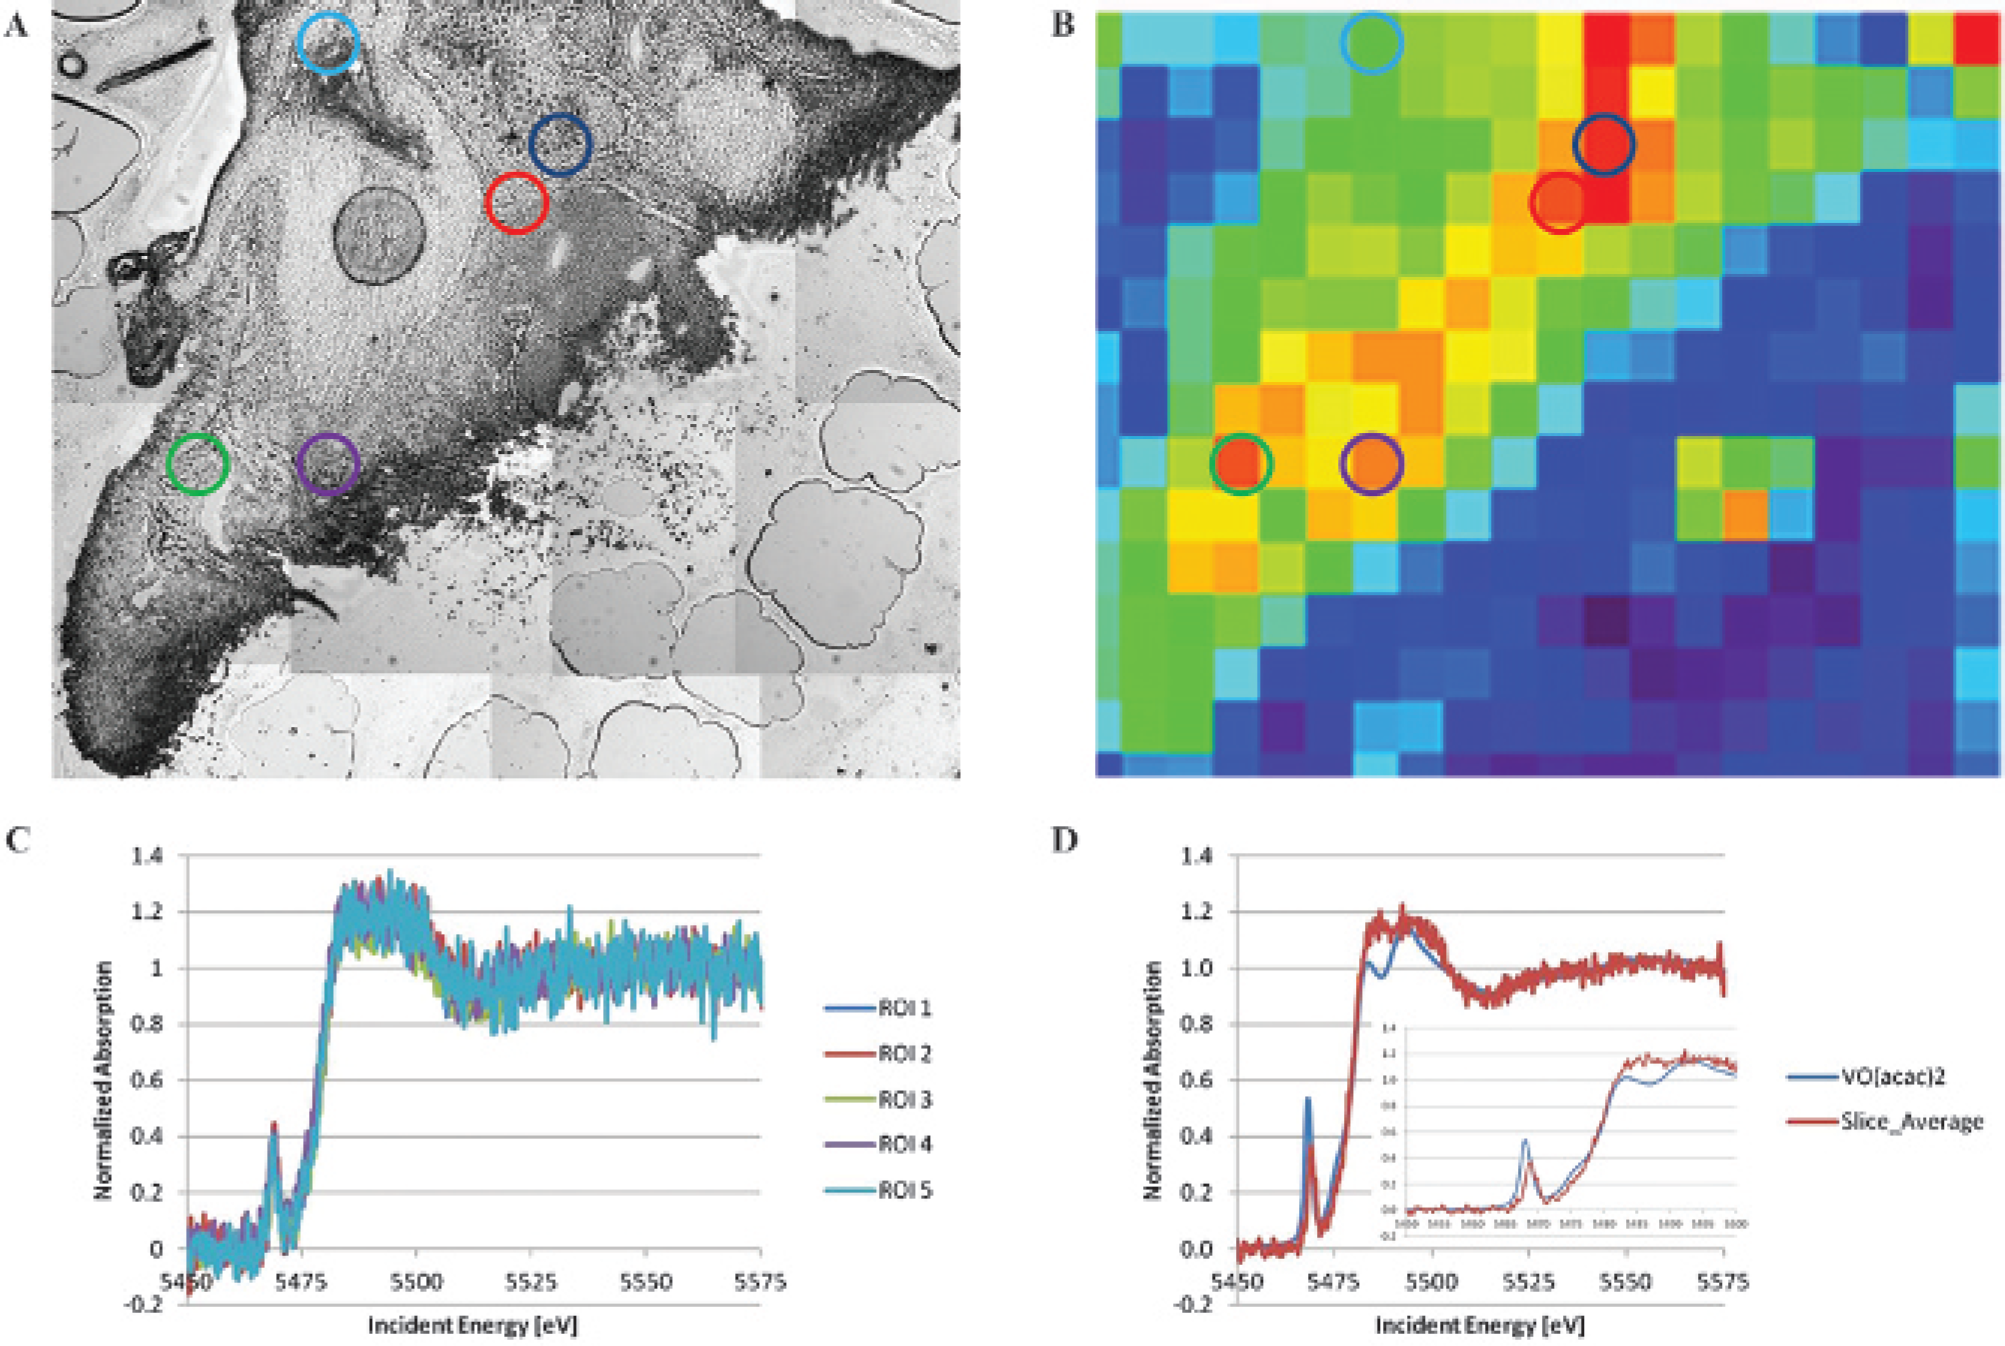
Vanadium retains in its original oxidation state in cancerous colonic tissues. Panel A shows a light micrograph of the tissue slice taken from a tumor-bearing mouse treated with VO(acac)2, and panel B shows the low-resolution scan of the vanadium distribution. The locations of the five regions of interest are shown with the colored circles superimposed on both images (dark blue = ROI 1, red = ROI 2, green = ROI 3, purple = ROI 4, light blue = ROI 5). Panel C shows the individual XANES scans over the five regions of interest. Principal component analysis of the spectra from these regions showed that the first component alone (approximating an average vanadium absorption scan) accounts for > 93% of the observed variation, and the second most significant component was indistinguishable from noise (data not shown), indicating that there are no significant variations in the vanadium absorption signal from region to region. As there were no significant variations in absorption throughout the slice, the signals as in panel C were averaged and compared to the absorption of the VO(acac)2 standard. Panel D shows the average vanadium XANES absorption signal over the slice (red) compared to the XANES absorption in the VO(acac)2 standard (blue), and the inset shows the detail pre-edge region in detail. The edge position is not shifted in the tissue slice relative to the VO(acac)2 standard, suggesting that the vanadium in the tissue slice is in the +4 oxidation state. There are small changes in the shape of the XANES spectrum overall, indicating a change in the local chemical environment. In particular, the pre-edge peak has decreased in intensity and is shifted to higher energy, which may suggest a shift in the average coordination environment of the solid VO(acac)2 standard sample compared to VO(acac)2 in the tissue samples.
Discussion
The results demonstrate that vanadium at 120 minutes after injection is selectively taken up by colon cancers compared to normal colonic crypts and muscle. In contrast, the conventional gadolinium contrast agent concentration in normal tissues and in cancers at 10 minutes after injection is not statistically significant. Gadolinium remains in the extracellular space as expected, but the results show that vanadium is taken up by cancer cells and has a high intracellular concentration. The distribution of vanadium in cancers is very heterogeneous, and many hot spots with local concentrations above 1 mM were found near dense nuclei, as indicated by a high phosphorus signal. This was not the case with gadolinium. The present results do not rule out the possibility that gadolinium could selectively concentrate in cancers at 120 minutes after injection. However, our previous MRI data strongly suggest that this is not the case 7 because there is no residual enhancement of adenomas at 20 minutes after Omniscan injection. 18 In future studies, we plan to sample more time points with XFM, following gadolinium and vanadium injection, so that we can directly address this issue.
The present findings are consistent with earlier results from this laboratory. MRI studies of rats and mice with prostate cancers implanted in the hind limbs demonstrated that VO(acac)2 produces strong and selective T1 and T2* decreases in the cancers. 7 Signal enhancement in T1-weighted images induced by VO(acac)2 persisted for at least 2 to 3 hours in tumors but not in muscle. Omniscan washed out of both tumors and muscle rapidly. Gadolinium and vanadium levels measured by atomic absorption in tissue samples taken at various times after injection confirmed prolonged and preferential retention of vanadium in cancers and relatively rapid washout of gadolinium. 18 Measurements of VO(acac)2 levels in cultured cells by atomic absorption spectroscopy demonstrated much higher concentrations of the contrast agent bound to or taken up by colon cancer cells compared to normal colonic fibroblasts. 8 These previous results, together with the present XFM data, strongly support the hypothesis that vanadium-based contrast agents accumulate intracellularly and preferentially in cancers.
We imaged vanadium distribution with XFM at 120 minutes after VO(acac)2 injection to evaluate long-term intracellular accumulation of vanadium. Gadolinium distribution was sampled at 10 minutes after Omniscan injection due to its rapid washout. 18 The number of time points sampled and the number of mice studied were limited due to restrictions on time available at the Argonne Beamline. Denser temporal sampling of gadolinium and vanadium distributions in the microenvironment following contrast administration would likely contribute important additional information regarding differences between VO(acac)2 and Omniscan uptake, but this will require a much larger study.
The present study does not directly compare gadolinium and vanadium uptake in adenomas and normal-appearing colonic tissue in the same mice. Because of limitations on access to the beamline and concerns that AOM/DSS treatment may have affected contrast media uptake even in normal-appearing tissue, we did not select normal-appearing regions in AOM-treated mice for XFM scans. In future experiments, we plan to perform a larger number of XFM scans, including scans of normal-appearing areas on AOM/DSS-treated mice.
In the experiments discussed here, VO(acac)2 and Omniscan were injected into the same mice, to allow paired comparisons of the vanadium and gadolinium distributions. Interpretation of these data assumed that there was no interaction between VO(acac)2 and Omniscan. This is a reasonable assumption because Omniscan distributes passively in the extravascular, extracellular space, whereas the present results show that vanadium is taken up by cancer cells. Since Omniscan does not bind to specific targets, it is unlikely to interfere with vanadium uptake and vice versa.
XANES results show that the vanadium that accumulates in aberrant crypts is in the +4 oxidation state. This indicates that vanadium remains an effective MRI contrast agent after accumulation in tumor cells. The relatively high intracellular concentration, even at 120 minutes after a dose of 0.13 mmol/kg of body weight, is adequate to provide significant MRI contrast, assuming that the accumulation occurs within an MRI-detectable volume. The T1 relaxivity of VO(acac)2 is modest (0.25 s−1/mM at 9.4 T and approximately 0.6 s−1/mM at 3 T), 7 but given the long native T1 in cancers, vanadium would be detectable in voxels where the density of hot spots is high. The T1 of the gastrointestinal cancers studied here is 2.5 ± 0.3 seconds (D. Mustafi, unpublished results, 2010), and given standard dynamic contrast-enhanced MRI parameters (repetition time/echo time = 0.004/0.002 seconds; flip angle 15°), the concentration of vanadium detected in hot spots (≈ 1.6 mM) would decrease T1 by approximately 50% and produce signal enhancement of over 30% at 9.4 T, even at 120 minutes after injection. This is easily detected with a spoiled gradient echo imaging sequence 21 and with even greater sensitivity using a recovery-from-inversion sequence. Vanadium might be detected with even higher sensitivity at a lower field due to much higher relaxivity. In addition, this contrast agent has strong T2* relaxivity, 7 and T2* effects are likely to be especially pronounced given the heterogeneous distribution of hot spots with high concentrations of vanadium. It is likely that more enhancement would be detected at shorter times after vanadium injection.
Although the mechanism by which vanadium-based compounds enter cells from the extracellular space has not been established, previous studies suggest that VO(acac)2 and related compounds passively diffuse across lipid membranes into the intracellular space. 22 This passive diffusion has been observed in different cell types, including erythrocytes and CaCo-2 cells. 8 VCs interact strongly with intracellular proteins associated with glycolysis (e.g., IRS-1 and AKT), glycolytic enzymes,23,24 and possibly also glucose transporters. 9 Since these macromolecules are expressed at high concentrations within the cell, they provide a large number of intracellular binding sites for vanadium, particularly in cells with increased glycolytic activity. This supports the hypothesis that VO(acac)2 preferentially accumulates in cancer cells because they have increased glycolytic activity compared to nontransformed cells.
If vanadium uptake is a marker for metabolic activity, the present results suggest that most cells in the adenomas that were studied here were not hypermetabolic and that high rates of metabolism occurred only in small scattered regions, identified as hot spots, which could be identified based on vanadium accumulation. These regions may contain rapidly proliferating cells that are primarily responsible for cancer growth. This would be consistent with the theory that a small percentage of cells (stem cells) in cancers are primarily responsible for growth and invasion. 25 Future work will correlate vanadium distribution with more detailed and quantitative analysis of other elements on XFM, histology, and immunohistochemistry to determine the biological and physiologic characteristics of the hot spots that take up large amounts of vanadium.
Vanadium-based contrast agents could provide important advantages over PET by detecting hypermetabolic cancers while avoiding radioactivity and providing high-resolution anatomic information. In addition, vanadium-based compounds may inhibit cancer growth,26,27 and vanadium-enhanced MRI might be useful for guiding the therapeutic use of these compounds.
Footnotes
Acknowledgments
We thank Ms. Erica J. Markiewicz at The University of Chicago for technical assistance.
Financial disclosure of authors: This work was supported by grants from the National Institutes of Health (RO1-CA133490 and RO1-CA167785) and by a University of Chicago Cancer Comprehensive Center grant. Use of the Advanced Photon Source, an Office of Science User Facility operated for the U.S. Department of Energy (DOE) Office of Science by Argonne National Laboratory, was supported by the U.S. DOE under Contract No. DE-AC02-06CH11357.
Financial disclosure of reviewers: None reported.