
Abstract
Limited spatial resolution of preclinical positron emission tomography (PET) and single-photon emission computed tomography (SPECT) has slowed down applications of molecular imaging in small animals. Here we present the latest-generation U-SPECT system (U-SPECT+, MILabs, Utrecht, the Netherlands) enabling radionuclide imaging of mice with quarter-millimeter resolution. The system was equipped with the newest high-resolution collimator with 0.25 mm diameter circular pinholes. It was calibrated with technetium-99 m point source measurements from which the system matrix was calculated. Images were reconstructed using pixel-based ordered subset expectation maximization (OSEM). Various phantoms and mouse SPECT scans were acquired. The reconstructed spatial resolution (the smallest visible capillary diameter in a hot-rod resolution phantom) was 0.25 mm. Knee joint images show tiny structures such as the femur epicondyle sulcus, as well as a clear separation between cortical and trabecular bone structures. In addition, time-activity curves of the lumbar spine illustrated that tracer dynamics in tiny tissue amounts could be measured. U-SPECT+ allows discrimination between molecular concentrations in adjacent volumes of as small as 0.015 mL, which is significantly better than can be imaged by any existing SPECT or PET system. This increase in the level of detail makes it more and more attractive to replace ex vivo methods and allows monitoring biological processes in tiny parts of organs in vivo.
THE USE OF ANIMAL MODELS of human disease is essential for the development of new therapies and diagnostic methods. Modern small animal single-photon emission computed tomography/computed tomography (SPECT/CT) systems allow us to (1) visualize, quantify, and localize dynamic processes down to subcompartments of organs and tumors1–6; (2) perform those studies longitudinally; (3) reduce labor and the number of animals that need to be sacrificed compared to postmortem tissue distribution studies; and (4) perform simultaneous multiprobe imaging.7,8 However, the small size of the animals used for imaging with these systems (if compared to humans) poses enormous challenges to image resolution characteristics, in particular when uptake needs to be distinguished in small adjacent structures in vivo or at the suborgan or subtumor structural level. Multipinhole collimators, by exploiting a high magnification factor, have already shown that they enable imaging at approximately 0.35 mm resolution.9–12 At the same time, many applications of molecular imaging (e.g., cancer, brain, and orthopedic research) can still drastically benefit from the higher level of detalization in preclinical SPECT.
Continued research in molecular imaging, including the need to quantify processes in small parts of organs and tumors, requires the development of innovative scanners. Recently, MILabs (Utrecht, the Netherlands) launched the U-SPECT+/CT system as the successor of the U-SPECT-II/CT system. 12 It is equipped with a set of multipinhole mouse collimators with sensitivities ranging from approximately 350 cps/MBq (aimed at reaching the sub-half-millimeter resolution level) up to > 12,500 cps/MBq (for low dose but still allowing submillimeter resolution imaging). The system is advanced over its predecessor with regard to the mechanical accuracy of the robotic stage and the collimators. In addition, new spiral bed trajectories 13 for data collection have optimized sampling and enable faster scanning when compared to the stepwise multiplanar bed movement of the U-SPECT-II. The system matrix for image reconstruction was improved via the use of a more robust fitting procedure of the geometry of the system, which was implemented in VECTor+ software (MILabs) based on the methods described in van der Have and colleagues and Goorden and colleagues.14,15 In addition, detailed attenuation correction was added based on either optical or x-ray CT images to provide absolute quantification.16,17
The aim of the present article is to characterize the high-resolution capabilities of the U-SPECT+/CT system with its ultra-high-resolution pinhole collimators using phantoms and various scans of the mouse skeleton.
Materials and Methods
System Design and Collimator Geometry
U-SPECT+/CT (Figure 1A) contains three stationary large gamma-ray detectors (595 × 472 mm) with 3/8 inch (9.5 mm) thick NaI(Tl) crystals. The full width at half maximum (FWHM) energy resolution at the 140 keV technetium-99m (99mTc) photopeak is 9.5%. The exchangeable cylindrical pinhole collimators are placed in the center of the system. The mouse SPECT collimators used in the present study have five rings with either 0.25 mm (ultra-high resolution, type XUHR-M, MILabs), 0.35 mm (high resolution, type UHR-M), or 0.6 mm (general purpose, type GP-M) diameter pinholes. There are 15 pinholes per ring and 8° rotation in the pinholes' position between consecutive rings (Figure 1B). The inner diameter of the collimator (bore size) is 44 mm, and the distance from the center of the pinholes to the central axis is 24 mm. The 99% tungsten tube containing the pinholes is surrounded by an outer shielding tube that prevents projections through different pinholes from overlapping. The pinholes in the first, second, fourth, and fifth rings are tilted such that all pinholes are focused on a common region that can be reconstructed without any bed movement. The only moving part needed for SPECT acquisition is an automated robot arm with the animal bed connected to it that shifts the animal through the scanner during data acquisition in either a spiral trajectory or multiplanar stepwise mode. Shifting the bed during acquisition is needed only if the selected scan area is bigger than the focus region that is seen by all pinholes to ensure sufficient sampling conditions according to Orlov and Tuy18,19 throughout the scan volume. The way the scan area of interest (Figure 1C) is selected using a proprietary graphical user interface and three optical cameras is described in Branderhorst and colleagues. 20 These optical or x-ray preview images can also be used for performing postreconstruction attenuation correction.16,17
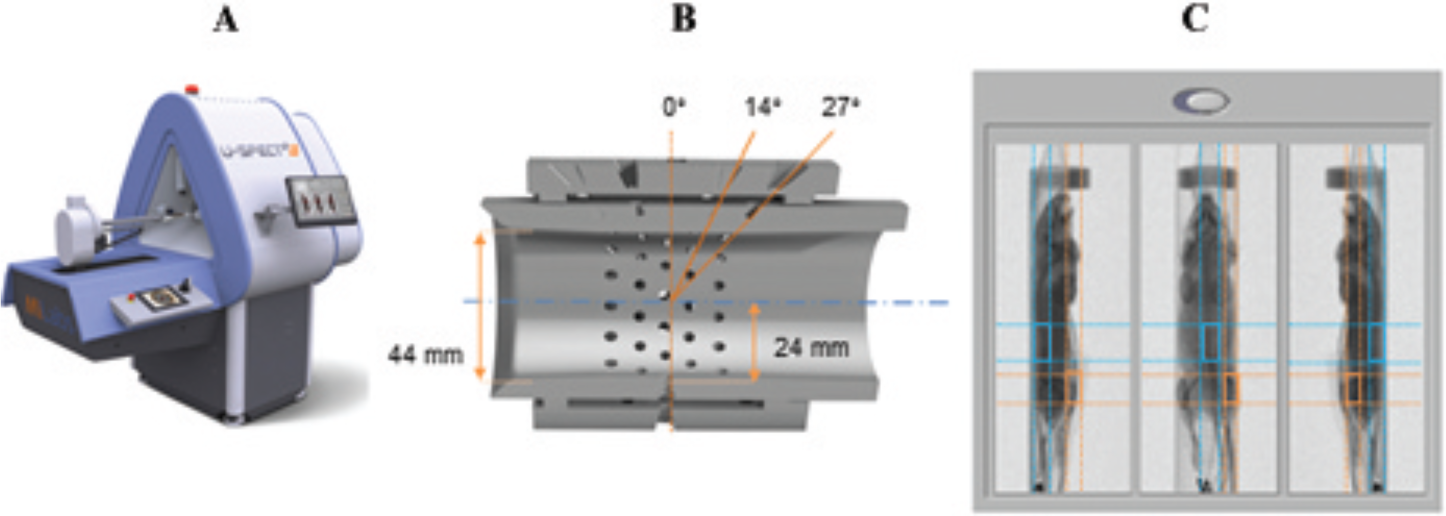
A, U-SPECT+/CT system. B, Cross section of a 75-pinhole mouse collimator with indicated inner diameter, distance from pinhole centers to the central axis, and tilt angle for different pinholes rings. C, Examples of an x-ray based scan area selection for knee joint (orange) and lumbar spine (blue) scans.
Image Reconstruction and Processing
Reconstruction of the images from list-mode projection data was performed with pixel-based ordered subset expectation maximization (OSEM). 21 It included resolution recovery and compensation for distance-dependent pinhole sensitivity. The system matrix was generated via a hybrid method based on both 99mTc point source measurements and analytical modeling.14,15 All images were reconstructed on an isotropic 0.125 mm voxel grid. Scatter correction was performed with the triple energy window (TEW) methods. 22 A 20% wide photopeak window and two 5% wide scatter windows on each side of the photopeak window were applied. In the focused 20 knee joint and lumbar spine studies (acquired within a small number of animal bed positions), 16 subsets and 32 iterations were used. Compared to focused scans, acquisition of a total body (TB) mouse scan requires a higher number of animal bed positions. When the same levels of tracer activity and acquisition times are used, TB imaging results in a lower number of emissions per voxel. Thus, to prevent erasure of low-activity image regions during pixel-based OSEM reconstruction as described in Vaissier and colleagues, 23 the number of subsets was decreased to 4 while 20 iterations were performed. Reconstructed images were filtered with a 0.15 mm FWHM gaussian kernel followed by cross-shaped 3 × 3 × 3 median filtering.
Phantom Studies
The sensitivity of the system with the 0.25 mm pinhole collimator was measured with a 99mTc point source produced in the way described in van der Have and colleagues. 12 The uniformity of reconstructed images was assessed with a syringe (diameter 15.9 mm, length 18 mm) filled with 18.65 MBq/mL 99mTc-pertechnetate and scanned for 90 minutes. The activity in the syringe was measured in a dose calibrator (VDC-304, Veenstra Instruments, the Netherlands). Reconstructed images were corrected for attenuation and scatter.16,17
The reconstructed spatial resolution was determined as the minimal diameter of rods that can be visualized in a hot-rod resolution phantom with six pie-shaped sectors containing rods with equal rod sizes within each sector (0.22, 0.25, 0.3, 0.35, 0.4, and 0.5 mm). In each section, the distance between the capillaries equals the capillary diameter in that section. The phantom was filled with 60 MBq 99mTc-pertechnetate (about 0.05 mL) and consequently scanned for 90, 108, and 126 minutes (to compensate for the decay) with collimators with 0.25, 0.35, and 0.6 mm pinholes, respectively.
Animal Scans
The animal experiments were performed with three C57Bl/6 mice according to protocols approved by the Animal Ethical Committee of the University Medical Center Utrecht and in accordance with Dutch law on animal experimentation. All animals were anesthetized with isoflurane. For all scans, radioactive tracers were administered via injection in the tail vein, except for the lumbar spine scan, for which radiotracer was administered via a catheter in the tail vein.
Bone Scans
TB Scan
The mouse was injected with 330 MBq of 99mTc-methylene diphosphonate (MDP). Half an hour after the injection, 90-minute SPECT scanning started.
Images were reconstructed and filtered as described in the image reconstruction and processing section, and the bladder of the animal was manually cropped from the volume. Maximal intensity projections (MIPs) were generated using PMOD 3.4 software (Pmod Technologies Ltd, Zurich, Switzerland).
Focused Scans
The first mouse used for focused scanning 20 was injected with 340 MBq of 99mTc-MDP. Half an hour after the injection, 90-minute SPECT scanning with pinholes focusing on the knee joint started.
The second mouse was injected with 330 MBq 99mTc-hydroxydiphosphonate (HDP). Dynamic, 1-minute frame SPECT scanning, with the pinholes focused on the lumbar spine area, started just after the injection. Acquisition continued for 90 minutes.
After the acquisition, the mice were euthanized and the knee joint and lumbar spine areas were scanned postmortem in a separate ultra-high-resolution CT scanner (Quantum FX, PerkinElmer, Waltham, MA) using a 20 μm resolution setting. After image reconstruction and filtering, MIPs were generated.
Results
Phantom Studies
The sensitivity at the center of the collimator was determined to be 380 cps/MBq with a 99mTc point source. Figure 2A shows a 6 mm thick slice from the hot-rod resolution phantom scans with 99mTc for the collimators with 0.25 mm, 0.35 mm, and 0.6 mm pinholes. In terms of minimal visible rod diameters, the 0.25 mm pinhole collimator reaches 0.25 mm resolution, the highest among the collimators compared. At the same time, both the collimators with 0.35 and 0.6 mm pinholes showed improvement in image resolution for U-SPECT+ from 0.35 to 0.3 mm and from 0.4 to 0.4 to 0.35 mm, respectively, compared to U-SPECT-II. 12

A, Reconstructed SPECT image of a hot-rod phantom for 0.25 (1), 0.35 (2), and 0.6 (3) mm pinhole (PH) collimators. Minimal visible rod diameters are 0.25, 0.3, and 0.4 mm, respectively. B, Results of a uniformly filled cylinder 99mTc phantom scan for a 0.25 mm pinhole collimator. Top, 3 mm thick axial and vertical slices; bottom, line profiles through the phantom, drawn as indicated on the slice's images. The activity concentration measured in the dose calibrator is indicated with orange lines on the line profile plots. C, Line profile plot through the 0.25 mm rod segment (bottom) of the resolution phantom, drawn as indicated on the resolution phantom image (top). FWHM = full width half maximum.
Figure 2B shows 3 mm thick slices of the reconstructed syringe image from which 3 mm wide line profiles were extracted. The activity concentration of 99mTc measured in the dose calibrator (“gold standard”) is indicated with an orange line on the profile plots. The difference between the average activity concentration in the syringe was calculated from the reconstructed image volume,16,17 and the “gold standard” was 0.32 MBq/mL or 1.7%. Figure 2C shows a 6 mm thick slice of the resolution phantom scan with the 0.25 mm pinhole collimator from which the line profile (bottom) was extracted for the 0.25 mm rod segment (as indicated with an orange line). The average center-to-center distance for two neighboring rods was 0.52 ± 0.03 mm.
Bone Imaging
Mouse TB Scan
Figure 3 shows side- and top-view MIPs of the TB mouse SPECT scan. Bone turnover takes place in the skeleton at a low (physiologic) level, which leads to a free calcium surface that can bind the 99mTc-MDP tracer. The images provide a great level of detail that allows us to distinguish small anatomic skeletal structures. The ribs of the mouse that are usually just partially visualized in TB scans can now be fully seen, even in the false and floating ribs region. The animal's sternum (zoomed left) is fully visible with clear separation of the individual sternebra bones up to the xiphisternum ending. Scapulae and clavicles (zoomed top right) are completely shown, and the blades on both scapulae can also be distinguished. In the pelvis area (zoomed in the bottom right), the ilium, pubis, and sacrum show many anatomic structures.
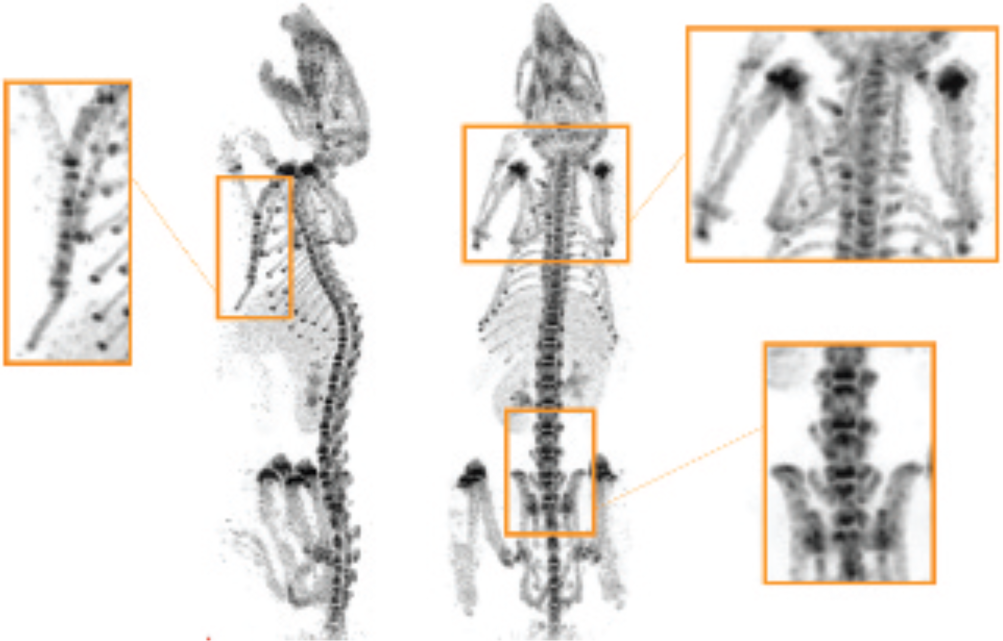
Side and top views on maximum intensity projections of a mouse 99mTc-MDP total body SPECT scan. The zoomed image of the pelvis shows the detailed structure of the ilium, pubis, and sacrum. The thoracic cage area shows tiny details such as floating ribs, clavicles, and scapula blades that are usually blurry but now can be seen very clearly. Even in the sternum (zoomed left), all separate sternebrae and the manubrium and xiphisternum bones can be distinguished.
Mouse Knee Joint SPECT
Figure 4 represents sagittal-medial (left), coronal-anterior (middle), and sagittal-lateral (right) view MIPs of SPECT (top) and micro-CT (bottom) scans. The figure shows that it is possible with SPECT to clearly visualize bone turnover in not only all the structural bones in the joint but also their substructures, such as the linea epiphysialis 7 and inter-condylar tuberculum of the tibia, 10 the epicondylars in the femur, 12 the apex capitis fibulae, 16 the corpus fibulae, 5 and many other structures.

Maximum intensity projections (MIPs) of focused mouse knee joint SPECT and corresponding microCT scans. The images provide a high level of anatomic details, such as 1 = corpus femoris; 2 = patella; 3 = tibia, condylus medialis; 4 = corpus tibiae; 5 = corpus fibulae; 6 = basis patellae; 7 = linea epiphysialis; 8 = tuberositas tibiae; 9 = sesamoid bone; 10 = tuberculum intercondylare laterale; 11 = growth plate; 12 = epicondylus lateralis; 13 = facies poplitea; 14 = fossa intercondylaris; 15 = tibia, condylus lateralis; and 16 = apex capitis fibulae.
Figure 5 shows axial and sagittal slices of SPECT, CT, and fused SPECT/CT images through the mouse knee joint. These image modalities can be compared in terms of the visible level of details in the joint anatomy and in terms of correlations between the bone density from CT and the intensity of the signal in the SPECT images. Sagittal slices 6 to 8 demonstrate that a SPECT scan allows a clear anatomic distinction between the cortical bone, the trabecular bone, the growth plate, and the medullary cavity. Axial slices 1 to 5 confirm the correspondence in shape between SPECT and CT for the patellar surface contours (1) and higher uptake regions on the condyle surface cuts just under the growth plate (2 and 3) of the femur, the tuberosity of the tibia and the apex of fibula (4 and 5).

Axial (left) and sagittal (right) slices (slice thickness 0.3 mm) of a focused mouse knee joint 99mTc-MDP SPECT scan and corresponding microCT and fused SPECT/CT scans. Circles illustrate correlation in small anatomic details that are visible in both modalities, for example, patella (1), distal femur condyle cuts (2), sesamoid bone (3), fibula apex (4–5), trabecular (6) and cortical (7, top) bone, growth plate (7, bottom), and medulla cavity (8) inner bone structures.
Mouse Lumbar Spine SPECT
Lumbar spine SPECT was performed focusing on the L1–L4 segments of the backbone using two bed positions. Time-activity curves (TACs) were generated for manually drawn volumes of interest (Figure 6A) using decay-corrected but otherwise unprocessed images, reconstructed as a 1-minute frame sequence. Quantification of the curve was done using a scaling factor obtained from the 99mTc uniformly filled cylinder scan.16,17

Images of focused L1–L4 vertebrae 99mTc-HDP SPECT (top) and microCT (bottom) lumbar spine scans. A and B, Corresponding sagittal and axial slices (slice thickness 0.375 mm, level of L4 segment). C, Time-activity curves of HDP uptake by individual vertebrae. On axial cross sections, it is possible to distinguish all the anatomic components of lumbar vertebrae, such as 1 = spinous process; 2 = superior process articular; 3 = transverse process; and 4 = body.
Figure 6, A and B, shows 0.375 mm thick slices of anatomic cross sections for the HDP (top) and CT (bottom) scans. The axial view (see Figure 6B) at the level of the L4 vertebra shows that it is possible to visualize the uptake of a tracer in all the basic structural parts of the lumbar vertebrae, such as the spinous processes, the superior articular processes, the transverse process, and the vertebral body. The sagittal cross sections demonstrate full separation between the vertebra bodies on SPECT images; regions with higher uptake correlate with corresponding positions of the growth plates on CT. As one can see from the TAC (Figure 6C), there is a time shift in the position of the HDP uptake peaks for different vertebrae. Because the peak itself refers to the first passing of activity through veins, arteries, and capillaries that are lying close to or inside the vertebrae, such a difference in time due to a slight difference in distance from the place of injection in the tail vein to the particular lumbar spine region was expected. Also, the absolute uptake in the L1–L4 vertebrae is supposed to rise with an increase in vertebra size, and this can be seen on the TACs.
Discussion
In preclinical SPECT, the performance characteristics of the system strongly depend on the collimator design. In cases when an ultra-high resolution needs to be achieved, the use of focusing collimators with small pinholes gives an appropriate resolution sensitivity trade-off, particularly when large enough detectors can be used to provide high pinhole magnification. The current study evaluated the high-resolution capabilities of the U-SPECT+ system and initial applications of its new 0.25 mm ultra-high-resolution collimator.
The resolution phantom scans that were performed demonstrated that the system provides an improvement in image resolution (in terms of minimal visible rod diameter) for the already previously launched 0.35 mm high-resolution (from 0.35 to 0.3 mm) and 0.6 mm general-purpose (from 0.4 to ≈ 0.35 mm) collimators. 12 With the ultra-high-resolution collimator with 0.25 mm diameter pinholes down to 0.25 mm, reconstructed spatial resolution can be achieved. In combination with the scanning focus principle and a dedicated graphical user interface, 20 this resolution can in principle be reached in any part of the body (centrally and peripherally). Due to the relatively low sensitivity of the collimator, the average activity amount that was used for SPECT scans was 333 MBq (9 mCi). For the 99mTc-MDP tracer, this results in 44 cGy total body dose24,25 for a 30 g mouse. This is still 20 times below the lethal dose (LD)50/30 (approximately 9 Gy for C57BL/6) 26 yet already cannot be neglected. Considering the fact that the dose rate of SPECT scans performed is lower than 0.28 cGy/min, the influence of the exposure on the cell survival rate is still expected to be small. 27 The activation of some cell cycle–regulating genes will take place already from as low as 2 cGy 27 in a dose rate–independent manner, gradually increasing with an increase in the accumulated dose. Thus, depending on the type of study, this collimator may often be more suitable for single animal scans or a final high-resolution scan in a follow-up imaging sequence rather than for repetitive injection and scanning in longitudinal studies. A dose that would be 10 times lower would eliminate this problem.
To emulate this and to be able to compare images one to one with exact spatiotemporal registration, we performed a reconstruction using 10% of the counts extracted from the list-mode data (Figure 7). This scan represents an equivalent of a 34 MBq scan or 4.4 cGy dose. The reconstruction presented in Figure 7 was post filtered with a slightly wider 3D gaussian kernel of 0.35 mm and compared to the corresponding 100% count images. It can be appreciated that a 10-fold reduced dose results in more noise, mainly visible in the distal part of the bones with low tracer uptake (e.g., femur and tibia corpus, patella), yet still provides a very high level of detail in high specific uptake areas of the joint (e.g., femur and tibia condyles, growth plate, fibula apex). Hence, in cases where either the acquisition time can be sufficiently long or the uptake of the tracer is well localized and specific, as in the case of bone imaging with 99mTc-MDP and -HDP tracers, we have shown that it is possible to take advantage of very high-resolution pinhole collimation.
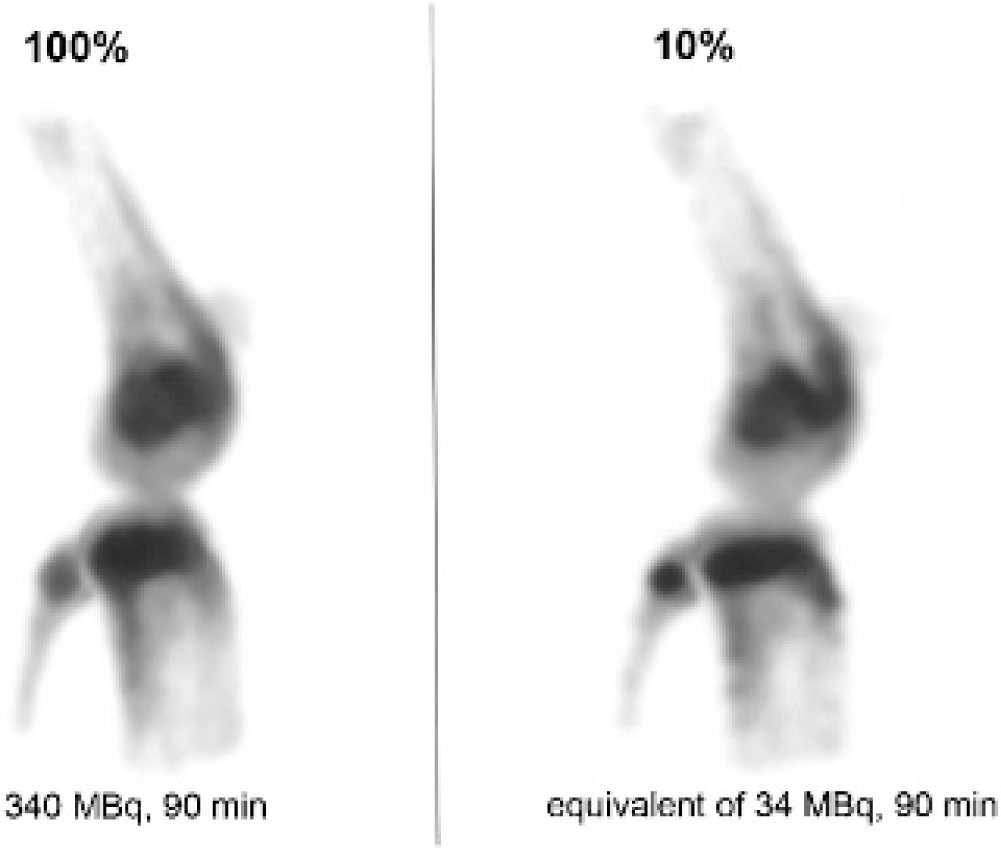
Maximum intensity projections of a focused mouse knee joint SPECT scan. Images were reconstructed using 100% and 10% of available counts from the list-mode data and emulating the difference in image quality for 340 and 34 MBq 99mTc-MDP 90-minute focused mouse knee joint scans, respectively.
The level of detail that our results have shown in bone SPECT indicates that, in some cases, the need for additional anatomic imaging may be less important. Other examples where we see accurate anatomic information from SPECT only are reported in Befera and colleagues (for cardiac imaging) 6 and in Zhou and colleagues and Branderhorst and colleagues (for tumor imaging).3,5 The TB scans performed in the present study showed that U-SPECT+ equipped with the new ultra-high-resolution collimator detects bone turnover in the entire skeleton in great detail. When finer analysis is needed, focused imaging can be performed (see Figure 4, Figure 5, and Figure 6). The level of detail visible with focused knee joint and lumbar spine scans provides both functional information in tiny structures and a high level of anatomic detail. However, we should also take into account that resolution of in vivo SPECT images can be hampered by animal motion (e.g., respiration or heart beating). In case of scans of, for example, the lower limb or pelvis area, the influence of motion-related resolution degradation is expected to be small. At the same time, images of the animal skeleton and inner organs that are closer to the rib cage and cardiac scans will certainly require motion correction with, for example, the aid of respiratory and/or ECG gating to obtain optimal submillimeter image resolution. 6 Thus, although the TB scan in this study resulted in a high level of details in the thorax, we assumed that it would have been possible to image finer anatomic structures if respiration gating would have been performed. The extent of image improvements is the subject of future investigations.
Conclusion
This article has introduced the latest version of U-SPECT preclinical scanners. Phantom studies show that this system (U-SPECT+), when equipped with an ultra-high-resolution collimator with 0.25 mm diameter circular pinholes, enables quantitative imaging of molecular uptake down to a quarter of a millimeter resolution (approximately 0.015 μL volumetric resolution) in mice. The possibility of performing in vivo molecular imaging with the level of detail as illustrated in several bone scans opens new possibilities for ultra-high-resolution SPECT studies.
Footnotes
Financial disclosures of authors: Freek J. Beekman is a founder, shareholder, and part-time board member of MILabs. Frans van der Have is a shareholder of MILabs. Oleksandra Ivashchenko, Ruud M. Ramakers, Havald C. Groen and Jose L. Villene are employed by MILabs. The research leading to these results received funding from the People Programme (Marie Curie Actions) of the European Union's Seventh Framework Programme (FP7/2007-2013) under REA grant agreement no. PITN-GA-2012-317019 ‘TRACE 'n TREAT.’
Financial disclosure of reviewers: None reported.