
Abstract
The purpose of this study was to investigate the expression of glutamine synthetase (GS) in prostate cancer (PCa) and the utility of [13N]ammonia positron emission tomography/computed tomography (PET/CT) in the imaging of PCa. The uptake ratio of [13N]ammonia and the expression of GS in PC3 and DU145 cells was measured. Thirty-four patients with suspected PCa underwent [13N]ammonia PET/CT imaging, and immunohistochemistry staining of GS was performed. The uptake of [13N]ammonia in PC3 and DU145 cells elevated along with the decrease in glutamine in medium. The expression of GS messenger ribonucleic acid and protein also increased when glutamine was deprived. In biopsy samples, the GS expression scores were significantly higher in PCa tissue than in benign tissues (p < .001), and there was a positive correlation between the maximum GS expression scores and Gleason scores (Spearman r = .52). In 34 patients, [13N]ammonia uptake in PCa segments was significantly higher than that in benign segments (p ≤ .01), and there was a weak correlation between GS expression scores and the uptake of [13N]ammonia (Spearman r = .47). The expression of GS in PCa cells upregulated along with the deprivation of glutamine. GS is the main reason for the uptake of [13N]ammonia, and [13N]ammonia is a useful tracer for PCa imaging.
EARLY DETECTION and accurate evaluation of prostate cancer (PCa) are beneficial for proper management. 1 Since PCa is a complex and biologically heterogeneous disease, it is not adequate to evaluate it with conventional imaging modalities such as ultrasound imaging and magnetic resonance imaging (MRI).2,3 Nowadays, molecular imaging targeting specific biomarkers or metabolic pathway has been recognized as having great potential in the detection and evaluation of PCa.4–6
Recently, pathologic results have revealed that nuclear overexpression of MYC, which occurs mostly in advanced disease, is a highly prevalent and early change in PCa.7,8 This is believed to be crucial in the initiation and progression of PCa. As a master regulator of cell metabolism and proliferation, MYC enhances mitochondrial glutaminase through the suppression of miR-23. 9 In tumor cells, glutamine is crucial for survival as it contributes to the production of adenosine triphosphate (ATP), the biosynthesis of biological macromolecules, and the modulation of redox homeostasis. 10 Many oncologists have pointed out that enhanced glutamine metabolism is another potential target for tumor imaging and therapy.11,12
Molecular imaging researchers have focused on glutamine metabolism for a long time, and great progress has been made. But much attention has been paid to glutamine uptake from plasma medicated by glutamine transporters.13,14 In fact, many tumor cells not only obtain glutamine from plasma but also synthesize glutamine for themselves. Biological studies have demonstrated that avid mitochondrial glutaminase could decrease the intracellular glutamine concentration that, in turn, upregulates the expression of glutamine synthetase (GS) effectively.15–17 GS is the only enzyme in the human body capable of synthesizing glutamine from ammonia and glutamate. Its upregulation, like elevated expression of glutamine transportors on membrane, is also widely interpreted as a reflection of avid glutamine metabolism in tumor cells.16–18
[13N]Ammonia is widely used as a tracer for the measurement of myocardial blood perfusion. In normal physiologic conditions, blood ammonia exists mainly in the forms of free base (NH3) and ionized species (NH4+), and they are in equilibrium as the reaction NH4+ ↔ NH3 + H+. NH3 is lipid soluble and has small molecular weight, making it diffuse readily across membranes. 19 In extrahepatic tissues, [13N]ammonia is trapped predominantly in the form of [13N]glutamine, and this synthetic reaction is catalyzed by GS.20,21 Since GS is the main reason for the metabolic trapping of [13N]ammonia in extrahepatic tissues, its upregulation in glutamine-addicted tumors might be a potential target for [13N]ammonia imaging. As a result, we designed this study to investigate the utility of [13N]ammonia in the imaging of PCa, which is MYC transformed and glutamine addicted.
Materials and Methods
Cell Line and Cell Culture
The human PCa line PC3 and DU145 cells were obtained from the Institute of Biochemistry and Cell Biology, Chinese Academy of Sciences (Shanghai, China). Cells were maintained in RPMI 1640 medium (Gibco, USA) supplemented with 10% fetal calf serum (Hyclone, USA) and were incubated at 37°C in humidified air containing 5% CO2. Cells were routinely passaged at confluence.
Preparation of [13N]Ammonia
In this study, [13N]ammonia was prepared in our department with a medical cyclotron (IBA Cyclone 10/5, Belgium). At first, 13N was generated based on the 16O(p,α)13N reaction, and sterile water was used as a target. Then [13N]ammonia was synthesized by reducing 13NO3− with Devarda alloy. 22 After filtration through a 0.22 μm membrane, [13N]ammonia can be used directly in cell uptake studies or PET/CT studies.
Cell Uptake Assay
PC3 and DU145 cells were plated in culture medium containing various initial concentrations of glutamine (0, 0.25, 0.5, 1, or 2 mmol/L) for 48 hours before studies. To determine the role of GS in the uptake of [13N]ammonia, 2 mmol/L L-methionine sulfoximine (L-MSO) (Aladdin, China) was added into the culture medium. Furthermore, cells that had been maintained in glutamine-deprived culture medium (0, 0.25, 0.5, or 1 mmol/L) for 48 hours were then passaged to another pallet with full glutamine medium for another 48 hours. Each experiment was performed three independent times, and each glutamine condition had three replicates.
On the day of uptake experiments, [13N]ammonia was added to each well (370 kBq/mL/well); then the cells were incubated at 37°C for 10 minutes. At the end of the incubation period, the medium was aspirated, and the cells were washed three times with 1 mL of ice-cold phosphate-buffered saline. Then 350 mL of 1N NaOH was used to lyse the cells. The lysed cells were collected and counted together with samples of the initial dose using a gamma counter. One hundred microliters of the cell lysate was used for determination of the protein concentration by a modified Lowry protein assay. The data were normalized as percent uptake of the initial dose relative to 100 μg of protein content.
Western Blot Analysis
After being incubated under various glutamine concentrations (0, 0.25, 0.5, 1, or 2 mmol/L) for 48 hours, PC3 or DU145 cells were collected and lysed for protein extraction. The protein content was determined using the modified Lowry protein assay, and then 40 μg samples of protein were used. Samples were resolved under reducing conditions by 10% sodium dodecyl sulfate polyacrylamide gel electrophoresis (SDS-PAGE) for the detection of GS protein. Following fractionation, the gels were electrophoretically transferred onto nitrocellulose transfer membranes. After blocking with 5% nonfat powdered milk, the membranes were incubated at 4°C overnight with GS rabbit polyclonal antibody (Abcam, England) at 1:1,000 dilution in Tris-buffered saline and Tween 20 (TBS-T) containing 1% nonfat dry milk. Mouse monoclonal antibody for glyceraldehyde-3-phosphate dehydrogenase (GAPDH) was used as an internal positive control. The secondary antimouse horseradish peroxidase–conjugated antibodies were applied at a dilution of 1:5,000. Bands were visualized by the enhanced chemiluminescence method. The relative intensity of each sample was normalized with GAPDH.
Reverse Transcriptase Polymerase Chain Reaction Analysis
The primer sequences for GS sense and antisense were 5′-GAGGCCATTGAGAAACTAAGCA-3′, and 5′-GTCGTTGATGTTGGAGGTTTCA-3′ respectively. Housekeeping gene 18s ribosomal ribonucleic acid (rRNA) was used as an internal control, and the primer sequence was used for 18srRNA sense, 5′-CCTGGATACCGCAGCTAGGA-3′, and antisense, 5′-GCGGCGCAATACGAATGCCCC-3′. Total RNA was extracted with the Trizol reagent (Invitrogen, USA) and reverse transcribed to complementary DNA (cDNA) using a reverse transcription system (Promega, USA). Then 1 μL of cDNA was combined with primers and SYBR Green qPCR SuperMix (Invitrogen). The polymerase chain reaction (PCR) conditions included 40 cycles of 50°C for 2 minutes, 95°C for 2 minutes, 95°C for 15 seconds, and 60°C for 32 seconds on a fast Real-Time PCR System (ABI PRISM 7500, USA). Threshold cycle (CT) values were determined by reverse transcriptase PCR and normalized by 18srRNA.
Patients and PET/CT Imaging
Between February 2012 and May 2013, 34 consecutive patients with suspected PCa were enrolled in this study. Twenty-seven of them were finally proven to have PCa, and the remaining seven patients had benign prostatic hyperplasia (BPH). Detailed information on all patients is shown in Table 1. Biopsy was performed after [13N]ammonia PET/CT imaging, and a systematic biopsy scheme was chosen based on all the imaging results. Every core was placed into a container labeled with the location of the biopsy and was reviewed at a central pathology laboratory. The study was approved by the hospital ethics committee, and each individual participating in the study gave informed consent.
Clinical Characteristics and Histologic Biopsy Results on a Sextant Basis of 34 Patients

La = left apex; Lb = left base; Lm = left middle; PSA = prostate-specific antigen; Ra = right apex; Rb = right base; Rm = right middle.
PET scanning was performed using a GEMINI GXL-16 PET/CT scanner (Philips, Netherlands). PET images were acquired with the patients in the supine position. A dose of 555 to 740 MBq of [13N]ammonia was injected intravenously. Three to four bed positions from the upper pelvis through the middle thigh for 1.5 minutes at each position were acquired 5 to 10 minutes after the injection. The parameters of the multidetector helical CT scan were 120 kV, 50 mAs, 0.8 seconds per tube rotation, and a slice thickness of 5 mm. CT images were used for both attenuation correction of emission data and image fusion.
Analysis of [13N]Ammonia PET/CT
Images were interpreted with dedicated PET/CT review software, which allows simultaneous scrolling through the corresponding PET, CT, and fusion images in transverse, coronal, and sagittal planes. At first, PET/CT images were assessed by two experienced nuclear physicians who were blind to the pathologic results. Positive results were defined as mono- or multifocal [13N]ammonia uptake in the prostate gland as significantly higher than [13N]ammonia uptake in periprostatic muscles. Coronal and sagittal CT images were recruited to differentiate prostatic [13N]ammonia uptake from urethra, bladder, and rectum activity.
For comparison between transrectal ultrasonography (TRUS)-guided biopsy results and [13N]ammonia imaging results, the prostate gland was divided into sextants: right apex, right middle, right base, left apex, left middle, and left base. The base slice was defined as the upper third of the prostate (the thick of a slice was 5 mm), extending from the bladder margin, the middle slice was defined as the central third, and the apex slice was defined as the inferior third. Then the maximum standardized uptake value (SUVmax) of each segment was determined and was compared to the TRUS-guided biopsy results.
Immunohistochemistry
For the first 24 consecutive patients, the standard sextant samples were employed for GS immunostaining. Immunohistochemistry was performed with the Dako catalyzed signal amplification kit (DAKO Cytomation, Carpinteria, CA). Slides were steamed for 40 minutes in ethylenediaminetetraacetic acid (EDTA) solution for antigen retrieval. Slides were incubated with the mouse monoclonal anti-GS, an antibody to GS (1/150 dilution; BD Biosciences), overnight at 41°C. Staining was visualized using 3,3′-diaminobenzidine (DAB), and slides were counterstained with hematoxylin. The GS staining was evaluated by semiquantitative analysis. At first, the percentage of positively stained cells was estimated. All cells with cytoplasm staining of any intensity were defined as positive, and a score was designated to indicate the expression percentage (negative: score 0; < 20%: score 1; 20–50%: score 2; 50–80%: score 3; > 80%: score 4). On the other hand, the expression intensity was assessed according to the staining color, and another score was designated (negative: score 0; pale yellow: score 1; brown yellow: score 2; brown: score 3). Finally, the GS expression was quantified by the multiplication of the above two scores, which ranged from 0 to 12. For each sample, five separate eyepiece fields were chosen for the evaluation of staining, and the average of these five scores was used.
Statistical Analysis
Statistical analysis was performed by SPSS software (SPSS Inc., Chicago, IL). Data were considered statistically significant when the p value was less than .05.
Results
Uptake of [13N]Ammonia in PC3 Cells
With the increase in glutamine concentration from 0 to 2 mmol/L in medium, the uptake ratios of [13N]ammonia in both PC3 and DU145 cells decreased in a dose-dependent manner (Figure 1). After the addition of L-MSO, the maximum uptake ratio of [13N]ammonia in both PC3 and DU145 cells was about 0.002% per 100 μg protein. The amount of [13N]ammonia trapped in cells decreased by over 99%.

The uptake ratios of [13N]ammonia in PC3 and DU145 decreased along with the increase in glutamine concentration.
In the second part of the uptake studies, PC3 and DU145 cells that had been maintained in glutamine-deprived culture medium (0, 0.25, 0.5, or 1 mmol/L) for 48 hours were then transferred to another pallet with full glutamine medium (2 mmol/L) for another 48 hours. The recovery of glutamine in medium decreased the uptake of [13N]ammonia effectively after 48 hours' incubation (p < .001) (Table 2).
Uptake Results (%dose/100 μg protein) of [13N]Ammonia in PC3 and DU145 Cells
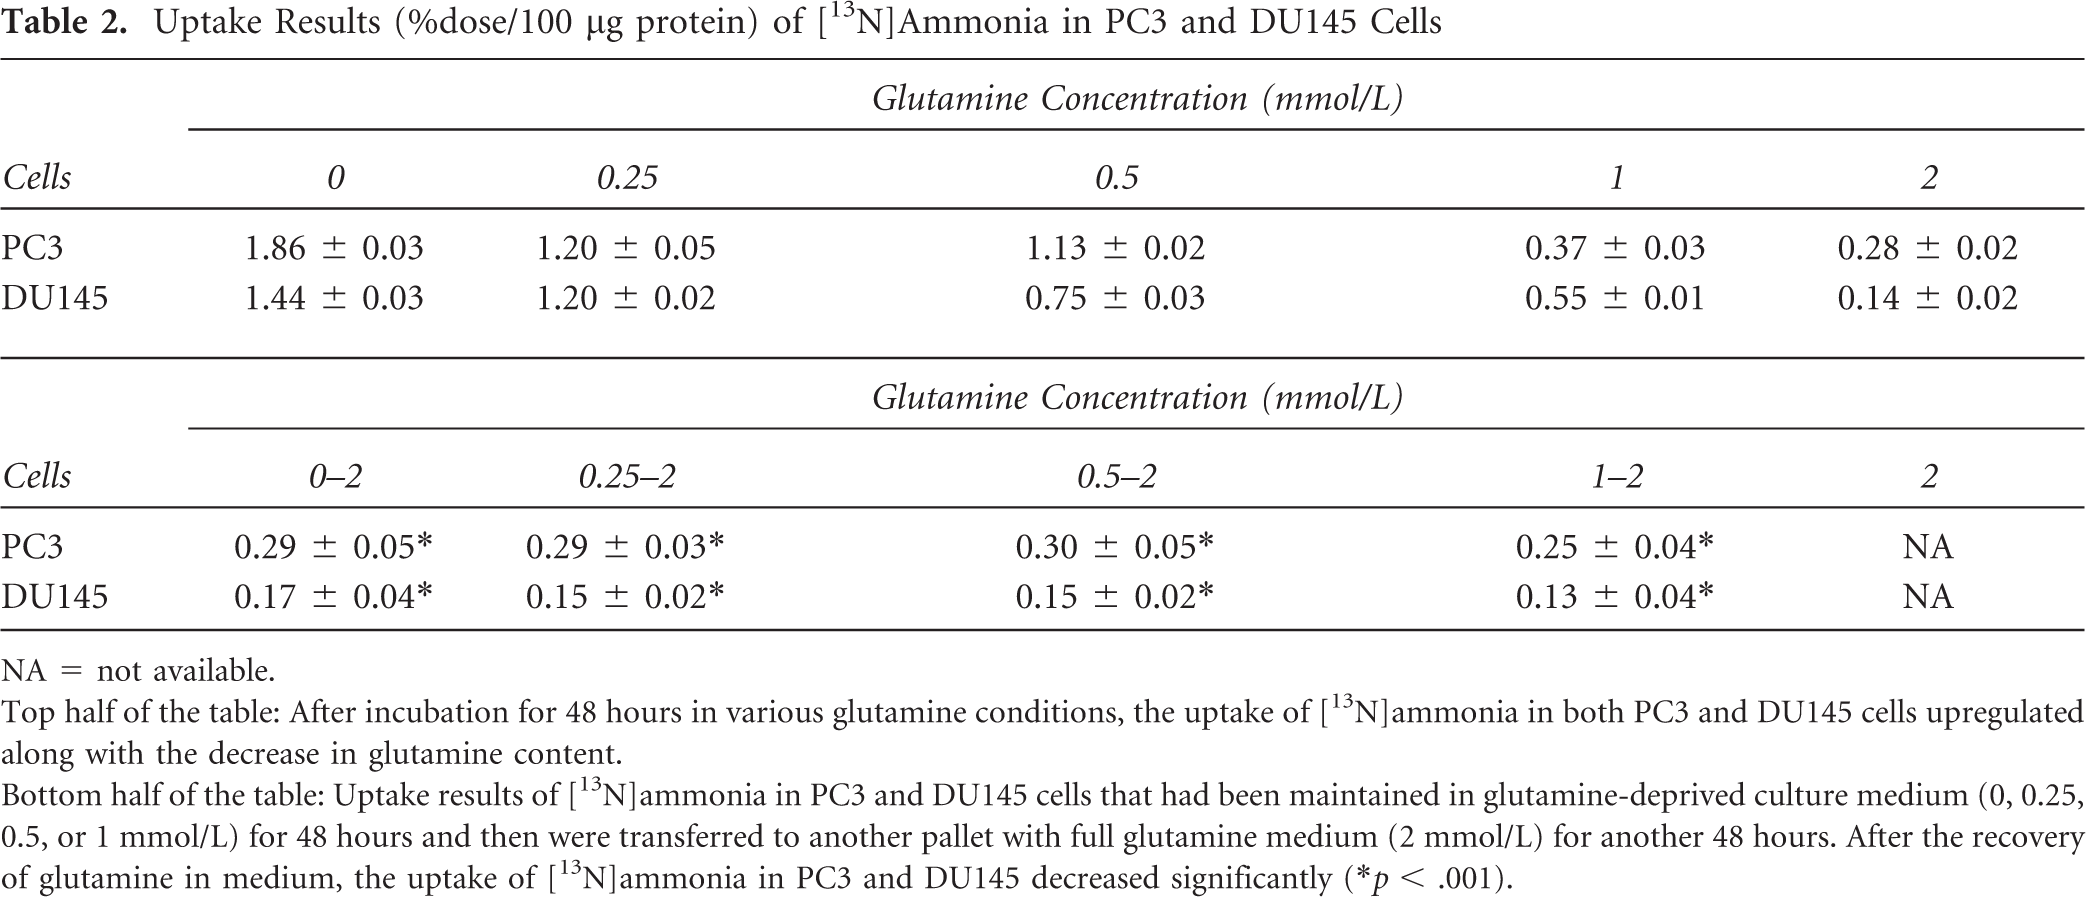
NA = not available.
Top half of the table: After incubation for 48 hours in various glutamine conditions, the uptake of [13N]ammonia in both PC3 and DU145 cells upregulated along with the decrease in glutamine content.
Bottom half of the table: Uptake results of [13N]ammonia in PC3 and DU145 cells that had been maintained in glutamine-deprived culture medium (0, 0.25, 0.5, or 1 mmol/L) for 48 hours and then were transferred to another pallet with full glutamine medium (2 mmol/L) for another 48 hours. After the recovery of glutamine in medium, the uptake of [13N]ammonia in PC3 and DU145 decreased significantly (*p < .001).
GS Messenger Ribonucleic Acid Expression and Protein Levels
Along with the decrease in glutamine concentration in culture medium, the relative expression of GS messenger ribonucleic acid (mRNA) or protein upregulated in a dose-dependent manner in both PC3 and DU145 cells (Figure 2). After being incubated in glutamine-free medium for 48 hours, the PC3 cells had an approximately six times increase in GS mRNA expression, whereas the DU145 cells had a five times increase.

Relative glutamine synthetase (GS) messenger ribonucleic acid (mRNA) or protein was measured in PC3 and DU145 cells. 18srRNA or GAPDH served as reference mRNA or protein. In both PC3 and DU145 cells, the expression of GS mRNA or protein decreased along with the supplement of glutamine in medium.
GS Expression in Patient Biopsy Samples
GS expression scores of 144 samples from the first 24 patients were analyzed, of which 84 were carcinoma samples, 52 BPH, and 8 prostatitis. The high expression of GS protein in PCa was a frequent event, and this protein was expressed nearly exclusively in the cytoplasm (Figure 3). For each patient with both PCa and BPH tissue, the GS expression in carcinoma samples was obviously higher than that in BPH and prostatitis tissues (see Figure 3D). However, the expression of GS in PCa varied widely among patients, with the expression score ranging from 1.4 to 12 (7.76 ± 2.57). In BPH and prostatitis samples, the GS expression scores were 3.98 ± 2.60 (range 1–11.4) and 3.34 ± 0.36 (range 2.6–3.6), respectively, which were significantly lower than that of PCa (p < .001) (Figure 4A). There was no difference in GS expression between BPH and prostatitis samples (p = .26). In 18 patients with PCa, there was a positive correlation between the maximum GS expression score and Gleason score (Spearman r = .52) (Figure 4B).
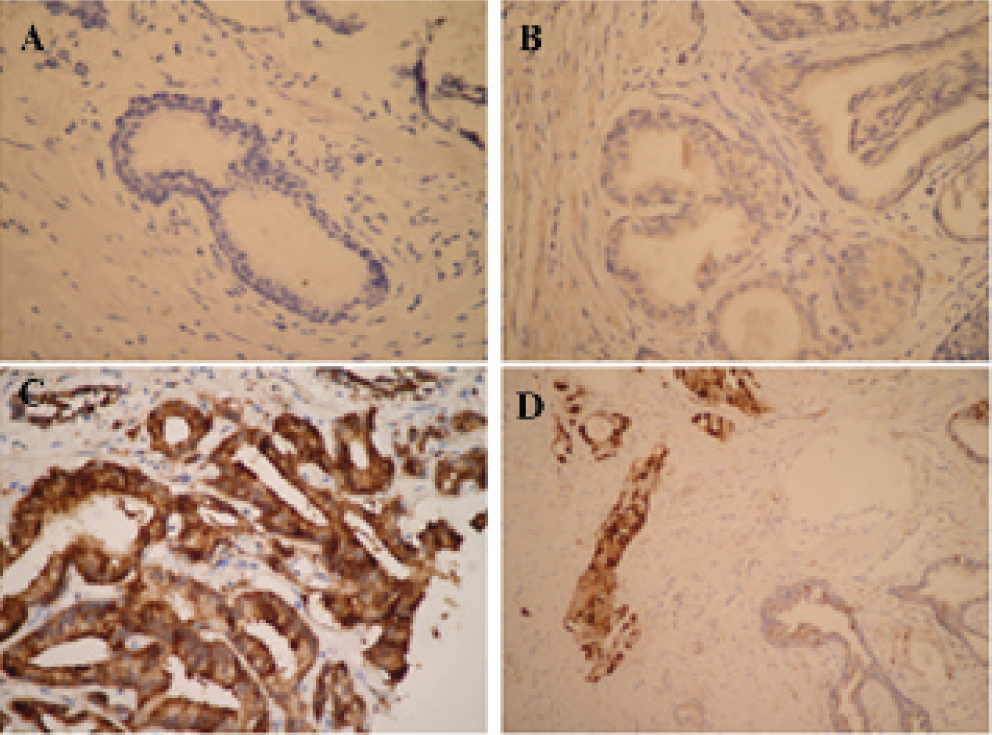
Human prostate tissues stained with anti–glutamine synthetase (GS) antibody. No GS staining in a normal gland in a benign prostatic hyperplasia (BPH) patient (A), low expression of GS in BPH (B), and high expression of GS in primary prostate cancer (C). Low-power view containing both prostate cancer and benign glands displays the pronounced difference in GS staining between benign and malignant glands (D). The magnification of A, B and C was ×400 original magnification. The magnification of D was ×200 original magnification.
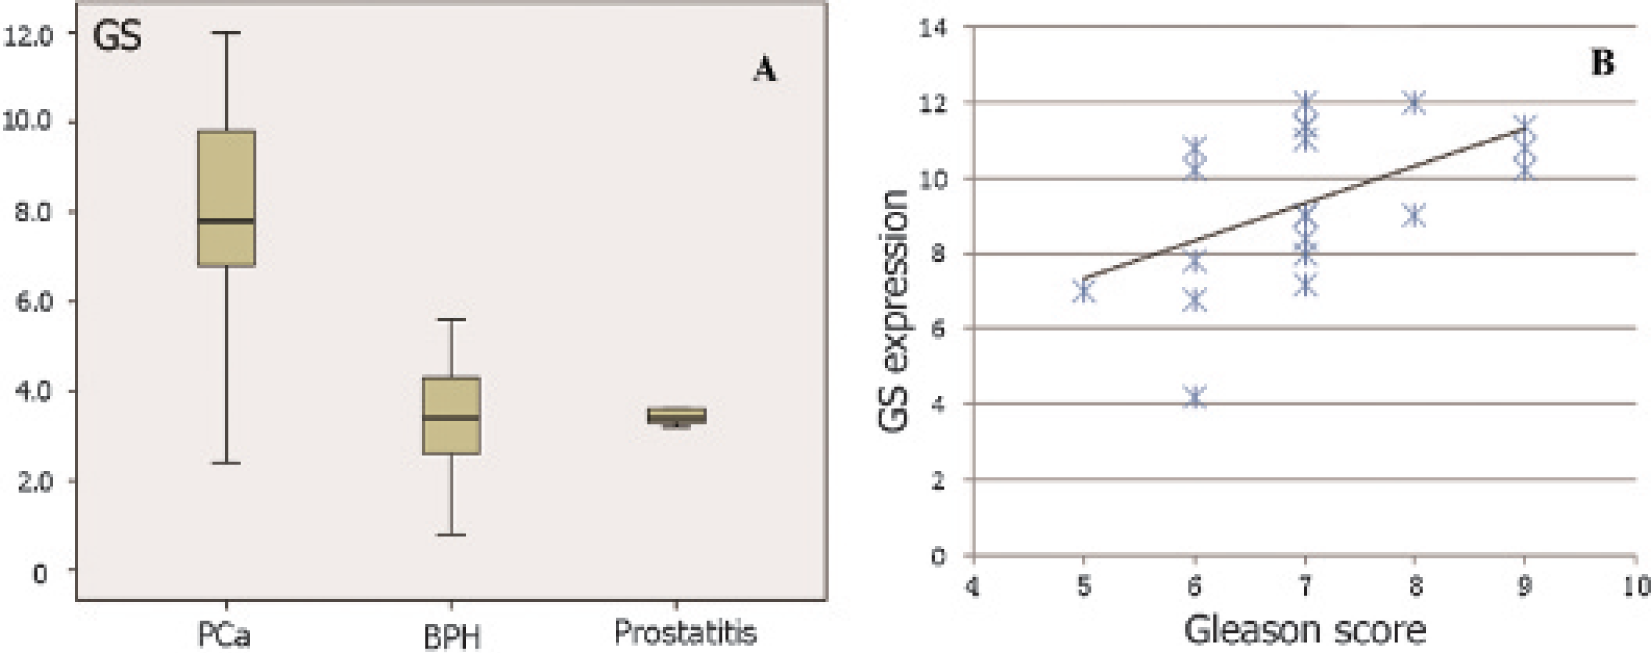
A, The boxplot of glutamine synthetase (GS) expression scores among different tissues. In benign prostatic hyperplasia (BPH) and prostatitis samples, the GS expression scores were significantly lower than that of prostate cancer (PCa) (p < .001). There was no difference in GS expression scores between BPH and prostatitis samples (p = .26). B, In 18 patients with PCa, there is a positive correlation between maximum GS expression and Gleason score (Spearman r = .52).
[13N]Ammonia PET/CT Findings
[13N]Ammonia PET/CT was positive in 25 patients, of whom 22 had PCa and the other 3 had BPH. The detective sensitivity and positive predictive value for PCa were 81.5% and 88%, respectively.
On a sextant basis, histopathologic analysis demonstrated cancer foci in 133 of 204 sextants, prostatitis foci in 8, and BPH in 63. PET/CT demonstrated a higher [13N]ammonia uptake in 71% (94 of 133) of segments with PCa, 32% (20 of 63)of segments with BPH, and 12% (1 of 8) of segments with prostatitis. [13N]Ammonia uptake in PCa segments (SUVmax 2.08 ± 1.14) was significantly higher than that in BPH (1.56 ± 0.58, p = .006) and focal prostatitis (1.14 ± 0.22, p = .01) (Figure 5A). [13N]Ammonia uptakes in BPH were higher than those in focal prostatitis (p = .01). On a sextant basis, there was a weak correlation between SUVmax and GS expression scores (Spearman r = .47) in all segments (Figure 5B).

A, Boxplot of SUVmax values among different segments. [13N]Ammonia uptake in prostate cancer (PCa) segments was significantly higher than that in benign prostatic hyperplasia (BPH) (p = .006) and focal prostatitis (p = .01). [13N]Ammonia uptake in BPH was higher than that in focal prostatitis (p = .01). B, On a sextant basis, there was a weak correlation between GS expression scores and SUVmax values (Spearman r = .47).
Imaging results of a patient with prostatitis on one side and PCa on the other side are presented in Figure 6. The results for another patient with BPH and PCa on separate sides are shown in Figure 7.

A 75-year-old male patient with pathologically proven prostate carcinoma on the left side and prostatitis on the right side (patient no. 2). Positive staining of glutamine synthetase is demonstrated in both prostate cancer (C) and prostatitis (B) tissues, although the carcinoma tissue has significantly higher uptake of [13N]ammonia (A). Increased [13N] Ammonia uptake was also seen in bone metastasis (white arrow in A). The magnification of B and C was ×400 original magnification.
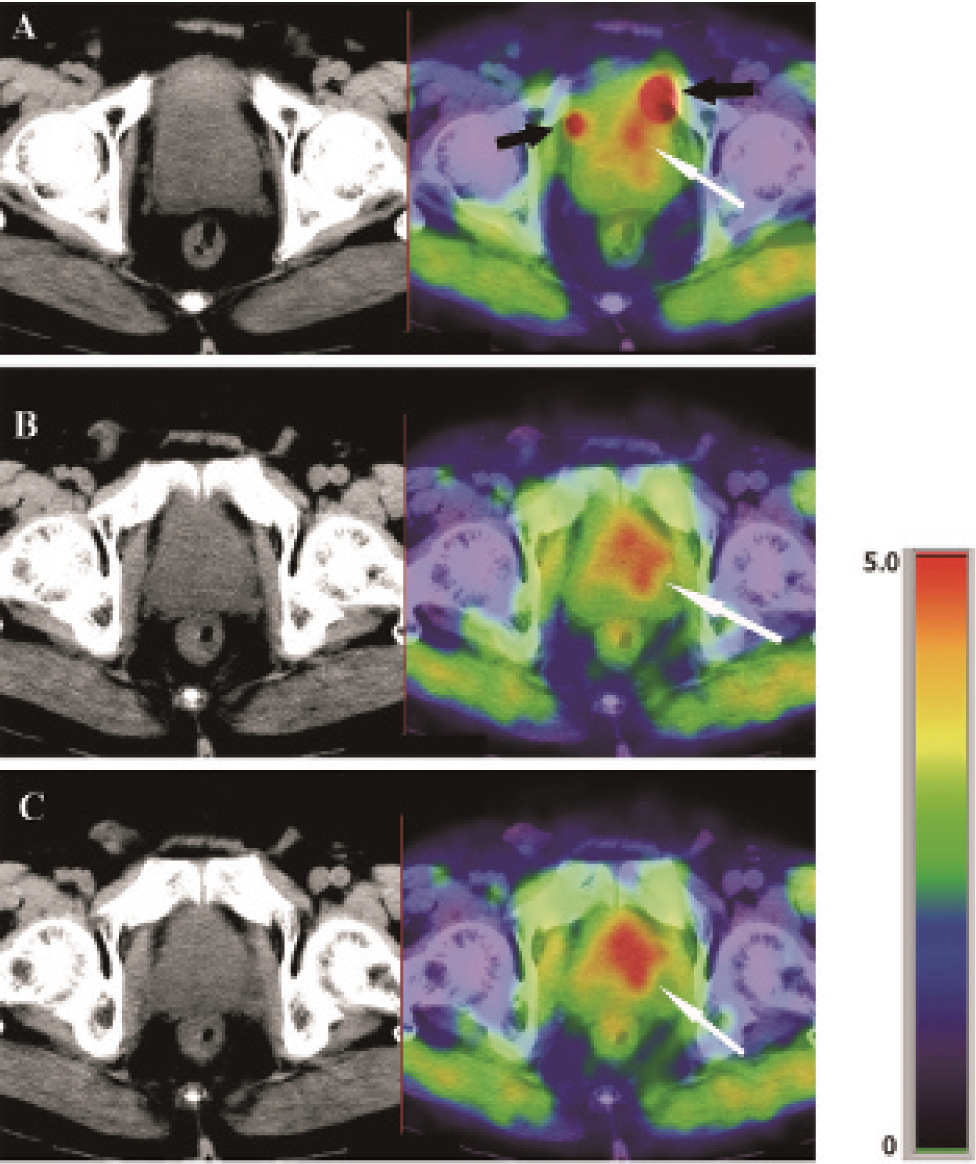
Imaging results of an 80-year-old patient (patient no. 4). Twelve-core biopsy demonstrated prostate cancer tissue in the left apex, left middle, and left base segments, whereas [13N]ammonia PET showed higher uptakes in these segments (white arrows). Because of the excretion of [13N]ammonia through kidney, the high radioactivity of the urine could obscure the upper part of the prostate (black arrows).
Discussion
Metabolic reprogramming has received tremendous attention in cancer research, and enhanced glutaminolysis, together with glycolysis, has been recognized as critical metabolic transformation during carcinogenesis. 23 Many scientists believe that upregulated glutaminolysis provides opportunities for tumor therapy and imaging because glutamine contributes essentially to the very core metabolic task of proliferating tumor cells. 24 Recently, two novel tracers, 18F-(2S,4R)4-fluoroglutamine and L-[5-(11)C]-glutamine, were developed for PET imaging of glutamine metabolism of tumors since the upregulation of glutamine transporters has been demonstrated in many tumor cells.25,26 However, tumor cells not only obtain glutamine from plasma but also synthesize glutamine for themselves. Previous studies have demonstrated that GS has increased expression in many cancer cells, such as MYC-induced lung cancer cells, PCa cells, and some breast cancer cells.27–29 The evaluation of endogenous glutamine synthesis also provides important information for both clinical diagnosis and therapy. 23 For example, glutamine deprivation was once recognized as a potential therapy for glutamine-dependent cancer, whereas the expression of GS could help the cells survive even in the absence of glutamine and compromise therapeutic efficacy. 30
In this study, we provided new evidence that de novo glutamine synthesis could be another feasible imaging target for PCa because this intracellular synthesis had a close relationship with glutaminolysis consumption and glutamine requirement. In fact, Collins and colleagues noticed the upregulation of GS in breast tumors early in 1997. 15 They reported that the rapid growth of breast tumor TSE cells consumed a large amount of glutamine and experienced chronic glutamine deprivation that was compensated for by upregulation of GS expression. This increased GS expression helped these cells survive and grow in a glutamine-deficient environment.
In this study, we found that both PC3 and DU145 cells steadily express GS and the expression upregulated along with the decrease in glutamine. Immunohistochemistry results also supported the opinion that higher expression of GS was prevalent in PCa tissues. Moreover, there was a positive correlation between GS expression scores and Gleason scores in PCa samples. Here we only recruited two androgen-independent PCa cell lines, PC3 and DU145, because previous studies revealed that androgendependent LNCaP cells had a much higher expression of GS than PC3 cells. 29 In cancer cells, elevated GS protein expression not only cleans up excessive ammonia, which is produced during accelerated metabolism, it also supplements the enhanced glutaminolysis with a glutamine pool in cytosol by de novo glutamine synthesis. 16 Malignant cells with higher Gleason scores have more active metabolism and a higher glutamine requirement, which might cause lower intracellular glutamine content and, accordingly, higher GS expression.
[13N]Ammonia has established its role in the imaging of cardiac blood perfusion, but its application in the imaging of GS expression and associated intracellular glutamine synthesis have not been reported previously. In this study, we observed that the uptake of [13N]ammonia in PCa was significantly higher than that in BPH and prostatitis, and there was a weak correlation between the amount of GS and the uptake of [13N]ammonia. One possible reason for the weak correlation is the limitation of the study design, which calculated the mean expression scores of GS of each biopsy sample and did not analyze the uptake of [13N]ammonia and the expression of GS point by point. Another possible reason is that the activity of the enzyme is regulated by a complex metabolic environment, leading to the discordance between the amount of the protein and its activity. 31
Elevated GS expression was also seen in the macrophages found in the samples of prostatitis, whereas these segments showed an absence or lower uptake of [13N]ammonia (see Figure 6). One possible reason is that GS could be inactivated by the reactive oxygen species (ROS) in the macrophages. 32 In comparison with [18F]fluorodeoxyglucose, [18F]/[11C]acetate, and [18F]/[11C]choline, which all could give false-positive results in the setting of inflammation and infection, [13N]ammonia PET/CT showed negative results for seven of eight segments of prostatitis in this study. 33 However, further studies with large samples of prostatitis are still needed to verify this encouraging result. Statistical analysis also showed that there was a considerable overlap of SUVmax between PCa and BPH segments, but in each patient with both PCa and BPH lesions, the uptake of [13N]ammonia in PCa segments was always higher than that in BPH segments (see Figure 7).
[13N]Ammonia is a potential tracer for the evaluation of GS as its trapping is mainly attributed to the synthesis of glutamine. But the measurement of exact GS expression might need more information than the SUVmax values. Previous studies have demonstrated that local blood flow is another important factor affecting the uptake of [13N]ammonia, which elevates significantly in PCa tissue and determines the initial uptake of [13N]ammonia.34,35 Dynamic analysis recruiting arterial blood samples could calculate the net metabolic rate of [13N]ammonia in specific tissue, which is related more directly to the expression of GS. 36
Our study has several limitations. The most important one is the adoption of needle biopsy histopathology as the standard of reference, and we correlated PET/CT findings with histopathologic analysis on a sextant basis. According to previous reports, it is difficult to estimate the extent of the PCa foci by biopsy. On the other hand, the diagnosis might be inaccurate for patients with negative biopsy results for the absence of prostatectomy. 37 Further studies including the results of step-section histopathologic examination are necessary to verify the clinical utility of [13N]ammonia imaging in PCa.
Conclusion
The expression of GS in PCa cells upregulated along with the deprivation of glutamine. GS is the main reason for the uptake of [13N]ammonia in PCa cells, and [13N]ammonia is a useful tracer for PCa imaging.
Footnotes
Acknowledgments
We thank Li Zhi for analysis of immunohistochemical GS staining.
Financial disclosure of authors: This work was supported by the National Natural Science Foundation of China (81271599). Financial disclosure of reviewers: None reported.