
Abstract
We aimed to quantitatively characterize the treatment effects of docetaxel in the HCT116 xenograft mouse model, applying diffusion-weighted magnetic resonance imaging (MRI) and positron emission tomography (PET) using 2-deoxy-2-[18F]fluoro-D-glucose ([18F]FDG) and 3′-deoxy-3′-[18F]-fluorothymidine ([18F]FLT). Mice were imaged at four time points over 8 days. Docetaxel (15 mg/kg) was administered after a baseline scan. Voxel-wise scatterplots of PET and apparent diffusion coefficient (ADC) data of tumor volumes were evaluated with a threshold cluster analysis and compared to histology (GLUT1, GLUT3, Ki67, activated caspase 3a). Compared to the extensive tumor growth observed in the vehicle-treated group (from 0.32 ± 0.21 cm3 to 0.69 ± 0.40 cm3), the administration of docetaxel led to tumor growth stasis (from 0.32 ± 0.20 cm3 to 0.45 ± 0.23 cm3). The [18F]FDG/ADC cluster analysis and the evaluation of peak histogram values revealed a significant treatment effect matching histology as opposed to [18F]FLT/ADC. [18F]FLT uptake and the Ki67 index were not in good agreement. Our voxel-based cluster analysis uncovered treatment effects not seen in the separate inspection of PET and MRI data and may be used as an independent analysis tool. [18F]FLT/ADC cluster analysis could still point out the treatment effect; however, [18F]FDG/ADC reflected the histology findings in higher agreement.
MULTIMODALITY IMAGING is an emerging research discipline in the fields of primary cancer diagnostics, staging, therapy monitoring, and drug discovery.1,2 Whereas positron emission tomography (PET) uses specific radiolabeled tracers to yield molecular information, magnetic resonance imaging (MRI) reveals functional and morphologic information. Combining these two approaches provides multiparametric data to illustrate molecular disease–specific pathways and functional processes in vivo that are key targets for therapeutic approaches. However, a major challenge in clinical and preclinical research is the holistic analysis of complementary data from multiple imaging modalities on a molecular level. 3 Therefore, we aimed to find a mathematical solution to quantitatively evaluate data from two independent imaging modalities to extract significant cellular changes under the influence of a therapeutic drug.
Diffusion-weighted magnetic resonance imaging (DW-MRI) relies on the detection of the random microscopic motion of free water molecules, known as brownian motion, in extracellular tissue compartments, 4 where the presence of macromolecules or cell membranes interferes with the free displacement of water molecules. The quantification of the diffusion is measured as the apparent diffusion coefficient (ADC). Thus, a viable tumor with densely packed cells will have a low ADC value, whereas a necrotic tumor will likely yield higher ADC values.
The two PET tracers 2-deoxy-2-[18F]fluoro-D-glucose ([18F]FDG) and 3′-deoxy-3′-[18F]-fluorothymidine ([18F]FLT) are biomarkers of tumor glucose metabolism and cell proliferation, respectively.5–7 [18F]FDG is the gold standard in oncologic PET imaging because most malignant cells have an increased demand for glucose, known as the Warburg effect, due to an upregulation of glucose transporters and hexokinase activity. Furthermore, [18F]FDG is used to identify changes in glucose uptake during tumor therapy. It was shown previously that changes in [18F]FDG uptake are related to the expression levels of the glucose transporters GLUT1 and GLUT3.8–10 [18F]FLT is also often used for tumor imaging and targets thymidine kinase 1 (TK1), which reaches a maximum activity in proliferating cells in the late G1 and S phases of the cell cycle when the cell synthesizes DNA. 11
In this study, we applied two different in vivo imaging modalities, PET and DW-MRI, to fully characterize the tumor growth of an HCT 116 colon adenocarcinoma xenograft mouse model and the effects of treatment with the cytostatic drug docetaxel. We aimed to develop a mathematical approach for quantitative correlation of the complementary information obtained from PET tracer uptake and DW-MRI and compared the results to immunohistochemistry.
Materials and Methods
Tumor Grafting and Drug Treatment
Female Swiss nude mice (N = 32), 6 to 7 weeks old, weighing 20 to 25 g, were purchased from Charles River Laboratories (St. Germain Sur L'Arbresle, France). All animal work was performed under ethical approval and statistical certification in accordance with German law. Animals did not experience any adverse events during these studies. Details about tumor grafting and volume measurements can be found in the Supplementary Material and Methods (online version only).
After ensuring a comparable tumor size distribution of approximately 0.2 mm3 by randomization, mice were divided into a treatment group (DOX) that received docetaxel once (15 mg/kg in 4 mL/kg, intravenously) 24 hours after the baseline measurement, indicating the first day of treatment, and a vehicle-treated (VEC) group. Docetaxel was used as a dilution (2.6% ethanol in sterile water) from its clinically available form (Sigma Aldrich, Munich, Germany). The vehicle-treated mice received the equal amount of 0.9% NaCl solution (Fresenius Kabi, Bad Homburg, Germany) intravenously.
Histology and Immunohistochemistry
The tumors were processed to paraffin for immunohistochemical staining. Tumor sections were stained with hematoxylin and eosin (H&E), and immunostaining was performed using the following primary antibodies (see supplementary notes, online version only): GLUT1, GLUT3, Ki67, and activated caspase 3a. Immunohistochemistry indices show the mean percentage of positive cells (Figure 1).

Histologic sections of representative tumor slices from the vehicle-treated group and the docetaxel-treated group after day 7 stained with hematoxylin and eosin (H&E), GLUT1, GLUT3, Ki67, and activated caspase 3a. Mean histologic indices of all tumor sections are shown for day 7. The H&E index reveals the mean percent necrosis of the tumor volumes, and the GLUT1, GLUT3, Ki67, and activated caspase 3a indices indicate the mean percent positive staining of the viable tumor regions.
Small Animal PET and MRI
Animal weight and tumor volume were measured before the PET scans (see supplementary notes, online version only). Static PET scans (10 minutes) were performed on small-animal PET scanners (Inveon, Siemens Preclinical Solutions, Knoxville, TN). Two sets (N = 32) of mice, each set consisting of the VEC (n = 8) and the DOX (n = 8) group, were measured with [18F]FDG or [18F]FLT. Approximately 13 MBq (see supplementary notes, online version only) of the tracer was injected intravenously via the tail vein. For [18F]FDG, mice were kept anesthetized (1.5% isoflurane vaporized in 0.8 L/min 100% oxygen) in a 37°C heated anesthesia chamber during the 55-minute tracer uptake. Before [18F]FDG injection, animals were fasted for 12 hours. Blood glucose was measured in a HemoCue glucose system (HemoCue GmbH, Grossostheim, Germany) after retrobulbar puncture. For [18F]FLT, a 90-minute uptake period, during which the mice were conscious, was performed before the scan.
Following the PET scans, each mouse was transferred on the same bed to a 7 T ClinScan MRI system (Bruker, Ettlingen, Germany), where an anatomy scan and DW-MRI using the HASTE sequence were performed (see supplementary notes, online version only). PET and MRI were performed at baseline (day 0) and days 2, 5, and 7 after docetaxel administration.
ADC maps were calculated voxel-wise using an inhouse-written MATLAB (MathWorks, Natick, MA) program containing linearization, least square minimization, and calculation of the coefficient of determination R2. Coregistration of the magnetic resonance and PET images was performed manually using Inveon Research Workplace (IRW, Siemens Preclinical Solutions, Erlangen, Germany) software. Images were oriented by means of glass capillary markers filled with tracer solution that were attached on the inner wall of the beds. Since these markers had sizes on the order of the PET image voxel size, fiducial localization and registration errors were below one PET voxel size. After registration, image alignment was checked by inspecting the borders of the organs. Since no registration correction was necessary, the target registration error should be below one voxel size. Regions of interest (ROI) were drawn by visual inspection on sagittal magnetic resonance images. Three-dimensional (3D) volumes were calculated in IRW and subsequently applied to analyze the PET images and the ADC maps. For analysis of the reference tissues, 3D muscle (in the left shoulder and foreleg for [18F]FDG) or liver volumes (for [18F]FLT) were calculated corresponding to the tumor volume of the respective animal. PET tracer uptake is expressed as the mean percentage of injected dose per cm3 (%ID/cc) and ADC values as 10−3 mm2/s.
Cluster Analysis of Voxel-Wise Scatterplots
Pearson correlation coefficient (PCC) was calculated and represented the degree of linear correlation in voxel-wise scatterplots of the %ID/cc versus ADC values. For further analysis of the scatterplots, a %ID/cc/ADC threshold cluster analysis MATLAB program was created. To define an ADC threshold, we compared the histologic H&E-stained tumor sections from VEC mice on day 7 with the same sections of ADC maps overlaid onto the anatomy (see supplemental notes for further details, online version only). The contour levels of the ADC that were tested ranged from 0.9*10−3 mm2/s to 1.4*10−3 mm2/s as previously described. 12 The threshold of 1.10*10−3 mm2/s was found to match best the area of necrosis in the corresponding H&E-stained sections. One example using the threshold of 1.10*10−3 mm2/s is shown in Figure S1 (online version only). The necrotic areas corresponded to voxel values ≥ 1.10*10−3 mm2/s in the ADC maps. The possibility of discrimination of necrotic and nonnecrotic tissue is already well described.13,14 Previous studies have shown that [18F]FDG PET and diffusion-weighted imaging can be used as a predictor of tumor necrosis staging in histology. 15 Furthermore, a study by Jung and colleagues showed that the ADC values correlated with the degree of intratumoral necrosis on pathologic slides in a prostate cancer xenograft mouse model. 16
We defined two different clusters in the voxel-wise scatterplots (Figure 2A). Cluster 1 represents voxels with ADC values below the threshold (1.10*10−3 mm2/s), and cluster 2 represents voxels with ADC values above the threshold. Changes in tumor tissue development were examined by looking at changes of the relative population of the two clusters. To simultaneously analyze the PET data, histograms of the %ID/cc data in cluster 1 and cluster 2, respectively, were calculated. The maximum value from each histogram was used for the analysis representing the %ID/cc value most voxels in one cluster reveal. The cluster analysis was applied for all subsequent measurements.

A, Representative scatterplot of [18F]FDG %ID/cc/apparent diffusion coefficient (ADC) of one mouse on day 7 of the vehicle-treated group with cluster allocation. On the left side of the scatterplot, the histogram of cluster 1 of the PET data is shown (the arrow points out the maximum of the number of voxels); on the right side of the scatterplot, the histogram of cluster 2 of the PET data is shown. B, Scatterplot analysis of [18F]FDG %ID/cc/ADC for cluster 1 and cluster 2 of both groups. C, Scatterplot analysis of [18F]FLT %ID/cc/ADC for cluster 1 and cluster 2 of both groups. D, Analysis of the peak histogram values of the %ID/cc [18F]FDG/ADC scatterplots for both groups. E, Analysis of the peak histogram values of the %ID/cc [18F]FLT/ADC scatterplots for both groups. *p < .05; **p < .01.
Statistics
Statistical analysis was performed using the two-sided t-test. Data were considered statistically significant when p < .05. All quantitative results are shown as the mean ± 1 standard deviation (SD).
Results
Tumor Growth in HCT 116 Xenograft Mice
During the 8 days of the study, the mean size of the tumors of VEC mice more than doubled. On the baseline imaging day, the mean tumor size for both groups was similar (0.32 ± 0.21 cm3 for the VEC group and 0.32 ± 0.20 cm3 for the DOX group; Figure 3A). A significant difference in mean tumor sizes between groups was evident after day 5, when the size of the tumors was 0.69 ± 0.40 cm3 for the VEC group and 0.45 ± 0.23 cm3 for the DOX group (p = .04).

Tumor growth and imaging data of the vehicle-treated (black) and docetaxel-treated (white) groups. A, Tumor growth of the HCT 116 tumors from the vehicle-treated and docetaxel-treated groups. B, Mean apparent diffusion coefficient (ADC). C, Left, %ID/cc of [18F]FDG and, right, %ID/cc of [18F]FLT. D, Transversal images of example mice at day 7 from both groups. The PET images are fused onto the magnetic resonance anatomy on the left side, and the corresponding ADC slices are shown on the right. The maximum of the PET scale bar is calculated from the injected activity, and the images are normalized to each other to achieve comparability and ranges between 0 and 2.8*105 Bq/mL and 4.0*105 Bq/mL, respectively. The scale of the ADC images ranges from 0 to 1.1*10−3mm2/s. *p<.05; **p<.01.
On day 7, tumors in the DOX group showed growth arrest at a mean size of 0.40 ± 0.21cm3, whereas tumors of the VEC group grew to a mean size of 0.84 ± 0.43 cm3 (p = .001). Furthermore, there were no significant changes in the body weight or blood glucose levels of the animals among the different groups throughout the study (data not shown).
PET and MRI in HCT 116 Tumor Xenografts
Tracer Uptake in the VEC Group
The mean [18F]FDG %ID/cc values of the tumor tracer uptake in the VEC group showed a highly significant decrease over time (p = .002; Figure 3C), whereas changes in the mean %ID/cc of the muscle tissue used as a reference were not statistically significant (1.21 ± 0.32 at baseline, 1.54 ± 0.24 on day 7; Figure S2A, online version only). Significant changes were seen between day 2 (mean %ID/cc 4.19 ± 0.49) and day 5 (mean %ID/cc 3.31 ± 0.59, p = .009), as well as between day 2 and day 7 (mean %ID/cc 3.19 ± 0.55, p = .002). PET images on the last day showed large necrotic areas leading to an overall decrease in [18F]FDG tracer uptake (see Figure 1, H&E index). A comparison of the mean %ID/cc of the baseline (4.16 ± 1.22) with the mean %ID/cc of only the PET-avid tumor part on day 7 (3.88 ± 0.28; Figure S4A, online version only) revealed almost no change in tracer uptake over time. This constant tracer uptake in contrast to the accelerated tumor growth can be explained by the fast appearance of large necrotic regions. The comparison between whole tumor at baseline with the PET-avid tumor part on day 7 is valid because the whole tumor was PET avid at baseline for the VEC group. However, it must be kept in mind that at baseline, small necrotic parts might already exist that are not detected due to partial volume effects. Figure 3D shows representative PET images and their corresponding ADC maps on day 7.
The mean [18F]FLT %ID/cc showed an increase over time; however, this increase was not statistically significant (Figure 3C). Again, there was no significant change in the reference liver tissue (1.76 ± 0.41 at baseline, 1.84 ± 0.45 on day 7; Figure S3A, online version only). However, the mean %ID/cc changed from 3.56 ± 1.79 at baseline to 4.80 ± 1.24 on day 7. Because a large portion of the tumor tissue exhibited necrosis (see Figure 1, H&E index), a comparison of the mean %ID/cc of the baseline with the mean %ID/cc of only the PET-avid tumor part on day 7 (5.46 ± 0.97) revealed a significant increase in tumor tracer uptake from baseline (p = .04; Figure S4B, online version only). The increased tracer uptake revealed the increased cell proliferation resulting in fast tumor growth.
Tracer Uptake in the DOX Group
The mean [18F]FDG %ID/cc of tumor uptake showed no changes between baseline (4.17 ± 0.93) and day 7 (4.14 ± 1.54; see Figure 3C). Similarly, the reference muscle tissue uptake remained constant over time (1.32 ± 0.51 at baseline, 1.38 ± 0.31 on day 7; Figure S2B, online version only). In contrast, the increase in the mean %ID/cc of the [18F]FLT tumor uptake was statistically significant between baseline (3.34 ± 1.18) and day 7 (5.16 ± 0.85, p = .005), as well as between day 2 (3.23 ± 1.15) and day 7 (p = .003; see Figure 3C). The mean %ID/cc of the reference liver tissue revealed no significant changes (1.32 ± 0.44 at baseline, 1.67 ± 0.33 on day 7; Figure S3B, online version only).
When the tumor tracer uptakes of the VEC and DOX groups were compared, a significant difference in the mean %ID/cc values of [18F]FDG uptake was found on day 5 (p = .02), whereas the [18F]FLT tracer uptake exhibited no significant difference in the mean %ID/cc values (see Figure 3C).
DW-MRI and Comparison of Both Groups
The mean ADC values (the average of tumor ADC values of all animals in the VEC or DOX group measured with [18F]FDG and [18F]FLT) are shown in Figure 3B. The mean ADC of the VEC group was significantly increased (p = .04) on day 7 (0.81 ± 0.12*10−3 mm2/s) compared to baseline (0.70 ± 0.12*10−3 mm2/s). It was found that the PET images ([18F]FDG and [18F]FLT) and the ADC maps demonstrated complementarity on day 7 (shown in Figure S4, C and D, online version only) which could not be found for the DOX group (see Figure 3D). Figure S5 (online version only) shows the [18F]FDG and [18F]FLT uptake, respectively, and the corresponding ADC maps on the 4 consecutive imaging days for one mouse of each group. These longitudinal images illustrate the fast tumor growth and the development of necrosis.
Interestingly, the mean tumor ADC of the DOX group revealed a stronger significant increase (p = .013) from baseline (0.69 ± 0.11*10−3 mm2/s) to day 7 (0.80 ± 0.11*10−3 mm2/s) and from baseline to day 5 (0.81 ± 0.10*10−3 mm2/s, p = .004). No significant difference between the ADC values of the DOX and VEC groups was found.
Immunohistochemistry
VEC tumors demonstrated a high percentage of necrosis by H&E staining using semiquantitative analysis (56% ± 14%; see Figure 1), reflecting the extensive tumor growth. Tumors of the DOX group showed stasis in tumor size, and a significantly smaller portion of the tumour tissue was necrotic (22% ± 13%) compared to the VEC group. Only the viable tumor regions (nonnecrotic) of both groups were further semiquantitatively analyzed for activated caspase 3a, Ki67, GLUT1, and GLUT3 levels (see Figure 1). Compared to histologic sections of the VEC mice, which showed a high degree of proliferation (91% ± 5%), cellular proliferation of histologic sections of the DOX mice showed a reduced Ki67 index (59% ± 14%). In the same manner, the GLUT1 index of the tumor tissue was twice as high in VEC mice (64% ± 9%) as in DOX mice (31% ± 10%). Likewise, the GLUT3 index was twice as high in the VEC tumors (26% ± 5%) as in the DOX tumors (13% ± 6%). The tumor tissue of VEC mice showed almost no apoptosis by activated caspase 3a staining (6% ± 2%), whereas programmed cell death was upregulated in the tumor tissue of the DOX group (23% ± 7%). Indices of the histologic sections from each of the four stainings (GLUT1, GLUT3, Ki67, and activated caspase 3a) were significantly different between the VEC and the DOX group.
PCC and Threshold Cluster Analysis
To analyze the relationship between colocalized PET and MRI data, scatterplots using voxel values of %ID/cc tracer uptake versus ADC values of the whole tumor volume were produced for each animal, and PCCs were determined. PCCs, R2, p value, means squared error, and standard deviation were calculated for one group at one time point (Table 1). In summary, there were no significant correlations between any of the comparisons made.
Pearson Correlation Coefficient Calculated from All Animals per Group and Timepoint
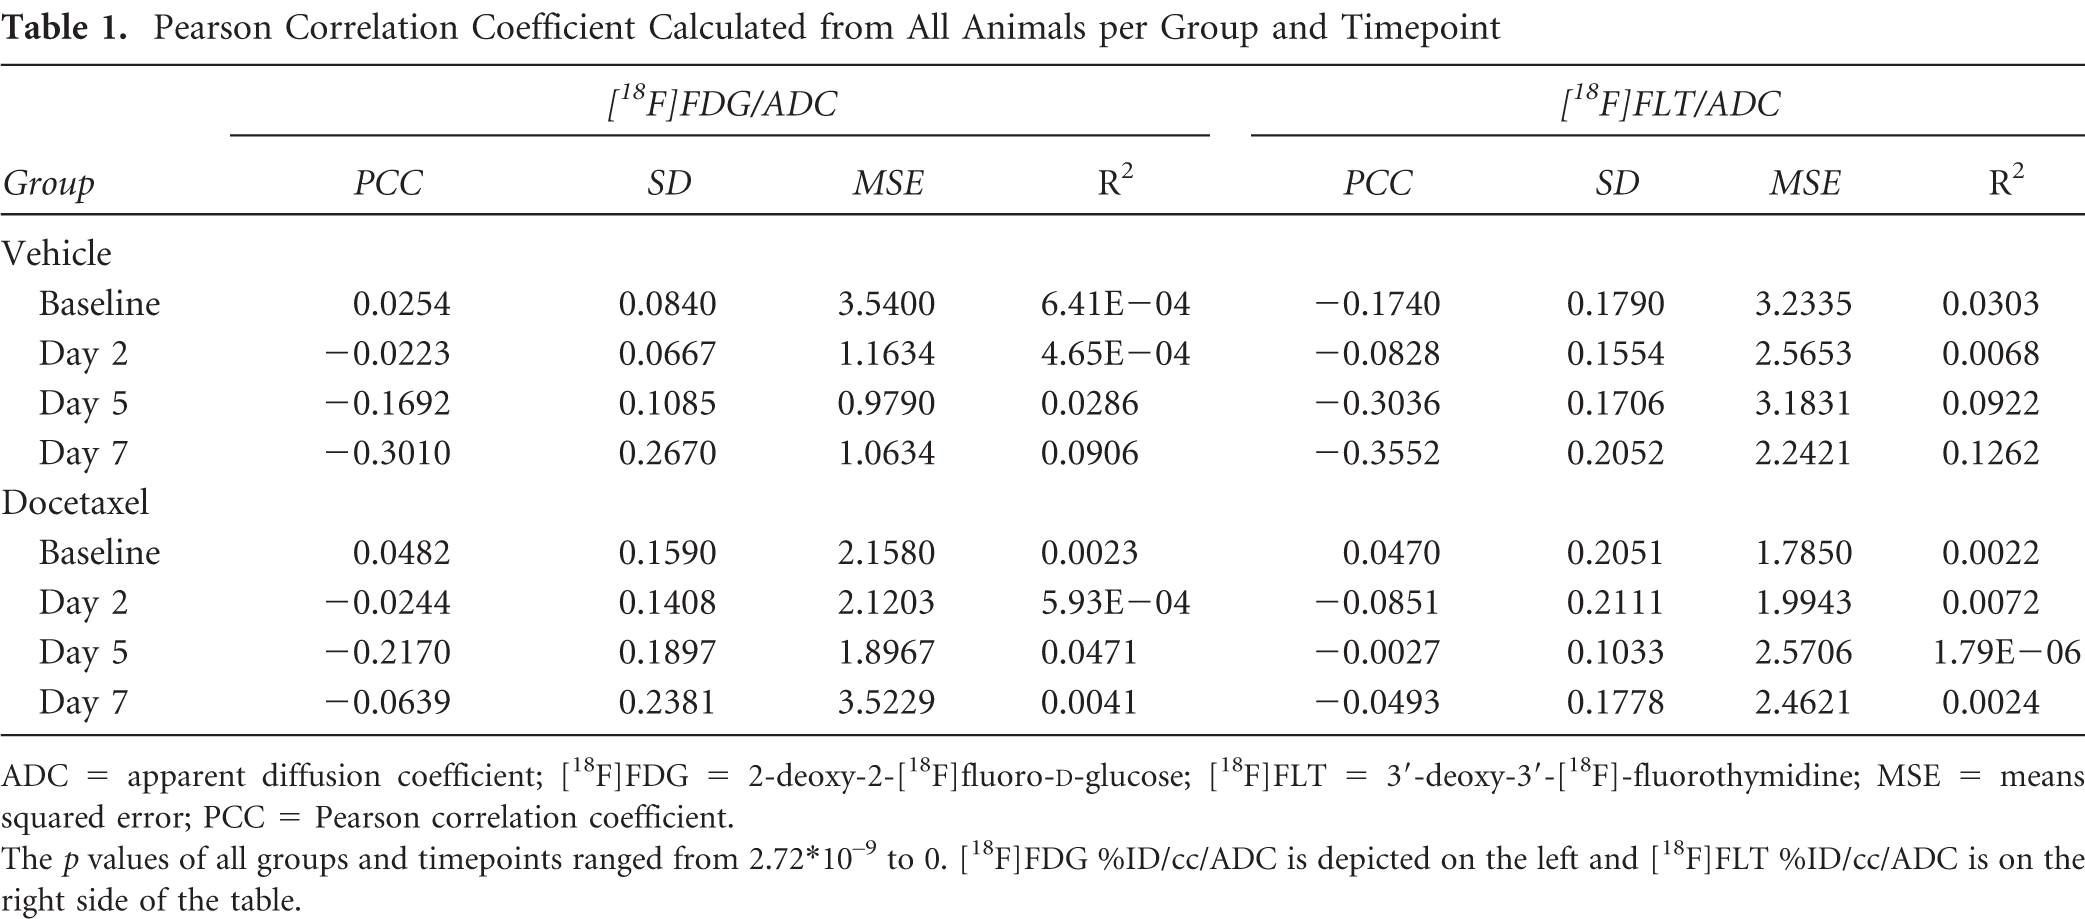
ADC = apparent diffusion coefficient; [18F]FDG = 2-deoxy-2-[18F]fluoro-D-glucose; [18F]FLT = 3′-deoxy-3′-[18F]-fluorothymidine; MSE = means squared error; PCC = Pearson correlation coefficient.
The p values of all groups and timepoints ranged from 2.72*10−9 to 0. [18F]FDG %ID/cc/ADC is depicted on the left and [18F]FLT %ID/cc/ADC is on the right side of the table.
Cluster Analysis of [18F]FDG %ID/cc/ADC Scatterplots
Figure 2A shows one representative scatterplot of [18F] FDG %ID/cc/ADC of one mouse of the VEC group at day 7 with cluster classification and the %ID/cc histograms corresponding to each cluster. Cluster 1 represents the left part of a scatterplot (below ADC threshold) and cluster 2 the right part (above ADC threshold). Histogramming of the PET data in each cluster revealed a more detailed insight into the distribution of the %ID/cc values. Only a gaussian-shaped histogram would result in a %ID/cc peak value equal to the mean %ID/cc of the whole tumor volume. When the histogram is not gaussian shaped, the peak %ID/cc value reveals different information compared to the mean %ID/cc of the whole tumor. This information allows for a superior analysis of the PET imaging data.
Figure 2B shows the changes in the relative population of clusters 1 and 2 for the scatterplots of [18F]FDG %ID/cc/ADC for the two groups. The cluster analysis of the VEC group revealed that the relative population of cluster 1 decreased significantly from baseline (92.3% ± 4.3%) to day 7 (82.7% ± 9.1%, p = .026). Also, the population of cluster 2 increased accordingly.
Since cluster 1 resulted from viable, nonnecrotic tumor regions and cluster 2 contained only the voxels with high ADC, cluster 2 represented the necrotic tumor regions. The amount of necrosis found on H&E histologic sections was much higher (56% ± 14%; Figure 1) compared to the cluster 2 population on day 7 (17.3% ± 9.1%). This finding reveals a mismatch between the amounts of necrosis found by H&E and the population of cluster 2. Since the ADC threshold was defined based on central tumor slices that matched the H&E staining (Figure S1, online version only), it is hypothesized that the ADC of the whole tumor volume was lower because the necrotic areas are usually predominantly at the tumor core rather than the outer areas. Thus, the ADC cluster reflected overall tumor necrosis more accurately.
The peak histogram values for cluster 1 of the VEC group shifted over time from 3.46 ± 1.81 %ID/cc at baseline to 3.70 ± 0.76 %ID/cc on day 7 (Figure 2D) in a nonsignificant way. This is in contrast to the mean %ID/cc (see Figure 3C), which is decreasing significantly over time.
The increased %ID/cc in the viable cluster 1 on day 7 revealed that the glucose consumption of tumor tissue increased over time, which could not be detected by simply examining only the mean %ID/cc (see Figure 3C). It seems that the increased glucose consumption is not sufficient for the extensive tumor growth, resulting in high necrosis. Cluster 2 represents the necrotic tumor regions, and the peak histogram values shifted to a lower %ID/cc value not only over time (4.42 ± 1.81 %ID/cc at baseline, 3.31 ± 0.76 %ID/cc at day 7) but also compared to cluster 1 on day 7.
The cluster analysis for the DOX group (Figure 2B) showed that the population of cluster 1 was significantly decreasing over time (from 92.4% ± 5.6% at baseline to 83.8% ± 9.5% on day 5, p = .045, as well as from 94.2% ± 3.2% on day 2 to 84.0% ± 9.2% on day 7, p = .019, and from day 2 to day 5, p = .011). The population of cluster 2 increased significantly accordingly.
The peak histogram values for cluster 1 of the DOX group shifted nonsignificantly over time from 3.81 ± 1.11 %ID/cc at baseline to 4.11 ± 1.56 %ID/cc on day 7 (Figure 2D). The increased %ID/cc in the viable cluster 1 on day 7 revealed that the glucose consumption of the tumor tissue increased over time. Cluster 2 represents the necrotic tumor regions, and the peak histogram values shifted to a higher %ID/cc value nonsignificantly not only over time (4.36 ± 1.70 %ID/cc at baseline, 5.15 ± 0.98 %ID/cc at day 7) but also compared to cluster 1 at day 7.
On day 7, there is a significant difference in peak %ID/cc between the VEC and the DOX group only in cluster 2. The peak histogram values for cluster 2 are significantly lower in the VEC group compared to the DOX group (p = .004). The peak histogram values on day 7 of cluster 1 were very similar in both groups. Comparing the tracer uptake to the GLUT1 and GLUT3 indices (see Figure 1), there is a significant mismatch because the index of the VEC group is twice as high as the index of the DOX group.
Cluster Analysis of [18F]FLT %ID/cc/ADC Scatterplots
Figure 2C shows the changes in the relative population of clusters 1 and 2 for the scatterplots of [18F]FLT %ID/cc/ADC for both groups.
The cluster 1 population of the VEC group decreased over time (89.8% ± 15.1% at baseline, 79.6% ± 9.4% on day 7) with a corresponding increase in cluster 2. Again, the population of the necrosis cluster 2 on day 7 was much lower than the necrosis shown by the H&E staining. This corresponds to the findings of the cluster analysis of [18F]FDG %ID/cc/ADC in the VEC group, where cluster 2 also showed much less necrosis compared to the H&E staining. The peak histogram values for cluster 1 of the VEC group showed no changes over time (%ID/cc from 3.11 ± 1.98 %ID/cc at baseline to 3.81 ± 1.46 %ID/cc on day 7; Figure 2E). Accordingly, the peak histogram values of cluster 2 shifted nonsignificantly (3.75 ± 1.84 %ID/cc at baseline, 4.71 ± 1.85 %ID/cc on day 7).
DOX tumors showed a slight decrease in the cluster 1 population (91.0% ± 10.8% at baseline, 87.4% ± 11.0% on day 7), whereas cluster 2 (9.1% ± 10.7% at baseline, 12.6% ± 11.0% on day 7) increased nonsignificantly (see Figure 2C). The peak histogram values for cluster 1 of the DOX group increased over time nonsignificantly (from 2.88 ± 1.08 %ID/cc at baseline to 3.94 ± 1.35 %ID/cc on day 7, Figure 2E), whereas the peak histogram values of cluster 2 shifted significantly to a higher %ID/cc value over time (3.39 ± 1.34 %ID/cc at baseline, 4.99 ± 1.29 %ID/cc on day 7, p = .036).
There was no significant difference between the two groups in the cluster analysis. Comparing the tracer uptake to the Ki67 indices (see Figure 1), there is a significant mismatch of the index of the DOX group and the tracer uptake.
Discussion
To optimize the efficiency of therapies and reduce morbidity, it is of the utmost importance to assess tumor response and changes in biomarkers during therapy as early as possible in a noninvasive way. The combination of different noninvasive imaging modalities and the development of comprehensive imaging data analysis may contribute to revealing an in vivo molecular profile of a tumor. Several approaches exist for the correlation of [18F]FDG uptake and ADC in diverse tumor types in the clinic, and a significant inverse correlation of the PET standardized uptake value (SUV) and the ADC was found in untreated tumors.17,18
To our knowledge, this is the first time the two PET tracers [18F]FDG and [18F]FLT, as well as DW-MRI and immunohistochemistry, have been correlated for the evaluation of a tumor model and the treatment response to docetaxel. Combining these two different modalities, we aimed to develop an in vivo evaluation on a voxel-wise basis to focus on important cellular characteristics of the colon adenocarcinoma HCT 116 and the effects of docetaxel treatment. Previous studies have shown that a combination of docetaxel treatment and radiotherapy in an esophageal carcinoma xenograft mouse model leads to a significant reduction in [3H]FLT uptake correlating with Ki67 expression. 19 [3H]FDG uptake showed no significant changes after chemoradiotherapy. In contrast to this, our colorectal tumor model showed a response in [18F]FDG in combination with DW-MRI using only docetaxel as treatment.
Within the 8 days of our imaging study, tumor volumes in the VEC group more than doubled, and the tumors showed a high amount of necrosis on H&E-stained sections. Treatment of the HCT 116 xenograft mice with the cytostatic drug docetaxel led to tumor growth arrest, and necrotic tissue was found to be decreased by half compared to the VEC group.
Docetaxel is a semisynthetic taxane that targets centrosome organization in cells, stabilizing microtubules and thus disrupting the equilibrium of the microtubular network. 20 Docetaxel binds to β-tubulin and affects three phases of the cell cycle (S/G2/M). 21 Activated caspase 3a index showed approximately four times more apoptotic cells in the viable tumor tissue of the DOX group compared to the VEC group. It has been shown that apoptosis is induced as the main mechanism of cell death after treatment with antimicrotubule agents, including alterations of various downstream mechanisms, for example, Bcl-2 family proteins. 22 Docetaxel induces cell-cycle arrest in mitosis as an essential step for cell death. However, the cells still proceed to interphase without cytokinesis, called mitotic slippage, and enter a tetraploid “pseudo-G1” phase that is followed by apoptosis.23–25
Cells that responded to docetaxel treatment show positive staining for Ki67, indicating a high proliferation rate and appear to be larger than the surrounding cells in the tissue sections. However, the overall proliferation shown by the Ki67 index is decreased by approximately 34% in the DOX group compared to the VEC group. The GLUT1 index of the DOX group revealed that the tumor tissue had half as much GLUT1 transporters on the cell surfaces than that of the VEC group. It was found that docetaxel inhibits pyruvate kinase M2 (PKM2), 26 which plays an important role in cancer progression and is upregulated in a high number of cancer types, including colorectal. 27 PKM2 acts to regulate the rate-limiting final step for glycolysis, catalyzing the formation of pyruvate and adenosine triphosphate (ATP). It also interacts with hypoxia-inducible factor 1 (HIF1) to promote the transactivation of HIF-responsive genes, for example, glucose transporters. 28 This would explain the reduced GLUT1 index of the DOX tumor tissue.
For the analysis of the scatterplots, we found that the PCC did not reveal any significant correlations. However, the voxel-wise cluster analysis disclosed the information that the PET versus ADC scatterplots contain in a more comprehensive way.
The analysis of the voxel-wise scatterplots of %ID/cc [18F]FDG/ADC revealed significant changes in both cluster populations in the VEC and the DOX group. Cluster 1, representing the viable tumor tissue with low diffusion, decreased in both groups over time significantly. On day 7, cluster 1 populations of the VEC and DOX groups are in the same range, as well as the peak values of histograms of cluster 1. The analysis of the peak histogram values of cluster 1 for the VEC group showed no changes over time, whereas the mean %ID/cc decreased significantly. The extensive expansion of necrosis is revealed by the significant decrease in cluster 1 and the significant increase in the cluster 2 population of the scatterplot analysis. This shows that the necrosis plays an important role in the analysis of the mean %ID/cc. The viable tumor regions appear to have stable glucose consumption over time. This means that the [18F]FDG uptake of the treated and the untreated tissue is nearly the same, although the GLUT1 and GLUT3 indices are strongly reduced in the DOX group. The H&E stainings of the two groups showed a doubled amount of necrosis in the VEC group compared to the DOX group, but concomitantly, the GLUT1 and GLUT3 indices are bisected in the DOX tumors. In conclusion, approximately 28% of the whole tumor volume (64% ± 9% GLUT1 staining of the viable tumor tissue, representing 44% of the whole tumor volume) of the VEC tumors showed positive staining for GLUT1 and 10% for GLUT3. Similar values were found for the whole tumor volume of the DOX group (24% positive staining for GLUT1 and 10% for GLUT3). However, since the viable tumor tissue represented 78% of the whole tumor, the GLUT1 staining in the viable tumor part is only 31% ± 10% and therefore reduced significantly compared to the VEC group. Since the mean %ID/cc is determined over the whole tumor, the difference in glucose transporter expression is averaged out. However, if the [18F]FDG uptake would depend only on GLUT1 and GLUT3, this should be visible on day 7 when the tumor tissue with only PET-avid uptake for the vehicle group is taken into account. The effect should also be visible in the peak histogram values of cluster 1 because these values are not tumor volume dependent and are able to show the discrepancy. Since there is no difference between the two groups on day 7 in the mean %ID/cc (Figure S4A, online version only) and not in the mean peak histogram values of cluster 1 on day 7, we hypothesize that other factors might influence the [18F]FDG uptake, for example, poor vascularization, as already hypothesized by other groups.29,30 Several observations have shown that GLUT1 and GLUT3 are not the only important transporters for [18F]FDG.8,30 Singh and colleagues showed that the uptake of 2-deoxy-glucose increased in C6 glioma cells after treatment with paclitaxel, also a taxane. 29 They hypothesized that the glucose transporters that were packed into vesicles at the Golgi apparatus attached themselves to microtubules to be transported to the cell surface. Since docetaxel shifts the equilibrium to the formation of microtubules, there could be an increased transport of vesicles with glucose transporters to the cell surface. These glucose transporters seem to be different from GLUT1 because the GLUT1 index is decreased, which should be accompanied by less [18F]FDG uptake if the [18F]FDG uptake would rely on GLUT1 alone. Thus, in the case of docetaxel treatment, different GLUT transporters seem to be responsible for [18F]FDG transfer into the cell.
Cluster 2 of the VEC group, representing tumor regions with high diffusion, showed mainly the necrotic tissue. The DOX group revealed significantly less necrosis in the H&E index, although cluster 2 of the DOX group showed nearly the same population as cluster 2 of the VEC group. However, the peak %ID/cc histogram values of cluster 2 are able to identify the treatment effect of docetaxel. The peak %ID/cc on day 7 of the DOX group is significantly higher compared to the VEC group, revealing high tracer uptake and high diffusion in the same regions of the tumor (shown by the PET images and ADC maps in Figure 3D) because the apoptosis of cells leaves an increased extracellular water space that accelerates water diffusion,31,32 whereas the remaining cells still take up [18F]FDG. This explains why high diffusion and high tracer uptake appeared in the same tumor region. The same is also true when the tracer [18F]FLT was used. This finding supports as well the hypothesis that transporters other than GLUT1 and GLUT3 are used for the uptake of [18F]FDG compared to cells that were not treated with docetaxel.
The scatterplot analysis of %ID/cc [18F]FLT/ADC showed in both groups a high cluster 1 population. This finding is also represented by the Ki67 index of the VEC tumors. Zhang and colleagues proposed that a determinant for [18F]FLT uptake is the relative contribution of the salvage pathway to the overall proliferation of the cells. 33 [18F]FLT uptake seems to be enhanced in tumors that rely on this pathway as a dominant source for DNA synthesis. They also showed that HCT 116 tumors have a much higher affinity to [18F]FLT compared to several other cell lines. This could explain the high [18F]FLT uptake of the VEC group.
The high cluster 1 population of the scatterplot analysis of %ID/cc [18F]FLT/ADC for the DOX group seems not to match the Ki67 index. Mismatches of [18F]FLT uptake and Ki67 have been reported by different groups.33,34 The analysis of the peak histogram values for cluster 1 revealed no significant differences between the two groups. Interestingly, both clusters in the histogram analysis of the DOX group showed an increase in peak %ID/cc over time (cluster 1 nonsignificantly, cluster 2 significantly). In cluster 2, the peak histogram values reveal a slight decrease in tracer uptake on day 2 after treatment followed by a significant increase. A similar observation was made by Zhang and colleagues with a drug causing a G1 cell-cycle arrest. 33 In the case of docetaxel treatment, the reduced Ki67 index might be explained by the hypothesis that the proliferation of the cells does not rely on the salvage pathway anymore; therefore, the [18F]FLT uptake would not be representative. Additionally, cells in the so-called “pseudo-G1” phase due to treatment appear to show proliferation in the Ki67 staining, supporting this hypothesis.
Conclusively, at first sight, the unambiguous treatment effect of docetaxel could be monitored by the measurement of the tumor sizes using calipers. The limitation of the method is clearly the high standard deviations of the measurements due to tumor growth inhomogeneities. Our cluster analysis using the predominant combination of two imaging modalities, PET tracer analysis and DW-MRI, revealed the docetaxel treatment effect on the molecular level in a more detailed and sophisticated way. The treatment effect of docetaxel could be detected in the analysis of the peak histogram values of cluster 2 for [18F]FDG/ADC and for [18F]FLT/ADC, respectively. However, a significant effect could be demonstrated in the [18F]FDG/ADC scatter analysis only.
Conclusions
We showed that two modalities, PET and DW-MRI, can be used as complementary tools for the evaluation and characterization of treatment of the HCT 116 xenograft tumor model. Our cluster analysis is suitable for the combined evaluation of PET and ADC data on both the functional and molecular levels. The relative population of the clusters combined with the analysis of the peak %ID/cc values gives information about the tumor environment. Therefore, the cluster analysis may be used as an in vivo evaluation tool for tumor staging and monitoring therapy effectiveness in patients when the usual mean %ID/cc value interpretation methods fail to provide correct information. Although the complex composition of proliferation, necrosis, and apoptosis in a tumor is not always obvious in mean ADC or mean %ID/cc data at first sight, our mathematical cluster correlation provides a detailed insight. Additionally, we could show that [18F]FDG was superior to [18F]FLT in monitoring the treatment effect of the cytostatic drug docetaxel in a colorectal cancer xenograft model. However, the [18F]FLT /ADC cluster analysis could still point out the treatment effect. Thus, a combined analysis of PET and DW-MRI data is a tool that can potentially provide better understanding of pharmacodynamic effects.
Footnotes
Acknowledgments
We would like to thank the laboratory technicians Maren Koenig and Funda Cay for their support during the study and Denis Lamparter from Radiopharmacy of our department for the tracer production. We are thankful for the supportive work of Dr. Jane Halliday, who sadly passed away in October 2010.
Financial disclosure of authors: This work was funded by AstraZeneca. Bernd Pichler has received grant/research support from Siemens, AstraZeneca, Bayer Healthcare, Boehringer-Ingelheim, Oncodesign, Merck, and Bruker.
Financial disclosure of reviewers: None reported.