
Abstract
A methodology to generate rat brain templates for spatial normalization of positron emission tomographic (PET)/computed tomographic (CT) images is described and applied to generate three different templates for imaging of [11C]ABP688, a PET ligand binding to the metabotropic glutamate 5 receptor. The templates are based on functional (PET), structural (CT), and combined PET and CT information, respectively. The templates are created from a test–retest study under normal conditions and are used to assess the different templates by using them in the analysis pipeline of a test–retest and a blocking experiment. The resulting average nondisplaceable binding potentials (BPND) show significant (analysis of variance, p < .05) and substantial (up to 23%) differences between the different approaches in several brain regions. The highest BPND values in receptor-rich regions are obtained using the PET-based approach. This approach also had the smallest variability in all tested regions (standard error of measurement of 9% versus 14% [PET/CT] and 20% [CT]). All approaches showed similar relative changes in BPND values with increased blocking. Taken together, these results suggest that the use of the tracer-specific PET-based template outperforms the other approaches with the performance of the combined PET/CT template between those of the PET and the tracer-independent CT template.
SPATIAL NORMALIZATION of brain images is an image-processing step in small animal positron emission tomographic (PET) neuroimaging that maps the PET images from different subjects into a common reference space by coregistering the individual subject's image to a template image, or atlas, through a nonrigid registration. 1 The template is defined in a reference space (e.g., Paxinos rat brain stereotaxic space, 2 wherein effects can be anatomically localized. Brain normalization thus facilitates group comparison and allows accurate automated voxel-based image analysis (e.g., statistical parametric mapping) or regional analysis using predetermined volumes of interest (VOI).3,4
One approach that is often used directly coregisters the individual subject's PET image to a template image. A multimodal PET to magnetic resonance imaging (MRI) template can be considered for some tracers, but, ideally, the template image used is specifically designed to mimic the spatial distribution of a given PET tracer to improve the accuracy of spatial normalization and to improve the statistical sensitivity.5–7 Several such tracer-specific rat brain PET templates, using an MRI-based synthetic PET image5,8 or an averaged PET image obtained from scans under normal conditions,3,9 have previously been constructed for a variety of PET tracers. Whereas synthetic PET templates can be defined directly in the reference space, the average PET image templates require a mapping to the reference space. A possible concern with PET tracer–specific templates is that different (patho)physiologic conditions can alter tracer uptake patterns and the use of a normal PET template can potentially bias the normalization. 7
Alternative spatial normalization approaches make use of an additionally acquired anatomic image to ensure independence of the normalization step and the statistical analysis of the functional PET images. This approach allows using the same anatomic template image in the analysis pipeline of different PET tracers if similar animals are used. In addition, this approach often also has the added benefit that although the functional PET uptake pattern changes under different conditions, no anatomic changes occur. MRI provides anatomic imaging with soft tissue contrast in the brain and is thus ideally suited to define the mapping to the reference space (i.e., brain normalization). 10 This MRI-based mapping could then be copied over to PET images when a reliable coregistered MRI/PET data set is available. However, on many occasions in rat brain PET imaging, this is not the case due to the limited installation base of combined small animal PET-MRI systems. In addition, it has been shown for human brain imaging that the tracer-specific PET template approach was superior to the multimodal MRI/PET approach, which was attributed to the additional PET to MRI coregistration step. 6 As an alternative to the MRI, a CT scan visualizing the skull could be considered. Combined small animal PET/CT scans (hardware-based fusion) are readily available and generally acquired in PET imaging studies to provide scatter and attenuation correction for PET image reconstruction.11,12 Unfortunately, the CT image from these small animal PET/CT systems lacks soft tissue contrast. A similar approach is to make use of an additional [18F]NaF PET scan to visualize the skull. 13
Here [11C]ABP688, a tracer for the metabotropic glutamate receptor type 5 (mGluR5), rat brain PET/CT imaging is considered. Preliminary analysis revealed unsatisfactory elastic PET to MRI template registration for this tracer, and this article describes the development and evaluation of alternative template-based approaches. Brain PET, CT, and PET/CT templates of [11C]ABP688 are generated in a reference space from a set of [11C]ABP688 PET/CT scans acquired under normal physiologic conditions. The mapping of such a template to a reference space was based on a single high-count PET/CT and MRI data set. This approach holds the middle between approaches that do require an animal-specific MRI for each animal 6 and approaches that avoid the use of a combined PET/CT and MRI data set, for example, by considering a mutual information maximization of averaged PET to an MRI reference image. 3
The template creation methodology described here can be applied to other tracers. Besides validation of the PET template, the main objective of this work was to investigate the possibility of using a tracer-independent CT-based template. We investigated how much image quality is lost for the benefit and convenience of being tracer independent and how much more robust to (patho)physiologically induced changes in tracer uptake such a CT-based template is compared to a PET-based approach. Additionally, we investigated if a combined PET/CT-based template could improve the normalization procedure by combining complementary CT and PET information. The performance of the three different spatial normalization strategies, using one of the three different brain templates, was investigated in a regional and voxelwise analysis of test–retest data. Additionally, to validate the appropriateness of using the normal template to detect changes in [11C]ABP688 binding under different (patho)physiologic conditions, the performance of the normalization strategies was assessed under conditions of altered uptake contrast by introducing different levels of blocking of the mGluR5 receptor. The described validation of different brain normalization approaches is of interest as it is important to minimize methodology-related variation when analyzing rat brain PET/CT images.
Materials and Methods
Animals
Experimental animal data were acquired as part of a larger study on the use of [11C]ABP688 to image mGluR5 in vivo in rat brain. 14 The study was approved by the Animal Experimental Ethical Committee of the University of Antwerp (2011–67) and was in accordance with the European Ethics Committee (decree 86/609/CEE). Twenty-two Sprague-Dawley rats (Charles River Laboratories, Chatillon-sur-Chalaronne, France) weighing 275 to 350 g on arrival were housed in individually ventilated cages under environmentally controlled conditions with food and water ad libitum. The animals were divided into three cohorts: a test–retest group (n = 12 animals), a group for the blocking study (n = 9 animals), and a single animal as a reference (see below).
Radiosynthesis
Radiosynthesis was performed as previously reported. 14 The average specific activity at the end of synthesis for the test–retest study was 55.65 ± 9.83 GBq/μmol (average ± standard deviation), 41.78 ± 9.68 GBq/μmol for the blocking experiment, and 67.53 GBq/μmol for the PET/CT and MRI experiment (see below).
Imaging Experiments
Three sets of imaging data were used in this study: a test–retest data set, a blocking data set, and a reference animal that underwent a combined high-count PET/CT and MRI.
The test–retest data set was part of a study that considered three [11C]ABP688 PET scans on three different days per animal: one test, one retest, and one pharmacologic challenge using N-acetylcysteine (NAc) 14 each time separated by at least 48 hours to allow for washout of effects.14,15 The NAc-treated animals are left out of the data analysis here. The three conditions were performed in randomized order, in this case, allowing the condition termed retest to be performed, at random, before or after the condition termed test. Animals weighed 360 ± 34 g at the time of the scan and were intravenously injected with 29.23 ± 5.75 MBq of [11C]ABP688, whereas the injected mass dose of ABP688 was 3.00 ± 0.20 nmol/kg. Data from one animal were excluded from our experiments as there was an artifact in the CT image of the test scan; thus, 11 image pairs were considered.
The blocking data set consisted of 15 images (5 doses; n = 3 per predose concentration). The blocking experiment was performed each time on three animals, which were pretreated (20 minutes before injection of [11C]ABP688) with an intravenous injection of cold ABP688 in one of the five different doses. To achieve the required 15 images, some animals were scanned at two different predose concentrations, but each time with sufficient time (> 48 hours) between subsequent scans. The total amounts of injected mass dose (pretreatment plus tracer bolus) for the five different blocking doses were 12.94, 40.68, 75.36, 352.79, and 3473.89 nmol/kg, respectively. Animal weight at the time of the scan was 456 ± 47 g, and average injected activity was similar (30.21 ± 14.73 MBq) to that in the test–retest experiment.
The animal used for the high-count PET/CT and MRI experiment weighed 380 g, was injected with 51.43 MBq (≈ 1.7 times the activity of the test–retest and blocking experiment—hence, a high count), and the total injected tracer mass dose was, accordingly, 11.74 nmol/kg.
PET/CT imaging was performed on two dedicated small animal PET/CT imaging systems (Siemens Inveon [Siemens Medical Solutions, Knoxville, TN] docked PET/CT and Siemens Inveon multimodal PET/CT),16–18 which have a reconstructed image resolution of approximately 1.4 mm at the center of the field of view. Animals were randomized over the two scanners, but each animal received its test–retest scan on the same scanner. The blocking experiment was performed on the docked PET/CT scanner only, and the high-count PET/CT/MRI acquisition was performed on the multimodal PET/CT. PET data were acquired for 60 minutes in list-mode format, and tracer was injected immediately after the start of the PET acquisition. After PET scanning, a CT image was acquired in three bed positions. Animals were anesthetized (1.5% isoflurane mixed with medical oxygen) during the whole PET/CT procedure.
PET data were reconstructed into a single static image of the full 60 minutes and into 33 temporal bins of increasing duration (12 × 10, 3 × 20, 3 × 30, 3 × 60, 3 × 150, and 9 × 300 seconds) using two-dimensional ordered subset expectation maximization with 4 iterations and 16 subsets after Fourier rebinning using the manufacturer's software (Siemens IAW, version 1.5.0.28). The two different PET reconstructions will be referred to as the static PET and the dynamic PET images, respectively. Normalization, dead time correction, random subtraction, CT-based attenuation, and single-scatter simulation scatter corrections were applied. PET images were reconstructed on a 128 × 128 × 159 image grid with a voxel size of 0.776 × 0.776 × 0.796 mm.
For the high-count PET/CT and MRI experiment, the animal was positioned on an interchangeable animal bed during a single anesthesia and fixed position session (1.5% isoflurane mixed with medical oxygen) for MRI scanning, transport from the MRI scanner to the PET/CT scanner, and PET/CT scanning. A T2-weighted image was acquired on a dedicated 9.4 T small animal MRI scanner (Brucker BioSpec MRI [Billerica, MA]) using a fast spin echo sequence (repetition time [TR] = 2500 ms, 8 echos with effective echo time [TE] = 44 ms). The final 96 × 46 × 256 MRI had a voxel size of 0.12 × 0.26 × 0.39 mm, and the total scan time was 23 minutes.
Template Creation
The entire template creation is illustrated by Figure 1 and consists of three distinct procedures:
Iteratively averaged image. The template images were created from the test–retest data and included 22 images (11 animals, two scans per animal). Three different templates were created using a similar methodology, which include the PET, the CT, and the PET/CT images. The PET and the CT templates were generated from the static PET images and thresholded CT images, respectively. The PET/CT template was constructed from the weighted sum of the static PET and thresholded CT images from the same scan.
Reconstructed images were processed in Pmod version 3.3 (PMOD Technologies Ltd., Zurich, Switzerland). Static and dynamic PET and CT images were first cropped to a manually drawn rectangular region containing the head of the animal and were then resampled to an isotropic voxel size of 0.2 mm. Because minor motion was observed between the PET and CT images in some cases, all CT images were coregistered to the corresponding static PET images using rigid registration based on the normalized mutual information criterion and the downhill simplex algorithm. For the template creation, the CT images were then expressed in Hounsfield units and values below 700 were set to zero. This lower threshold was chosen to remove the soft tissue CT signal so that only bone contrast was visible in the thresholded images. For the weighted PET/CT sum, the static PET image was expressed as standardized uptake values (i.e., tissue concentration/injected activity /animal weight), and the thresholded coregistered CT image was divided by 3,000 before summing. This weight was qualitatively determined based on a representative balance between the signal from the PET and the signal from the scaled CT. These next steps were then repeated for the static PET, the thresholded CT, and the summed PET/CT images, respectively: an initial image (either static PET, thresholded CT, or summed PET/CT) was first manually aligned to the transverse, sagittal, and coronal orientations. The other images were then rigidly coregistered with this initial image and averaged to form an initial target. The rigid body registration was based on the normalized mutual information criterion and the downhill simplex algorithm. These images then underwent a further iterative procedure to refine this aforementioned initial target image (see Figure 1A). During each of three iterations, the individual images were spatially normalized to the current target using an additional elastic registration. After this registration, the images were then averaged to form the new target for the next iteration. The aforementioned elastic spatial normalization was performed in Pmod version 3.3 using the Brain Normalization tool with default parameters for rat brain images (16 nonlinear warping iterations, sampling rate 0.8 mm, and frequency cutoff 3) without image mask. This Pmod Brain Normalization was implemented according to the methodologies used in SPM5 (Welcome Department of Cognitive Neurology, London, UK)19,20 as per the Pmod version 3.3 manual.
Iteratively averaged image to high-count PET/CT and MRI. To transform the iteratively averaged PET, CT, and PET/CT images to a standard space, the high-count [11C]ABP688 PET/CT and MRI data set was used. First, the high-count static PET and CT images were cropped and the CT was coregistered to the static PET as described above. The CT was then coregistered to the MRI using mutual information-based rigid body registration after careful initial manual alignment (see Figure 1B). The coregistration was aided by the fact that PET/CT and MRI acquisitions were performed during a single anesthesia session using a common bed with the animal in the same position during PET/CT and MRI scanning. The rigid body CT to MRI transformation was then also applied to the static PET image (already coregistered with the CT). The transformed high-count PET and CT images were then weighted and summed to form a PET/CT image already coregistered with the MRI. The iteratively averaged PET, CT, and PET/CT images from the previous section were then spatially normalized (elastic registration using Pmod's Brain Normalization) to the respective counterpart images of this high-count data set, which had been coregistered with this animal's MRI.
Template to reference space. The MRI from the previous section was then spatially normalized to a T2-weighted MRI rat brain template in standard space 9 using the elastic Brain Normalization tool in Pmod version 3.3 with default parameters for rat brain. Finally, the average PET, CT, and PET/CT images from the previous section were transformed to the reference space according to the latter MRI to MRI template transformation (see Figure 1C), and the resulting transformed images constitute the final PET, CT, and PET/CT template images in reference space.
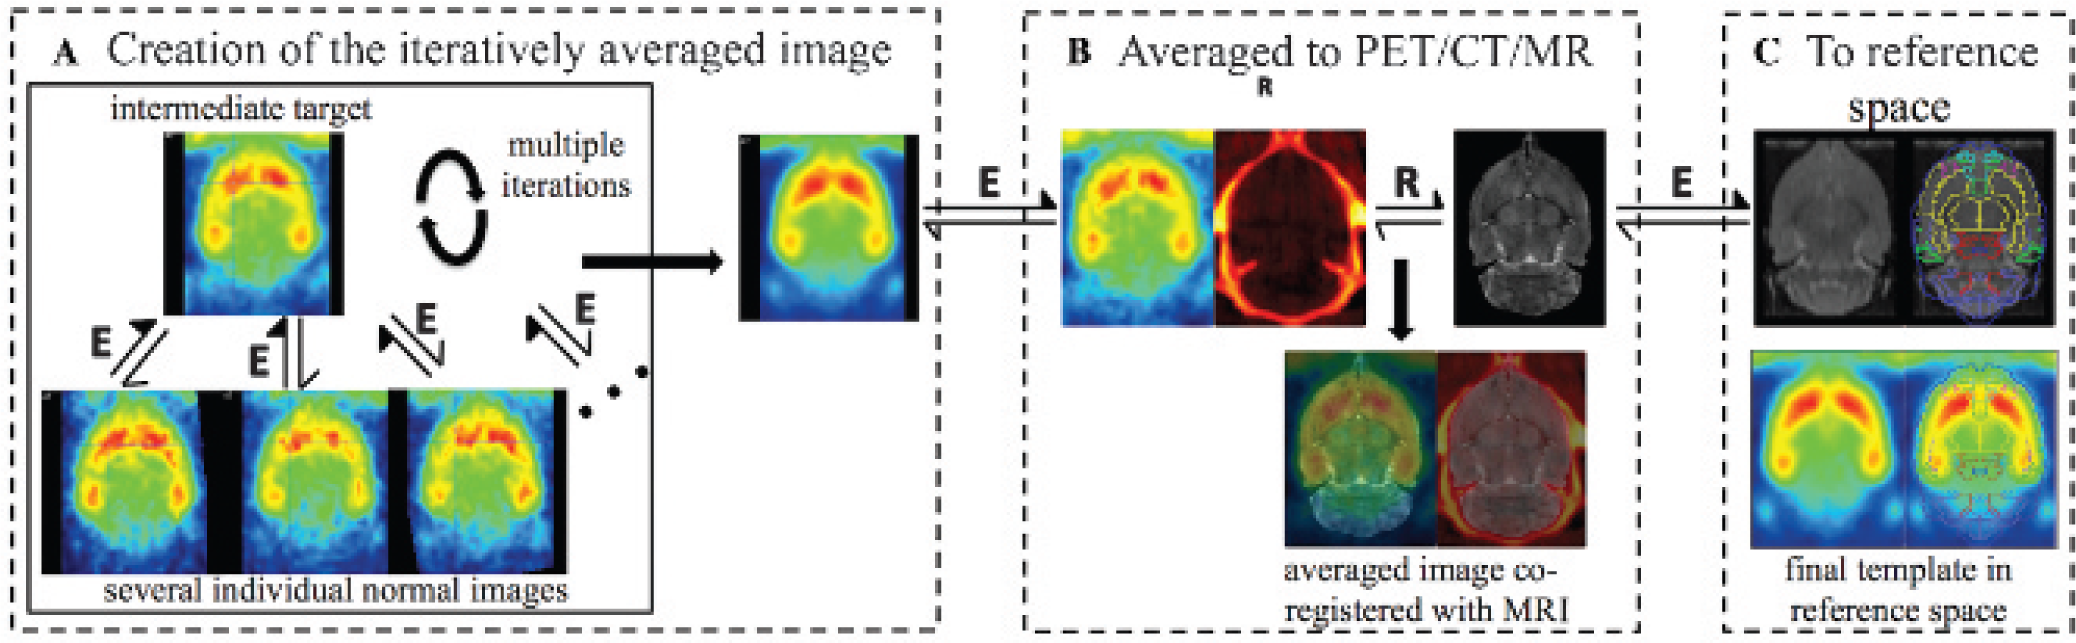
Creation of the [11C]ABP688 PET template. A, Creation of the iteratively averaged image using several individual [11C]ABP688 images. B, Coregistration of the average image to the high-count [11C]ABP688 PET/CT and MRI data set. C, Final transformation to the reference space based on the MRI coregistration. A similar methodology was used for the creation of the PET/CT and CT templates. E = elastic registration; R = rigid body registration.
Template Evaluation Experiments
To assess the performance of the different templates, the test–retest data and the blocking experiment data were analyzed with three different approaches. For each of these analyses, a different normalization approach was used. These normalization approaches calculate the mapping to the reference space by spatial normalization of the individual rat brain image (PET, CT, or PET/CT) to one of the three different brain target templates (PET, CT, or PET/CT), respectively. The spatial normalization consisted of an initial normalized mutual information-based rigid body registration followed by elastic registration using the Brain Normalization tool in Pmod version 3.3 with default parameters for rat brain. The approaches will be referred to as the PET-based, CT-based, or PET/CT-based approach. For the three normalization approaches, the moving image was the corresponding animal-specific PET, CT, or PET/CT image, respectively. The blocking experiment, introducing changes in the [11C]ABP688 uptake contrast, was included to test the impact of different (patho)physiologic conditions on the performance of the different normalization strategies.
Next, the nondisplaceable binding potential (BPND) was calculated. Therefore, the dynamic PET images were transformed according to these three different transformations. Accordingly, the time-activity curves (TACs) for several predefined MRI template VOI available in Pmod version 3.3 were extracted from the dynamic images (left and right striatum, 43.5 mm3; frontal cortex, 2.8 mm3; prefrontal cortex, 12.6 mm3; orbitofrontal cortex, 37.9 mm3; whole cortex 631.4 mm3; left and right hippocampus, 34.8 mm3; left and right thalamus, 30.7 mm3; cerebellum, 197.0 mm3; and whole brain, 2.23 cm3). The BPND of [11C]ABP688 for the different VOI was then calculated from the TACs using the simplified reference tissue model 21 with the cerebellum as the reference region. 8 Finally, voxelwise parametric BPND images were calculated from the spatially normalized dynamic PET images using the two-parameter multilinear reference tissue model (MRTM2).22,23
For the regional test–retest analysis, the following measures were calculated for the three different analysis pipelines considering the PET-, CT-, or PET/CT-based normalization, respectively. The mean regional test–retest

To assess the spread in the BPND measurement errors or reliability for the three different approaches, the standard error of measurement (SEM) for each approach was calculated and expressed as a percentage of the mean test–retest

where MSE is the mean square error calculated from a repeated measures ANOVA between test and retest. 24 The SEM is an estimate of the variability of the observed scores when the true score is held constant. 25 The SEM is also related to the minimum difference (MD) to be considered real in an individual animal (MD = 2.77 × SEM). 24 The ANOVA calculation was performed in SPSS version 20, and the SEM was calculated only after verification that there were no significant differences between the test and retest values. This was done for each approach and for each region. Left versus right BPND was also similarly analyzed, including both the test and retest data in the striatum, hippocampus, and thalamus. ΔBPND (%) and SEM (%) were herein calculated by contrasting left versus right.
For the voxelwise statistical analysis of the test–retest data, voxel-based statistical parametric mapping (SPM) of the BPND images was performed using SPM8 (Welcome Department of Cognitive Neurology, London, UK) within a one-way repeated measures ANOVA design to detect differences of the mean. An F contrast, testing for any difference between the three normalization methods, and six T contrasts, testing for, respectively, increased and reduced BPND values comparing PET versus CT, PET/CT versus CT, and PET versus PET/CT, respectively, were designed. Voxels that passed the omnibus F test at a significance level of .001 (uncorrected) defined a mask for the subsequent post hoc T contrasts. T maps were thresholded at a significance level of .05 (uncorrected) with an extent cluster threshold of 130 voxels (≈ 1 mm3). This cluster size was chosen as it represents approximately the microPET's spatial resolution. To detect significant differences in variance at the voxel level between the normalization methods, six one-tailed two-sample F tests were performed in Matlab (The MathWorks, Natick, MA). F maps were thresholded at a significance level of .05 (uncorrected). In addition, to better visualize the differences on the voxel level, image profiles through the BPND average and standard deviation images were calculated.
To assess the stability of the templates under physiologically induced altered tracer contrast and to test if the templates are appropriate to detect changes in tracer uptake, the mean BPND at the five different levels of blocking with ABP688 was calculated
Results
Template Creation
Slices through the three different resulting brain template images are shown in Figure 2. The [11C]ABP688 PET template image shows pronounced tracer uptake in the striatum and hippocampus. The uptake pattern is in accordance with the distribution pattern on autoradiography. 8 Additional regions of high tracer uptake are the medial prefrontal cortex and cingulate cortex, among others. The PET/CT template image combines the skull image features of the CT with the [11C]ABP688 uptake image features of the PET. Both the PET and the PET/CT template images are tracer specific.

Slices through the three different rat brain template images in reference space: (A) PET template, (B) PET/CT template, (C) CT template, and (D) the T2-weighted MRI in reference space available in Pmod version 3.3.
Template Evaluation Experiments
Example spatial normalization results for one animal after spatial normalization using the three different normalization approaches are shown in Figure 3 for both the test–retest data (Figure 3, A–C), as well as the blocking data at the highest level of blocking (i.e., total amount of injected mass dose 3473.89 nmol/kg) (Figure 3, D–F). From the PET image in Figure 3D, it can be seen that there is almost no specific binding anymore. This presents a challenging case for the registration of PET to the normal PET template that has a specific [11C]ABP688 uptake pattern. Similarly, the PET/CT image (see Figure 3E) does not show the specific PET uptake pattern anymore. Only the appearance of the CT image (see Figure 3F) has not changed as no structural changes were introduced.

Left (A–C), example spatial normalization results for the test–retest data using the PET- (A), PET/CT- (B), and CT- (C) based approaches. Right (D–F), example results for the blocking data set corresponding to the highest level of blocking (injected mass dose = 3473.89 nmol/kg) using the PET- (D), PET/CT- (E), and CT- (F) based approaches.
The regional test–retest results are shown in Figure 4, and significant differences in regional BPND (ANOVA, p < .05) are found. The largest percentage differences in BPND of the PET- versus CT-, PET/CT- versus CT-, and PET-versus PET/CT-based values are 23.3 ± 1.2% (frontal cortex), 14.0 ± 0.5% (frontal cortex), and 12.3 ± 0.4% (cortex), respectively. The percentage differences in the striatum are 6.6 ± 0.5% (PET versus CT), 7.3 ± 0.2% (PET/CT versus CT), and 0.8 ± 0.3% (PET versus PET/CT). Figure 4B shows the distribution of the ΔBPND(%) between test and retest for each animal in all selected regions using boxplots. For all regions except the thalamus, the spread of ΔBPND(%) values is largest when using the CT template and smallest when using the PET template. For the thalamus, the spread is similar for all three approaches. To better quantify the spread, the SEM(%) was calculated (see Figure 4C). Figure 4C indicates that in all regions, the SEM is largest for the CT-based approach, whereas for almost all regions, SEM is smallest for the PET-based approach. The only exception is again the thalamus, where the values are similar for the three approaches (smallest for the PET/CT-based approach). The mean SEM(%) averaged over all regions is 9% (range 7–14%), 14% (range 11–21%), and 20% (range 16–33%) for the PET-, PET/CT-, and CT-based approaches, respectively. The ANOVA performed to calculate the SEM also indicated that no significant differences existed between test and retest values, for all three normalization strategies (all p values were > .075). The results for the left versus right analysis are shown in Figure 5. It can be seen that both the distribution of ΔBPND(%) values and the SEM are similar for all three approaches except in the hippocampus, where the ΔBPND spread and the SEM value are substantially larger for the CT-based approach. The mean SEM(%) averaged over the three regions is 3.3% (range 2.3–4.7%), 3.5% (range 2.6–4.5%), and 4.6% (range 2.4–6.9%) for the PET-, PET/CT-, and CT-based approaches, respectively. This indicates that all three spatial normalization approaches preserve the left-right symmetry relatively well.

Test–retest results. Impact of the three different rat brain normalization strategies using either the PET, PET/CT, or CT template on the [11C]ABP688 test–retest results for different brain regions. A, Average BPND ± SE (*ANOVA, p < .05; **ANOVA, p < .01; ***ANOVA, p < .005). B, Boxplot of the ΔBPND(%) (test–retest) values; whiskers indicate the 5th and 95th percentiles. C, Standard error of measurement (SEM(%)). ctx = whole cortex; fctx = frontal cortex; hipp = hippocampus; ofctx = orbitofrontal cortex; pfctx = prefrontal cortex; Str = striatum; tha = thalamus; wb = whole brain.
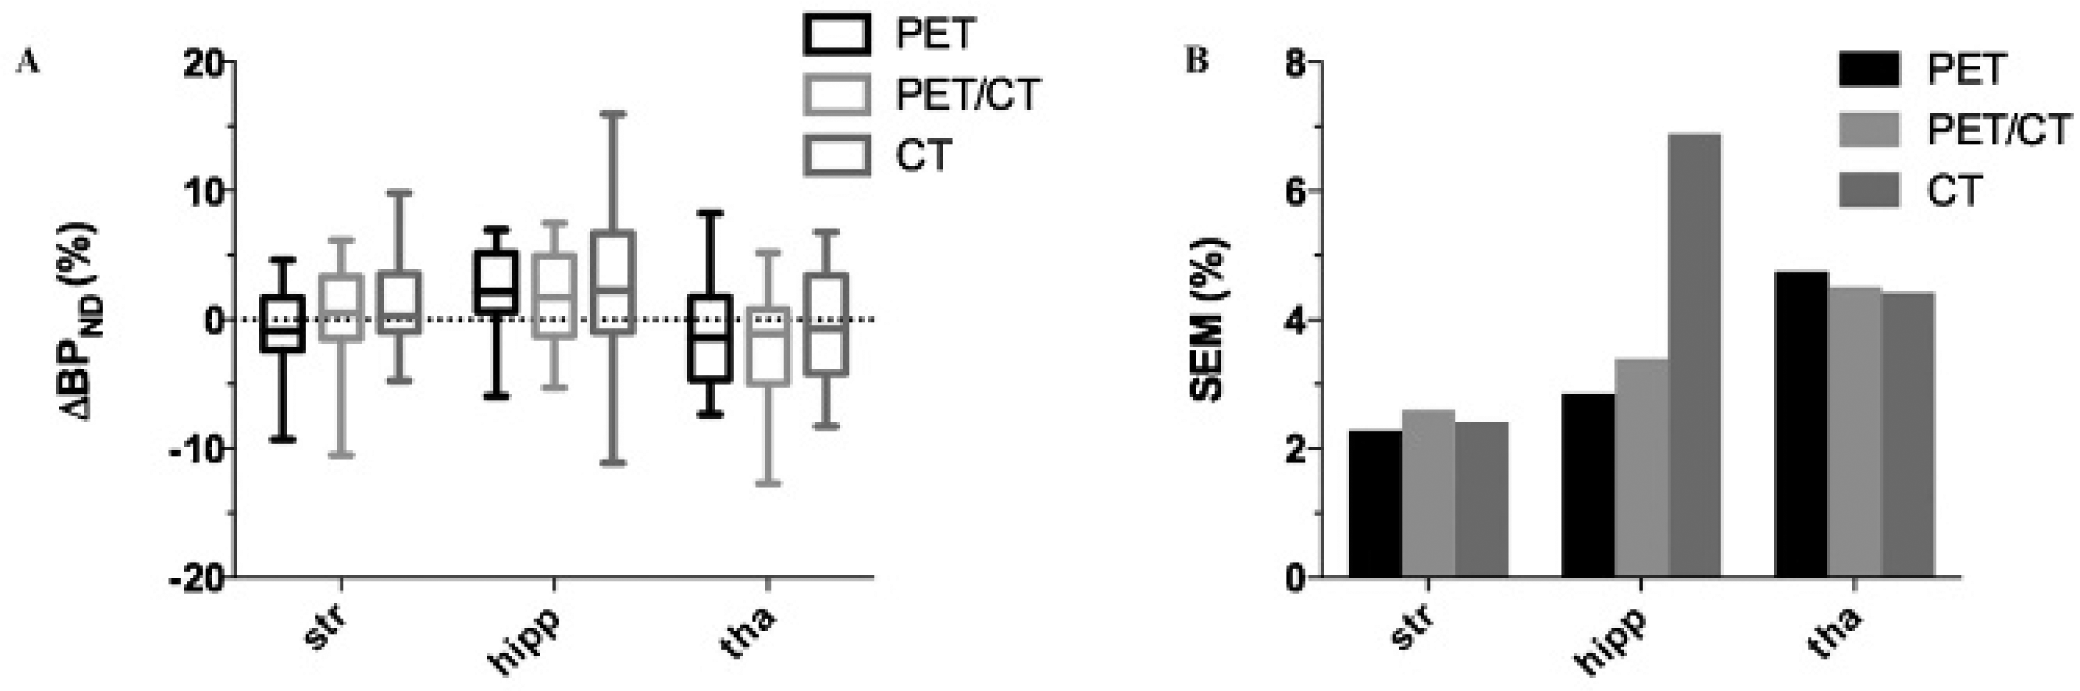
Left-right results. Impact of the three different rat brain normalization strategies on the [11C]ABP688 left-right results for different brain regions. A, Boxplot of the ΔBPND(%) (left-right) values; whiskers indicate the 5th and 95th percentiles. B, Standard error of measurement (SEM(%)). hipp = hippocampus; Str = striatum; tha = thalamus.
The voxel-based analysis of the test–retest data revealed significantly different means between the different normalization strategies, as shown in Figure 6, A to C. The pattern was in accordance with the regional analysis shown in Figure 4A. The PET normalization resulted in large areas of increased activity located in the striatum, hippocampus, and cortices (except for the entorhinal cortex) when compared to the CT-based normalization. Similarly for PET/CT compared to CT normalization, there were large areas of increased activity located in the striatum, hippocampus, and motor and cingulate cortices. For both PET versus CT and PET/CT versus CT, small areas of significantly reduced activity were found in the entorhinal cortex and hypothalamus. For the PET versus the PET/CT normalization, increased activity was found in the cortices (except the entorhinal cortex) and the hippocampus and large regions of reduced activity were found in the thalamus, hypothalamus, midbrain, and septum. The F test revealed significant differences in the variance between the different normalization approaches, in line with the results from the regional analysis as shown in Figure 6, D to F. For the PET-based normalization, 46% and 22% of the voxels showed a significant lower variance compared to the CT-and PET/CT-based normalization, respectively, whereas only 4% of the voxels showed a significantly higher variance compared to both the CT and PET/CT. For the PET/CT- compared to the CT-based normalization, 10% and 3% of the voxels showed significantly lower and higher variance, respectively. To better visualize the differences on the voxel level, profiles through the average and standard deviation images from the test–retest data set are show in Figure 7. The average BPND values in the maximum are 3.21 ± 0.11, 3.18 ± 0.12, and 2.95 ± 0.15 for the PET-, PET/CT-, and CT-based normalization approaches, respectively. The average BPND values in the local minimum located between the left and right striatum for these approaches are 2.44 ± 0.09, 2.43 ± 0.11, and 2.34 ± 0.11, respectively. As a result, there is a lower contrast between the striatum and its neighboring regions when normalization is based on the CT template (BPND difference between local minimum and maximum = 0.61 for the CT-based normalization versus 0.77 for the PET-based normalization). The averaged standard deviation in the interval for which the PET-based mean BPND is greater than 1.5 is 0.33, 0.38, and 0.45 for the PET-, PET/CT-, and CT-based approaches, respectively.
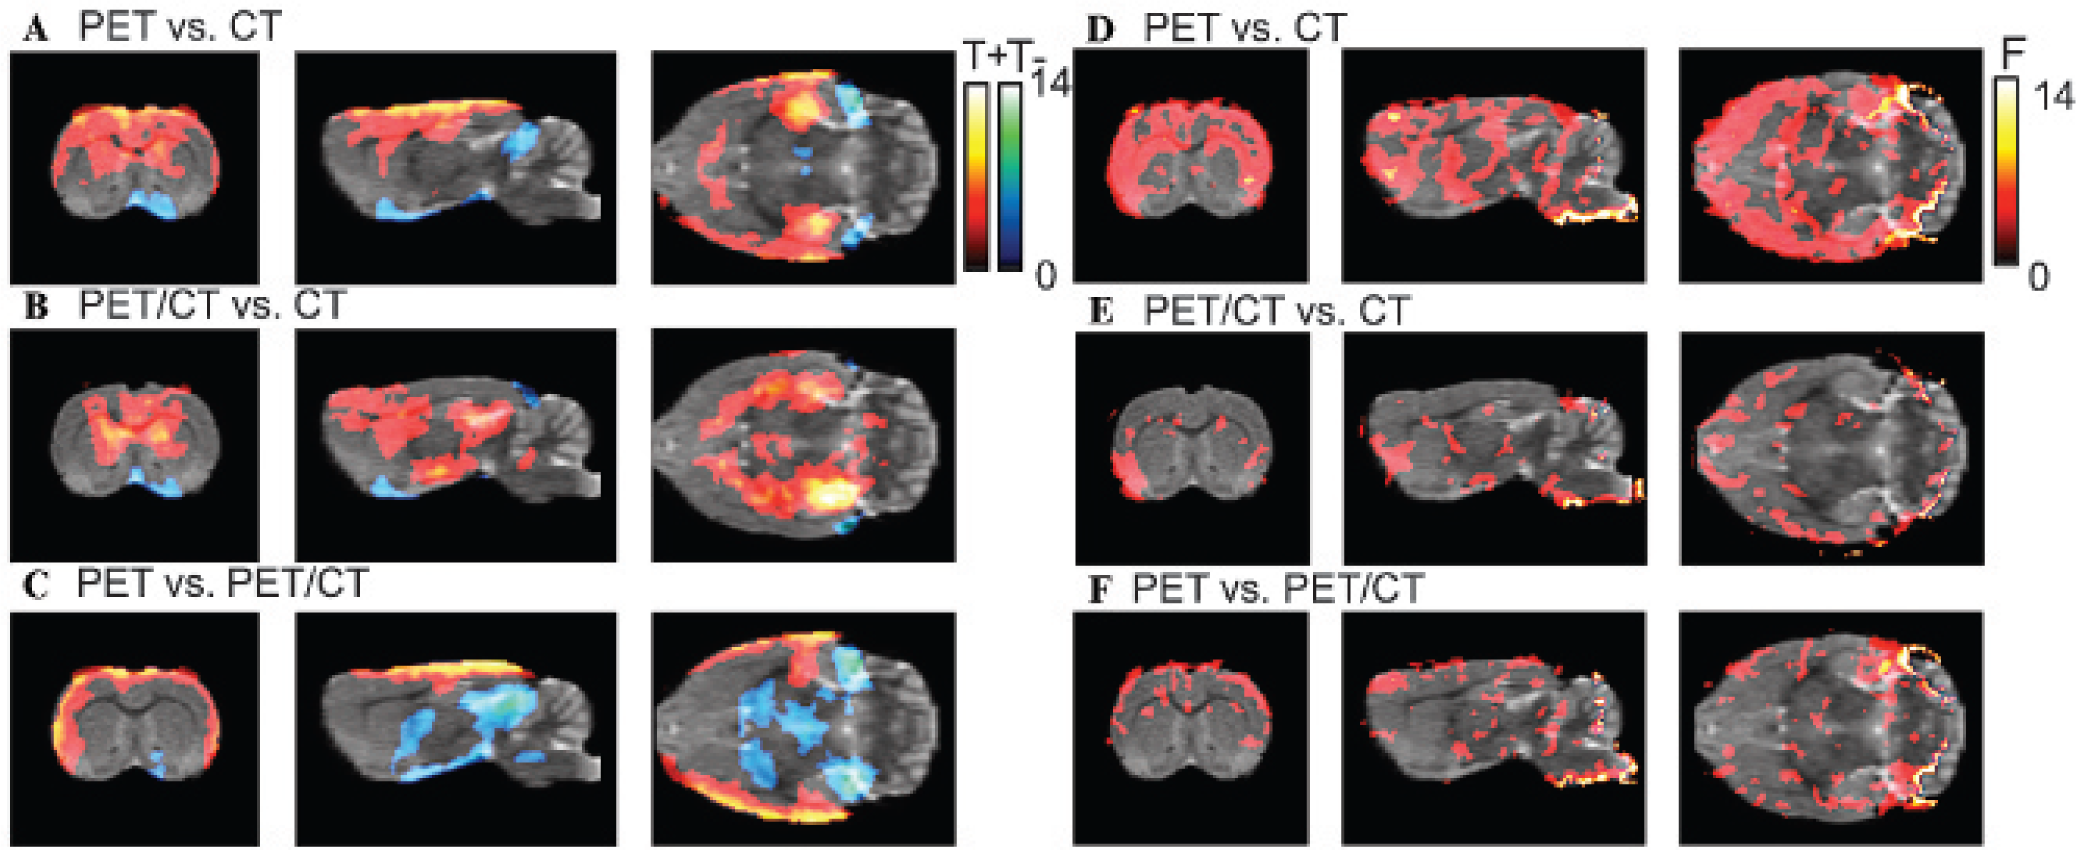
Left (A–C), thresholded T maps from statistical parametric mapping analysis of the indicating voxels of significant differences for PET-versus CT- (A), PET/CT- versus CT- (B), and PET- versus PET/CT- (C) based approaches. The hot colormap (T+) corresponds to activity in A significantly greater than in B in the A versus B pair. The blue-green colormap (T–) corresponds to A significantly lower than B. Right (D—E), thresholded pairwise F maps indicating voxels with significant lower variance in A compared to B for the PET- and CT- (d), PET/CT- and CT- (e), and PET- and PET/CT-based approaches.

Profiles through the mean (B) and standard deviation (C) of the spatial normalized static PET images in the reference space. The images were transformed to the reference space according to the transformation calculated from spatial normalization to the PET, PET/CT, and CT template, respectively. The horizontal white line in A indicates the location of the profile.
The response in terms of BPND to the five different doses of unlabeled ABP688 is shown in Figure 8. The decaying trend with increasing dose is similar for all three spatial normalization approaches for all tested regions except for the thalamus. This can also be concluded from Table 1, showing the results for the relative BPND reduction for the third level of blocking relative to the lowest level of blocking. When excluding the thalamus, the relative BPND reduction averaged over the different regions is 48 ± 7%, 54 ± 12%, and 56 ± 13% for the PET-, PET/CT-, and CT-based approaches. Although, at the third dose level, the relative BPND reduction obtained with the PET-based approach is slightly lower than that obtained from the PET/CT- and CT-based approaches, the differences between the different methods are within the measurement uncertainties. The results for the thalamus deviate from the trend seen for the other tested regions. The PET- and PET/CT-based methods do not represent the dose response well at the two lowest doses, whereas the BPND decrease for higher dose levels was lower than in the other regions. The relative reductions in the thalamus between the third and first dose levels for the PET, PET/CT, and CT approaches are 10 ± 1%, 51 ± 7%, and 39 ± 9%, respectively.
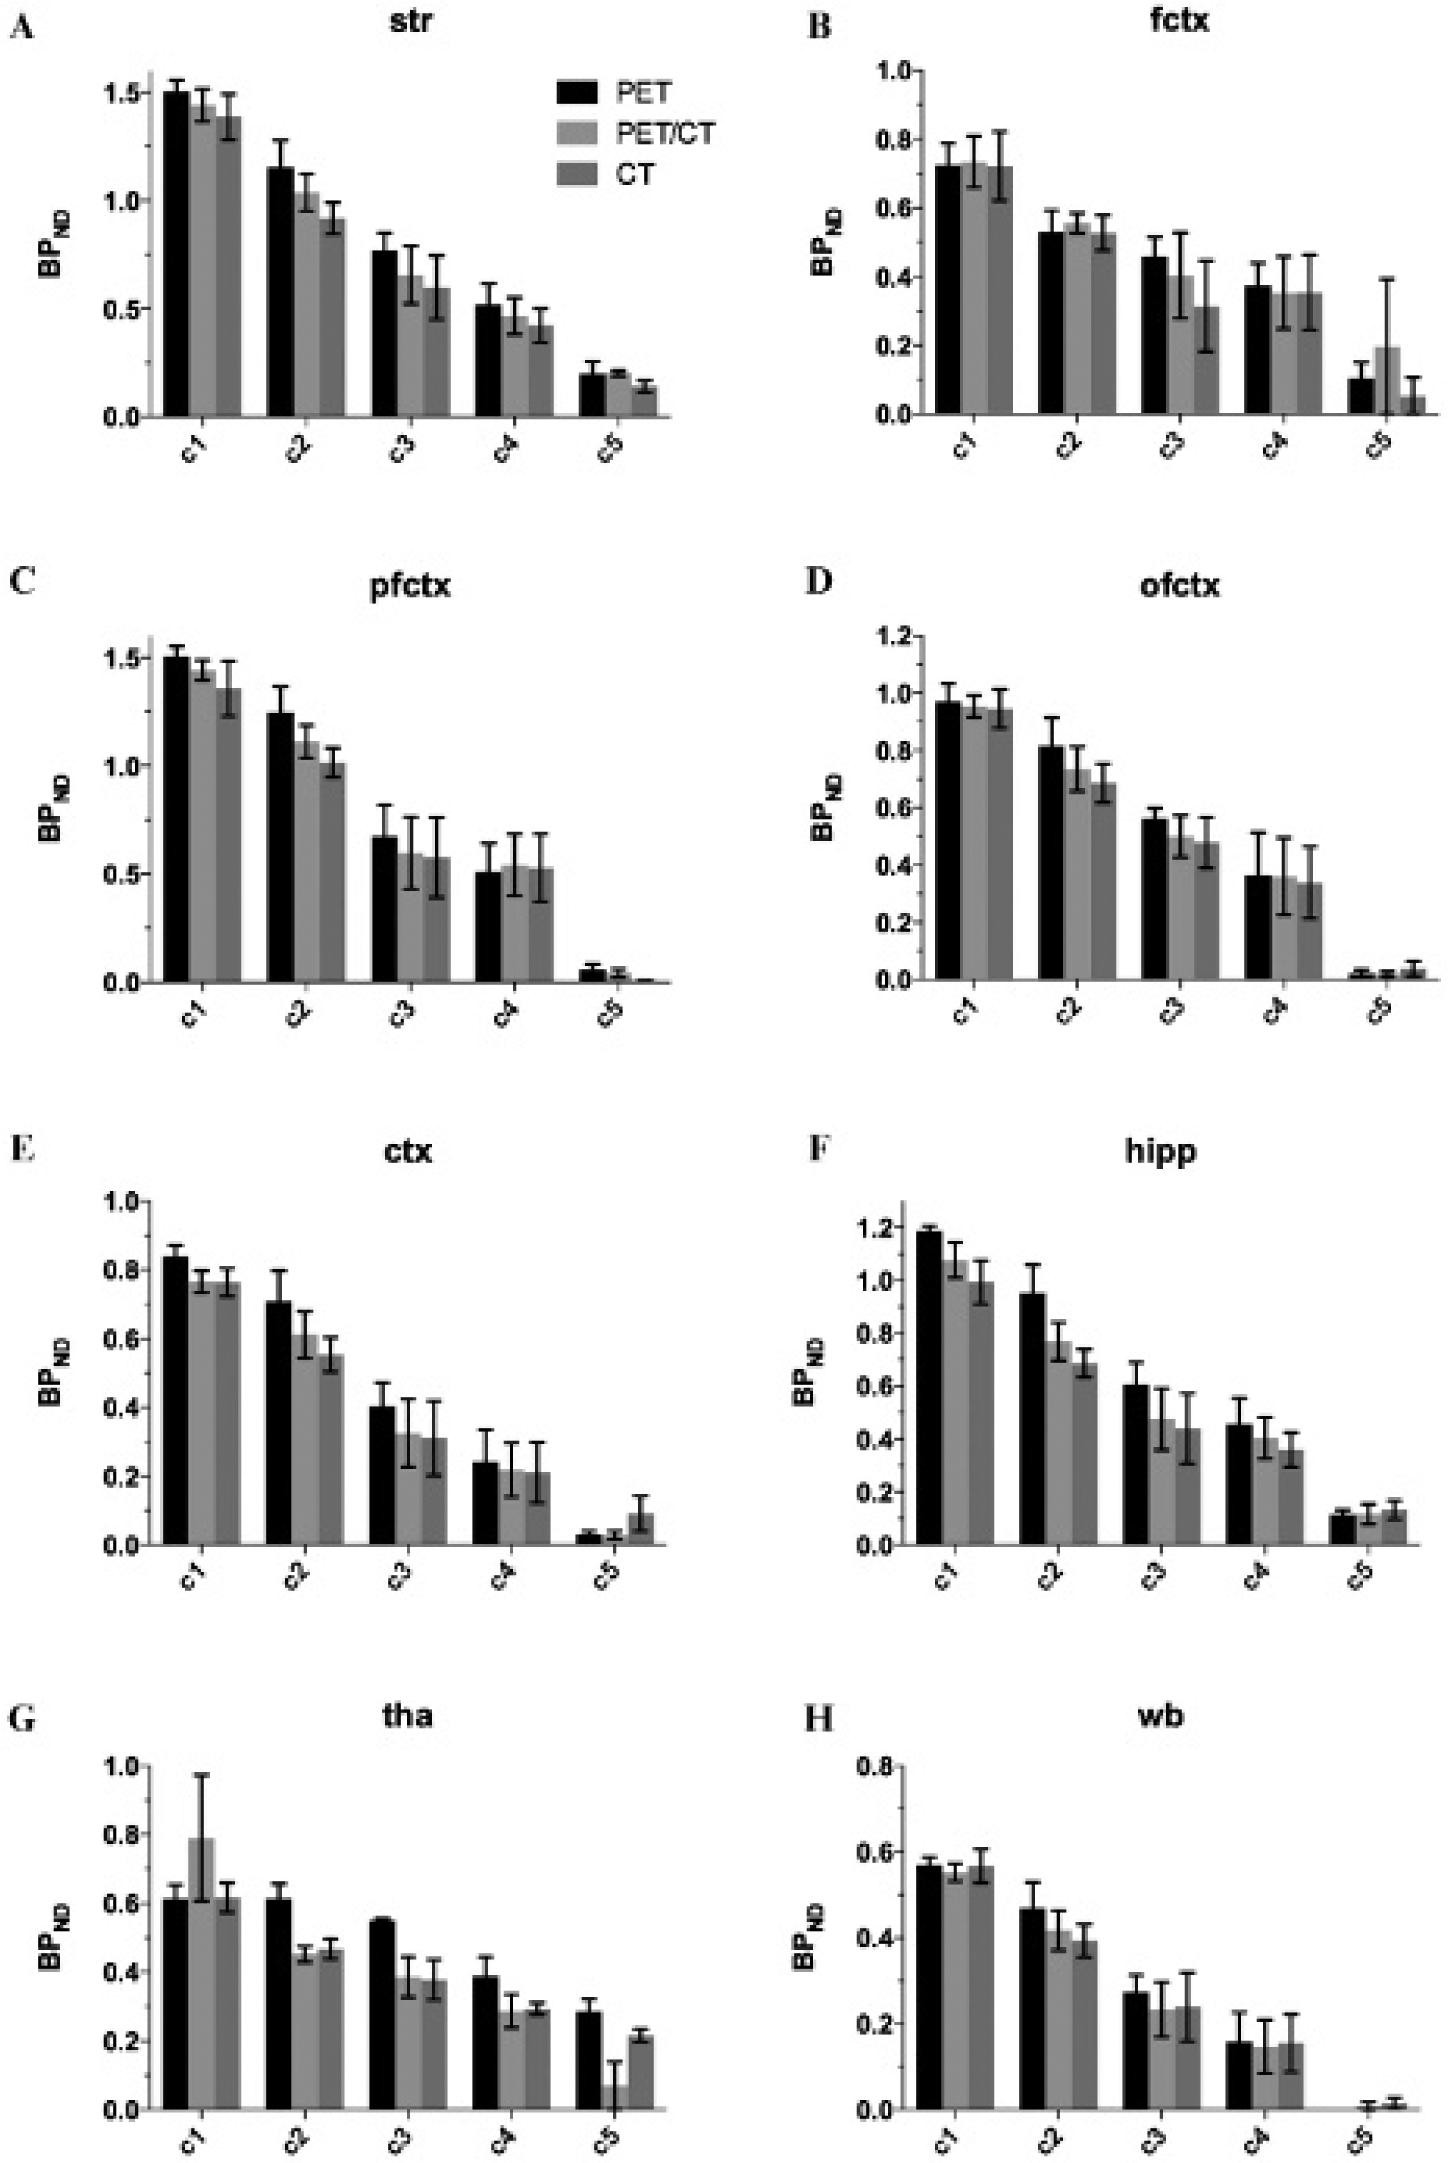
Average BPND ± SE (%) after pretreatment with different masses of cold ABP688 for different regions (A–H; regions as in Figure 4). The blocking levels c1–c5 correspond with mass doses of 12.94, 40.68, 75.36, 352.79, and 3473.89 nmol/kg. ctx = whole cortex; fctx = frontal cortex; hipp = hippocampus; ofctx = orbitofrontal cortex; pfctx = prefrontal cortex; Str = striatum; tha = thalamus; wb = whole brain.
Relative BPND Reduction (± SE) after Pretreatment with a Cold ABP688 Dose of 75.36 nmol/kg (Third Dose Level) Relative to BPND at a Dose of 12.94 nmol/kg (Lowest Dose Level)

BPND = nondisplaceable binding potential; CT = computed tomography; PET = positron emission tomography.
Discussion
A methodology to generate a rat brain PET, CT, and PET/CT template in a reference space from a normal data set is presented, and the performance of different normalization strategies using one of these template images is evaluated for the case of [11C]ABP688 rat brain imaging. These three templates were created from iteratively averaging a normal data set. Iterative averaging is frequently done for MRI template creation, 26 but to our knowledge, this has not previously been considered in rat brain PET template creation. The mapping of such an iteratively averaged image to a reference space was based on a single high-count PET/CT and MRI data set, hereby avoiding the need for an individual animal MRI or the use of intermodality registration.
When evaluating different approaches using experimental data rather than simulated data sets, ground truth BPND values are not available, and interpretation of the results should be carefully done. Given our experimental evaluation, we argue that the PET approach has the best performance from the three tested approaches. First, the PET-based approach has higher average BPND values in the high binding regions, such as the striatum, as shown by the regional analysis and confirmed by the voxelwise analysis. Indeed, the more precise the spatial normalization is, the less blurred the average image of the normalized images will be and hence the higher the BPND in these regions. Second, the variability and the SEM calculated from the test–retest data are smallest for the PET-based approach, as also confirmed by the voxelwise F maps. An increased variability could indicate a poorer spatial normalization, resulting in variability due to different amounts of activity contributed by surrounding tissue and different amounts of activity lost from the true region. Third, the blocking experiment showed that with the PET-based normalization, similar relative BPND reductions were found, indicating that the smaller variability is not attributed to a reduced sensitivity of the PET-based approach to detect BPND changes. These arguments also indicate that the CT-based approach results in the poorest performance and that the performance of the PET/CT-based approach is between the PET- and the CT-based approaches. The inferior performance of the CT-based approach might be attributed to the nonrigid spatial normalization primarily based on the deformations of the skull and the smoothness constraints of the deformable model rather than on the signal from the relevant brain regions. In addition, the CT to PET registration, that was required as for some PET/CT images there was a slight but visually apparent misregisration, could have impacted the performance of the CT based normalization. The intermediate performance of the PET/CT can be explained by balancing the information from the PET image (best performance) with that of the CT (worst performance). PET/CT-based mean BPND values are similar to the values from the CT-based approach close to the skull, although more similar to the one from the PET-based approach for the more deeply located brain regions. Adjusting the relative weights in the PET/CT template has an impact on the performance as indeed the PET and CT–based template can be thought of as extremes (weights 1 and 0). Adjusting the weights between PET and CT might further optimize the performance of the PET/CT approach, and we are convinced that the results for different ratios will vary smoothly between the reported extremes. For the thalamus, the results are not in line with the other tested regions as none of the three normalization approaches clearly performs best in the test–retest study, and in the blocking study, the dose response is not well captured. The location of the low-binding thalamus region, surrounded by high-binding regions such as the striatum and hippocampus, may be the main factor contributing to this effect.
An aspect that can impact the results is the chosen algorithm for the spatial normalization. We used a validated commercial software suite, thereby using default recommended parameters for rat brain in all three normalization strategies. Although the spatial normalization procedure is able to cope with differences in morphology and brain sizes, it is possible that the performance of the different approaches depends on how well the rat brains under study correspond to those used to define the reference space due to, for example, strain, weight, and/or age differences. In our blocking experiment, the rats were considerably heavier (+ 25%); however, the differences in skull size were small and the quality of the spatial normalization did not seem to be affected, as assessed by visual assessment and as reflected in quantitative results. The three normalization approaches considered here can also be further refined in several ways. When dynamic data are available, different static images (e.g., earlier frames or later frames only) or even a full dynamic PET template can be considered. 27 Also, an alternative to simply summing PET and CT images is to sum two cost functions (possibly with spatially dependent weights), one comparing PET to PET agreement and the other comparing CT to CT agreement. This can be done, for example, using the Advanced Normalization Tools (ANTs) (Penn Image Computing and Science Lab, Philadelphia, PA). 28 However, in this case, a balance (i.e., weight parameter) between PET and CT still needs to be selected.
One of the goals of the current study that sets it apart from previous work was to assess the performance of a tracer-independent CT-based template for robust spatial normalization compared to a tracer-specific PET template. A tracer-independent template would be advantageous as it can be used for any type of tracer and does not require the development and validation of a new template each time for another tracer. A CT-based template would be particularly appealing as in many small animal PET studies, a CT image is acquired in conjunction with PET to provide scatter and attenuation correction. Our study indicates that a CT-based spatial normalization can be used with reasonable results, which can be useful for preliminary data analysis or for cases where a PET template might not provide enough spatial information (e.g., very focal PET uptake pattern, as in inflammation) or when the disease progression would alter the uptake pattern and potentially invalidate the use of a PET template (e.g., β-amyloid PET binding in Alzheimer disease).
The PET and PET/CT templates presented here are specific for [11C]ABP688. Tracer-specific PET templates for other tracers have been successfully constructed and validated by others (e.g., Casteels and colleagues 3 ), whereas the combined PET/CT template is one of the novelties introduced by this work. Depending on the tracer distribution, we expect that with our methodology, similar results can be obtained for other tracers. In addition, although the PET and PET/CT templates are tracer specific, the results show that alterations in uptake contrast induced by blocking of the mGluR5 receptor did not invalidate the use of these templates created under normal conditions.
Conclusion
In this article, a methodology to generate brain templates for PET/CT imaging is described and is applied to generate three different templates for [11C]ABP688 rat brain imaging. The three templates are based on functional (PET), structural (CT), and combined functional and structural (PET and CT) information, respectively. The three templates are evaluated in a test–retest, a left-right, and a blocking experiment by considering three [11C]ABP688 PET analysis pipelines using one of the three templates as a target for spatial normalization. The resulting average BPND obtained from the three different approaches show significant differences. The PET-based approach resulted in higher average BPND values in receptor-rich regions such as the striatum compared to the PET/CT- and CT-based approaches. Furthermore, the PET-based approach resulted in the smallest variability, as measured by the SEM, in all but one of the tested regions. From the left-right analysis, all three templates preserved left-right symmetry in a similar fashion. When blocking the receptors using increasing amounts of nonradioactive ABP688, the three approaches showed the similar, expected, decaying trend and relative change in BPND values. These results suggest that the use of the PET-based template outperforms the other approaches, with the performance of the combined PET/CT template between those of the PET and the CT template, even in dose-response studies with a blocking challenge.
Footnotes
Financial disclosure of authors: This work was funded in part by Antwerp University, Belgium, through a postdoctoral position for J.V., L.W., and T.W.; an associate professor position for St.S.; and a full professor position for Si.S., who is also supported by a departmental position at the University Hospital Antwerp. J.V. also acknowledges support by the Belgian Science Policy Office (return grant selection 2011) and the Research Foundation – Flanders (FWO) (Krediet aan Navorsers 1.5.242.13N).
Financial disclosure of reviewers: None reported.