
Abstract
[68Ga]Annexin A5 positron emission tomography (PET) reveals the externalization of phosphatidylserine as a surrogate marker for apoptosis. We tested this technique for therapy monitoring in a murine model of myocardial infarction (MI) including parathyroid hormone (PTH) treatment. MI was induced in mice, and they were assigned to the saline or the PTH group. On day 2, they received [68Ga]annexin A5 PET or histofluorescence TUNEL staining. Mice had 2-deoxy-2-[18F]fluoro-D-glucose (FDG)-PET examinations on days 6 and 30 for calculation of the left ventricular ejection fraction and infarct area. [68Ga]Annexin A5 uptake was 7.4 ± 1.3 %ID/g within the infarction for the controls and 4.5 ± 1.9 %ID/g for the PTH group (p = .013). TUNEL staining revealed significantly more apoptotic cells in the infarct area on day 2 in the controls (64 ± 9%) compared to the treatment group (52 ± 4%; p = .045). FDG-PET revealed a significant decrease in infarct size in the treatment group and an increase in the controls. Examinations of left ventricular ejection fraction on days 6 and 30 did not reveal treatment effects. [68Ga]Annexin A5 PET can detect the effects of PTH treatment as a marker of apoptosis 2 days after MI; ex vivo examination confirmed significant rescue of myocardiocytes. FDG-PET showed a small but significant reduction in infarct size but no functional improvement.
ANIMAL STUDIES have suggested that parathyroid hormone (PTH) treatment after myocardial infarction (MI) shows beneficial effects on infarct size, left ventricular function, and cardiac remodeling and in general attenuates the progression of ischemic cardiomyopathy.1,2 Several mechanisms potentially mediating these effects of PTH have been proposed. First, PTH is known to induce arterial vasodilation by means of a receptor activation evoking intracellular cyclic adenosine monophosphate (cAMP) production.1,2 This pathway plausibly exerts beneficial effects on the perfusion of ischemically afflicted myocardium. Second, PTH induces the mobilization of progenitor cells from the bone marrow into the peripheral blood. 3 Third, PTH increases plasma levels of cardiac stromal cell–derived factor 1 (SDF-1), a chemokine facilitating the homing of stem cells into the ischemic heart by activation of chemokine receptor type 4 (CXCR4) (SDF-1/CXCR4 axis). 4 These effects lead to increased myocardial perfusion, neovascularization, and enhanced cell survival and regeneration, ultimately resulting in less apoptosis and cardiac remodeling and improved postinfarct cardiac function. 1
Serial examinations by positron emission tomography (PET) enable serial in vivo molecular imaging of myocardial survival and viability in small-animal infarct models. PET with the glucose analogue 2-deoxy-2-[18F]fluoro-D-glucose (FDG-PET) gives quantitative information about the viability and the function of damaged myocardium in vivo. 5 Furthermore, we recently reported that PET with [68Ga]annexin A5 serves to visualize and quantify phosphatidylserine externalization in the area at risk after myocardial ischemia 6 ; the binding of [68Ga]annexin A5 to externalized phospholipids is considered a surrogate marker for myocardial apoptosis.
Based on our earlier findings with FDG and annexin PET, we hypothesized that the myocardial viability and externalization of phosphatidylserine on day 2 after MI correlate with the long-term outcome.
Methods
Animal Model of Coronary Occlusion and PTH Treatment
Experimental protocols were approved by the regional governmental commission of animal protection (Regierung von Oberbayern, Germany) and were performed in accordance with the Guide for the Care and Use of Laboratory Animals published by the US National Institutes of Health. 7
Male C57B16/N mice were used in this study. For the operation, mice were anesthetized with ketamine 70 mg/kg body weight and xylazine 15 mg/kg body weight. For imaging, mice were anesthetized with 1.5% isoflurane delivered in 1.2 liters O2/min by means of mechanical ventilation. The body temperature was continuously monitored with a rectal probe and maintained at an appropriate level with a heating lamp. On induction of deep anesthesia, the heart was exposed by left lateral thoracotomy as described previously by our group. 6 Using a small needle, a suture (8-0 polypropylene) was placed about the proximal portion of the left anterior descending (LAD) artery, which was then ligated. The occlusion of the vessel induced an MI, which was visually verified by the paling of the tissue. After completion of the surgical procedure, the animals were returned to their cages and left to recover.
Administration of PTH
The infarcted C57B16/N mice were randomly assigned to the treatment or the control group. The treatment group received PTH (80 mg/kg/day) as an intraperitoneal injection over 6 consecutive days. The PTH treatment was initiated immediately after the infarction. The control group received saline solution (0.9% NaCl) over 6 consecutive days in the same manner as the treatment group. This approach was previously described by Brunner and colleagues. 2
In Vivo PET Imaging
[68Ga]Annexin A5 PET scanning was performed on day 2 after MI using a dedicated small-animal PET scanner (Inveon Dedicated PET, Preclinical Solutions, Siemens Healthcare Molecular Imaging, Knoxville, TN) (n = 5 in the treatment group, n = 7 in the control group). For labeling annexin A5 with [68Ga], a kit-like labeling technique was applied, yielding a specific activity of 20 to 45 GBq/mol, as described previously.6,8 After induction of anesthesia with 1.5% isoflurane, mice received an intravenous catheter into a tail vein. Subsequently, 15 MBq [68Ga]annexin A5 was injected in a volume of 150 μL, and the catheter was flushed with 50 μL saline solution. Animals were placed in the aperture of the tomograph, and a list-mode acquisition was obtained in three-dimensional (3D) mode 60 to 90 minutes after tracer injection. Emission recordings were followed by a transmission scan with an external [57Co] point source for scatter and attenuation correction. Animals were then taken back to their cages to recover.
On days 6 and 30 after MI, animals were anesthetized and catheterized as above; 20 MBq of FDG was injected into a tail vein in a volume of 150 μL (n = 13 in the treatment group, n = 10 in the control group), and the catheter was flushed with 50 μL saline solution. Animals were placed in the aperture of the tomograph, and a listmode acquisition was obtained in 3D mode 30 to 45 minutes after FDG injection, followed by an attenuation scan as above. At the end of the last scan, the animals were sacrificed by cervical dislocation while still under anesthesia without regaining consciousness.
All PET data were processed with an Inveon Acquisition Workplace (Siemens Medical Solutions, Knoxville, TN). The [68Ga]annexin A5 scan was statically framed and iteratively reconstructed using ordered subset expectation maximization (OSEM) 3D (four iterations) and maximum a posteriori (MAP) (32 iterations) image reconstruction algorithms. The final images consisted of a 256 × 256 matrix (159 slices, thickness of 0.796 mm, resulting in a voxel size of 0.15 mL) with a zoom factor of 100% and a β of 0.15, as previously established by our group. 6 The FDG data were statically framed and likewise reconstructed with the OSEM 3D (4 iterations) and fastMAP (32 iterations) image reconstruction algorithms. The electrocardiogram (ECG)-gated FDG data were divided into 16 equal intervals and iteratively reconstructed using OSEM 3D (four iterations) and MAP (32 iterations), as previously described by our group. 9 All PET data were normalized and corrected for randoms, dead time and decay, and attenuation (Figure 1). Right after the PET scan, the accuracy of the ECG trigger signals in the listmode data were verified using in-house software programmed in MATLAB (The Mathworks, Natick, MA) and in C programming language, and erroneous trigger events were removed as previously described. 10

Schematic illustration of the study protocol. Animals of the parathyroid hormone treatment group and animals of the control group were imaged according to the protocol. LAD = left anterior descending artery.
PET Image Analysis
PET images were analyzed using an Inveon Research Workplace (Siemens Medical Solutions). For the correct allocation of the annexin A5 uptake to the area of infarction and to the healthy myocardium, the day 6 FDG scan was applied as a metabolic and anatomic landmark. An automated volumetric software fusion algorithm was used to ensure the greatest approximation between the annexin and the FDG-PET scan. The results were verified visually, and the remaining incongruities were eliminated manually. [68Ga]Annexin A5 images were then analyzed by drawing standard volumes of interest (VOI) with a size of 1.3 μL around the region of peak tracer uptake within the area of infarction (LAD artery perfusion territory) and within the healthy myocardium as a control reference. We were careful to avoid spill-over activity from the adjacent liver. The correct VOI placement was verified in axial, coronal, and sagittal projections. The mean radioactivity concentration was quantified as the percentage of the injected dose per gram (%ID/g), as previously described. 6 Polar maps of the annexin uptake were calculated with Munich Heart (Stefan Nekolla, Technical University of Munich, Munich, Germany).
FDG images were analyzed using QPS 2012 and QGS 2012 software packages (Research Edition, PET Processing plugin, Cedars-Sinai, Los Angeles, CA). For the calculation of the infarct size, polar maps of the left ventricular FDG uptake were created using QPS 2012. The polar maps were then compared to a normative database consisting of gender- and age-matched animals. In brief, by calculating the extent of impaired glucose metabolism and the severity of impaired glucose metabolism, expressed in units of standard deviations from the normative data, the infarct size was calculated as the percentage of the left ventricular surface area. This approach is based on the method used by Slomka and colleagues for perfusion data. 11 In addition, ECG-gated FDG images were exported as DICOM files and loaded into QGS 2012. An automated wall recognition algorithm was applied to delineate left ventricular contours, and the left ventricular ejection fraction (LVEF) was calculated as described by Brunner and colleagues. 9
The voxel size of the FDG images analyzed with QPS 2012 and QGS 2012 software packages had to be magnified by a factor of 10, as required for compatibility of small-animal PET data with software designed for humans, as previously described.12,13
Histologic Fluorescein Staining
A separate group of mice was sacrificed on day 2 after LAD artery occlusion for histologic correlation of apoptosis and [68Ga]annexin A5 uptake ex vivo (n = 5 in the treatment group, n = 5 in the control group). Cervical dislocation was performed to sacrifice the mice; prior to this, they were anesthetized with ketamine 70 mg/kg body weight and xylazine 15 mg/kg body weight. Hearts were excised, rinsed with cold physiologic saline solution, and fixed by immersion in formaldehyde (3.7%) at 4°C for a period of 24 hours. The hearts were then embedded in paraffin and cut into 4 mm thick tissue sections, which were then mounted on glass slides and deparaffinized. 6
We employed terminal deoxynucleotidyl transferase dUTP nick end labeling (TUNEL; In Situ Cell Death Detection Kit, Roche Diagnostics GmbH, Mannheim. Germany) to detect apoptosis. For counterstaining, we used VECTASHIELD Mounting Medium with 4′,6-diamidin-2-phenylindol (DAPI). We then examined the slides with fluorescence microscopy (40×) at 515 to 565 nm for counting apoptotic cells and 450 to 500 nm for counting all counterstained cells in the field of view (FOV) as previously described. 6 Cell numbers were counted in five FOV within the infarction. The apoptosis ratio was calculated as the number of apoptotic cells divided by the total number of cells in each FOV.
Statistical Analysis
All continuous variables were expressed as mean ± standard deviation. The Kolmogorov-Smirnov test was used to test the variables for normal distribution. The Levene test was used to test for the equality of variances in different samples. Paired and unpaired Student t-tests were used where appropriate. Regression analysis and Pearson r were used to test for correlations between normally distributed variables. A p value ≤ .05 was considered statistically significant.
Results
In Vivo Quantification of [68Ga]Annexin A5 Uptake
The mean [68Ga]annexin A5 uptake by PET was 7.4 ± 1.3 %ID/g within the area at risk for the control group and 4.5 ± 1.9 %ID/g for the PTH group (p = .013). In healthy myocardium, [68Ga]annexin A5 uptake did not differ significantly between the control and treatment groups (3.6 ± 1.7 versus 3.4 ± 1.8 %ID/g; p = .849). Compared to the healthy myocardium, the treatment group did not show significantly different tracer uptake in the area at risk (p = .375), whereas the control group showed elevated tracer uptake in the area at risk compared to the healthy myocardium (p < .001) (Figure 2 and Figure 3).

In vivo quantification of [68Ga]annexin A5 uptake on day 2 after myocardial infarction (MI). *Significantly higher [68Ga]annexin A5 uptake was detected in the NaCl control group compared to the parathyroid hormone (PTH) treatment group within the MI (p = .013) and compared to the NaCl control group in the healthy myocardium (p < .001) and the PTH treatment group in the healthy myocardium (p = .002). **[68Ga]Annexin A5 uptake in the PTH treatment group within the MI did not differ significantly from annexin uptake in the NaCl control group and the PTH treatment group within the healthy myocardium (p = .41 and p = .375, respectively).
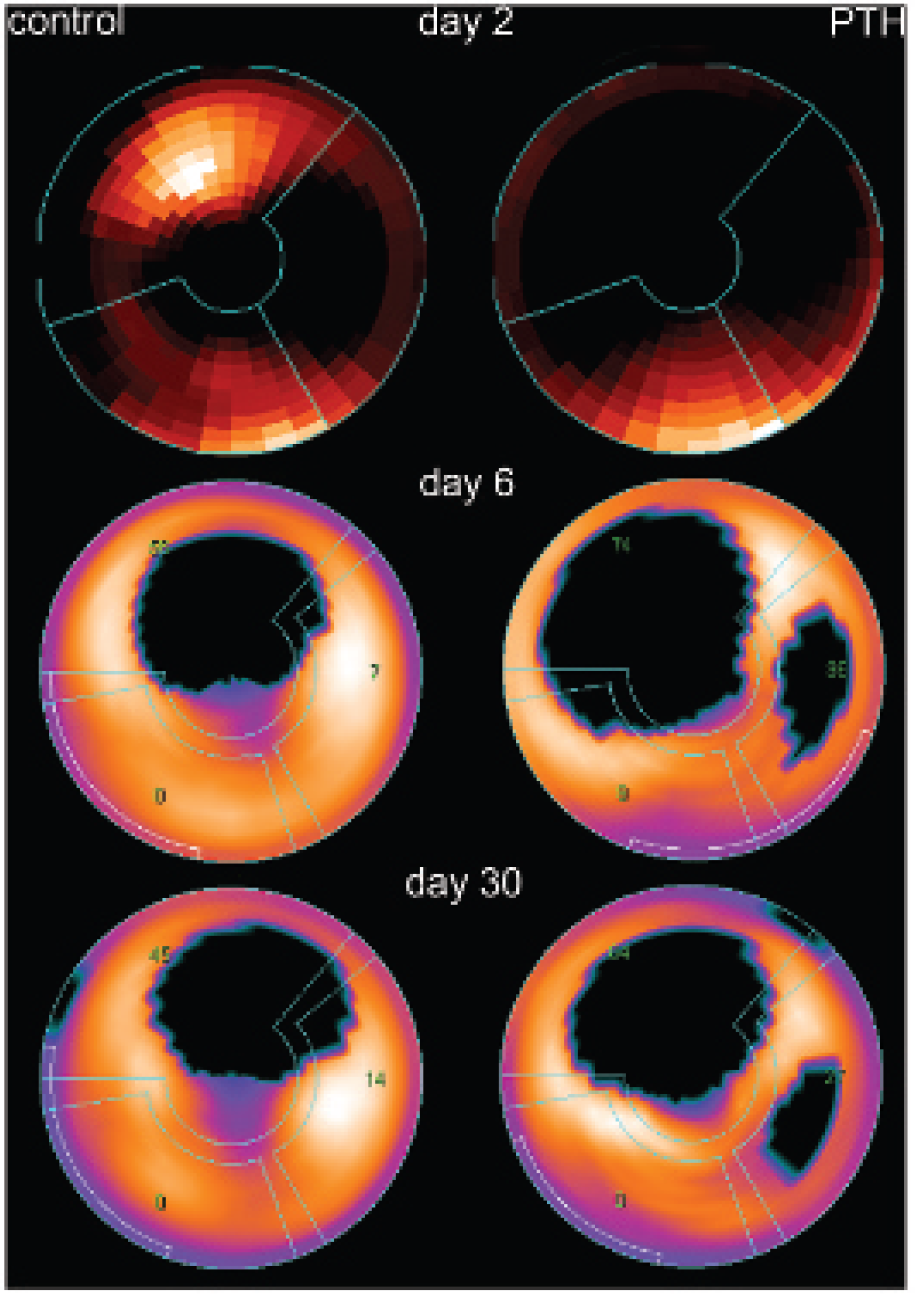
Annexin uptake and infarct size. Polar map examples of annexin uptake on day 2 (upper row) and infarct sizes (FDG-PET) on days 6 (middle row) and 30 (bottom row) after myocardial infarction from the control group and the parathyroid hormone (PTH) treatment group. In the control group example, there is maximum annexin uptake in the anterior wall, corresponding well to the location of the infarction (as revealed by FDG-PET on days 6 and 30), whereas there is no discernible annexin uptake in the PTH group example (residual annexin uptake was 1.3%ID/g in this animal). Spill-in from the liver activity is visible in the inferior wall in both polar plots. With regard to infarct size, there are no apparent changes in the control group from day 6 to day 30, whereas there is a slight decrease in the treatment group. The grid in all polar maps represents the vascular territories (clockwise starting from above: left descending artery, circumflex artery, and right coronary artery). The green numbers represent the amount of infarction within the vascular territory. Slight changes may be due to differences in the rotation of the heart. The polar maps are normalized to the maximum tracer uptake within the map. Thus, especially in the annexin maps, residual tracer uptake in the healthy myocardium or in the area of infarction after PTH treatment might not be visible. However, it was discernible by region of interest quantification.
Histologic Fluorescein Staining
Histologic fluorescein staining in the PTH treatment group revealed significantly fewer apoptotic cells in the area at risk on day 2 after infarction compared to the control group (52 ± 4% vs 64 ± 9%; p = .045) (Figure 4).

Percentage of apoptotic cells on day 2 after myocardial infarction (MI) in TUNEL assay. On day 2 after MI, the TUNEL assay showed significantly fewer apoptotic cells in the parathyroid hormone (PTH) treatment group compared to the NaCl control group (p = .045).
Size of Infarction and Left Ventricular Function
On day 6 after MI, both groups showed comparable infarct sizes (26 ± 11% in the control group vs 32 ± 15% in the PTH treatment group, p = .286). On day 30, the infarct size increased to 27 ± 12% (p = .105 vs day 6) in the control group, whereas the infarct size decreased significantly in the treatment group to 29 ± 13% (p = .031 vs day 6). The change in the infarct sizes from day 6 to day 30 differed significantly between groups (1 ± 2% in the control group versus –3 ± 4% in the treatment group, p < .010) (see Figure 3 and Figure 5).

Change in the infarct size between days 6 and 30. FDG-PET measurements of the infarct size increased by 1% between days 6 and 30 in the NaCl control group, whereas it decreased by 3% in the parathyroid hormone (PTH) control group; the difference reached statistical significance (p = .01).
Calculated as a marker for left ventricular function, the LVEF was 47 ± 15% on day 6 and 50 ± 12% on day 30 after MI in the control group and 46 ± 13% on day 6 and 47 ± 13% on day 30 in the PTH treatment group. The mean LVEFs within and between groups did not differ significantly (p > .05).
Infarct size and LVEF showed a significant negative correlation on days 6 and 30 in the control group (R = –.75, p = .012 and R = –.64, p = .046) as well as in the treatment group (R = –.84, p < 0.001 and R = –.87, p < .001). However, there was no significant correlation between the change in the infarct size and the change in the LVEF from day 6 to day 30 in both groups (control group: p = .239, treatment group: p = .820).
Discussion
In the present study, we found that treatment with PTH significantly reduced apoptosis within the area at risk at 1 days after MI. This protection was evident to [68Ga]annexin A5 PET, which showed an almost 40% reduction in tracer uptake within the area at risk for the PTH group compared to saline-treated controls. This PET finding was confirmed ex vivo after excision and histologic examination of the hearts; tissue from PTH-treated animals showed a significantly lower rate of apoptosis in the TUNEL assay compared to controls. Although we detected a slight but not significant increase in the infarct size in the control group, the treatment group showed a significant decrease in infarct size. The comparison of the deltas (+1% infarct size in the control group vs –3% infarct size in the treatment group) likewise reached statistical significance. The salvage of this amount of myocardium was, however, without effect on recovery of LVEF, as measured by FDG-PET.
[68Ga]Annexin A5 Tracer Uptake on Day 2
Zaruba and colleagues showed in 2008 that PTH treatment in a murine model of MI significantly rescued the apoptosis rate as detected by the TUNEL assay (36% in controls versus 19% in the treatment group). 1 We likewise found a significant reduction in the abundance of apoptotic cells in the PTH treatment group (64% versus 52%). The higher numbers of apoptotic cells could reflect our use of fluorescence TUNEL staining rather than the less sensitive peroxidase staining in the Zaruba and colleagues study. Furthermore, the treatment led to a reduction in apoptotic cells of 12% in our study, whereas Zaruba and colleagues detected a slightly higher reduction of 17%. 1 In contrast, our histologic examination was confirmed by [68Ga]annexin A5 PET, which we earlier established to measure phosphatidylserine externalization by apoptotic and also necrotic cells within an area of infarction.6,14 In good correlation with our own findings from the TUNEL assay at day 2 after infarction, [68Ga]annexin A5 uptake was significantly lower in the PTH-treated group, indicating reduced cell death.
The reduction in apoptosis was less pronounced using the TUNEL assay for detection compared to annexin PET. We assume that the lesser reduction observed with fluorescein staining might be due to two reasons. First, the method of detecting apoptotic cells is different in both approaches. TUNEL staining uses the detection of certain DNA fragments that occur during apoptosis, whereas annexin A5 binds to phosphatidylserine, which is externalized to the cell surface during apoptosis.6,15 There is a chance that PTH has slightly different effects on the occurrence of these DNA fragments and the externalization of phosphatidylserine, with regard to both the amount of up- and downregulation and the temporal changes. This might ultimately lead to different detection rates. Different detection rates of annexin PET and TUNEL staining were also observed in a previous article by our group. 6 Second, TUNEL staining might also be more sensitive than annexin PET because single apoptotic cells can be detected by TUNEL staining, whereas annexin PET indirectly measures the amount of apoptotic cells by uptake values. This might also explain the lesser reduction in apoptosis as observed by TUNEL staining simply because more apoptotic cells can be detected. Nevertheless, both methods show good agreement with regard to the effect of PTH.
Thus, we confirm Zaruba and colleagues' demonstration of cardioprotective therapy monitoring and can predict that [68Ga]annexin A5 PET should serve for longitudinal therapy monitoring in individual animals, as has been proposed.16–18 Since we were able to detect therapy effects even at an early point in time, PET might also prove useful for risk stratification. Thus, small-animal PET with [68Ga]annexin emerges as a sensitive assay for detection of changes in phosphatidylserine externalization, a surrogate marker for apoptosis at day 2 after MI.
Infarct Size and LVEF
Several studies showed that PTH treatment after MI had beneficial effects on the course of ischemic cardiomyopathy.1,2,19 So-treated animals have had smaller infarct sizes, improved LVEF, and generally better survival rates.1,2,19 Our study agrees with the aforementioned studies insofar as the infarct sizes increased slightly from day 6 to day 30 in the control group while decreasing in the treatment group (day 6 after MI compared to day 30). The statistically not significant difference in the infarct size at the baseline scan on day 6 (26% in the control group, 32% in the treatment group) might be due to either PTH treatment or variations in the occlusion model. Given that other studies did not reveal any difference in infarct size at the baseline (as measured by histology or perfusion scintigraphy) in control and PTH treatment groups,1,19 we do not have any evidence that PTH might cause such a difference. Thus, we surmise that the difference measured in our study is most likely due to variations in the LAD artery occlusion mouse model even though the operations were carried out by the same experienced microsurgeon under identical conditions.
Although the stated decrease in infarct size in the PTH group might be partially based on the initially more extended areas of infarction, we want to raise two points that might amend for this. First, infarct sizes were very extensive in both groups, comprising between a fourth and a third of the whole left ventricular myocardium. Due to these sizes, one might speculate that a (statistically not significant) difference should not affect the outcome as much as would be the case with smaller infarct sizes. Second, more meaningful than the within-group comparisons of matched pairs should be the between-group comparison of deltas because these are irrespective of the absolute baseline and follow-up infarct sizes. The decrease in the infarct size in the treatment group and the increase in the infarct size in the control group are in accordance with what would be expected of PTH treatment. 2
The reduction in the infarct size with PTH treatment (which reached statistical significance in both the within-group comparison from day 6 to day 30 in the treatment group and the comparison of deltas between the control and treatment groups) might reflect improved cell survival, decreased cell loss through the recruitment of bone marrow progenitor cells, and increased homing of these cells to infarcted myocardium, as has been proposed by Brunner and colleagues.2,3
Our infarct size results are in good agreement with the study by Huber and colleagues in 2010, who used myocardial perfusion single-photon emission computed tomography (SPECT) to analyze perfusion defects in a murine model of MI in a control group and in three treatment groups (PTH, granulocyte colony-stimulating factor [G-CSF], and PTH + G-CSF). 19 Although the perfusion defects increased by approximately 1% between days 6 and 30 in the control group, they decreased by up to 3% in the treatment groups. In contrast, Zaruba and colleagues detected a far greater (14%) rescue of infarct size in a similar model of murine infarction and PTH treatment. 1 This could be explained in part by the differing methods of calculating infarct sizes. Whereas we delineated infarcts on an ECG-gated FDG-PET scan relative to a normative database, which is the standard in clinical settings, 20 Zaruba and colleagues and Deindl and colleagues used histologic staining for the calculation of infarct sizes.1,21 For example, myocytes can show residual FDG uptake in the regions of a PET scan, which might be judged to be infarcted by histologic analysis. However, this seems inadequate to account for the full extent of the disagreement, that is, a 3% decrease in our study and a 14% decrease in the Zaruba and colleagues study. Additional relevant factors may include the metabolic state at the time of scanning or stress through repeated measurements as well as partial volume effects.
We expected that PTH might rescue cardiac function, but the LVEF remained virtually unchanged between days 4 and 30, irrespective of treatment. As expected, infarct sizes and LVEF showed a negative correlation on days 6 and 30 in both groups. However, the reduction in the infarct size did not lead to improved left ventricular function. This seems more consistent with the small changes in infarct volume but less consistent with the apoptosis findings. Zaruba and colleagues and Brunner and colleagues both found significantly higher LVEF on day 6 in the therapy group compared to the control group but no further effect of PTH between days 6 and 30.1,2 Nevertheless, LVEF in the therapy group was significantly higher during the course of the studies. Just as with infarct sizes, the effects of PTH on LVEF might depend on various physiologic and environmental factors. Interestingly, above-normal PTH levels have been associated clinically with heart failure among older people and impart a higher risk of cardiac events in people with stable coronary heart disease.22,23 Even though there is convincing evidence that PTH supplementation can enhance stem cell homing, neovascularization, and attenuation of ischemic heart failure, it may also interfere under some circumstances and aggravate heart failure. This might partly be reflected in our study, where despite clearly increased cell survival, the effects on infarct size and left ventricular function were not as resounding as might have been expected.
Limitations
The study has several limitations that need to be addressed.
First, annexin A5 shows a high liver uptake. Given that the liver is adjacent to the heart, especially to the inferior wall, this could seriously hamper uptake measurements made with this tracer. Because our main focus was on the LAD artery perfusion territory (mostly the anterior wall), this did not present a major problem; however, it needs to be taken into consideration for future clinical applications, which might necessitate measurements in the inferior wall.
Second, the infarct sizes in the control and treatment groups showed a nonsignificant difference at the baseline scan. As discussed above, we are of the opinion that this is mostly due to variations in the LAD artery occlusion model. Although we do not think that the conclusion of this study has been thereby hampered, it still clearly shows the limitations of this small-animal model.
Third, when analyzing the annexin uptake by placing standardized VOI into the peak of tracer uptake, the occurrence of partial volume effects cannot be excluded. However, due to our standardized approach, we expect them to introduce a systematic error, if any at all.
Conclusion
We made the first demonstration of therapy monitoring with [68Ga]annexin PET in a small-animal model of MI. Treatment with PTH significantly attenuated cell death on day 2. Despite slight differences at the baseline scan, the controls showed an increase in infarct size, whereas the treatment group showed a decrease over the course of the study. These differences were significant.
However, there was no beneficial effect on the functional parameter LVEF. Our results partly confirm the cardioprotective effects of PTH treatment described in preceding animal studies but also draw attention to the ambiguous role of PTH in cardiovascular disease, as described in clinical settings. Further studies may better elucidate the role of PTH in the treatment of heart disease and heart failure and the associated molecular pathways, leading to positive and negative effects.
Footnotes
Acknowledgments
Financial disclosure of authors: We thank Else Kröner-Fresenius-Stiftung for financial support of the study.
Financial disclosure of reviewers: None reported.