
Abstract
Positron emission tomography (PET) is an imaging technology that can detect and characterize tumors based on their molecular and biochemical properties, such as altered glucose, nucleoside, or amino acid metabolism. PET plays a significant role in the diagnosis, prognostication, and treatment of various cancers, including brain tumors. In this article, we compare uptake mechanisms and the clinical performance of the amino acid PET radiotracers (L-[methyl-11C]methionine [MET], 18F-fluoroethyl-tyrosine [FET], 18F-fluoro-L- dihydroxy-phenylalanine [FDOPA], and 11C-alpha-methyl-L-tryptophan [AMT]) most commonly used for brain tumor imaging. First, we discuss and compare the mechanisms of tumoral transport and accumulation, the basis of differential performance of these radioligands in clinical studies. Then we summarize studies that provided direct comparisons among these amino acid tracers and to clinically used 2-deoxy-2[18F]fluoro-D-glucose [FDG] PET imaging. We also discuss how tracer kinetic analysis can enhance the clinical information obtained from amino acid PET images. We discuss both similarities and differences in potential clinical value for each radioligand. This comparative review can guide which radiotracer to favor in future clinical trials aimed at defining the role of these molecular imaging modalities in the clinical management of brain tumor patients.
IN NEURO-ONCOLOGY PRACTICE, imaging techniques play an important role in clinical management. Magnetic resonance imaging (MRI) is widely available and cost-effective and remains the mainstay for the initial clinical diagnosis, treatment planning, and posttreatment follow-up of brain tumors. 1 However, the pitfalls of MRI warrant incorporation of other imaging methods for evaluation of brain tumors. For example, MRI contrast enhancement, a common sign of high-grade tumors, is facilitated by blood-brain barrier disruption, which can be associated with surgery and/or radiation-induced inflammation, thus contributing to nonspecific findings on MRI. 2 Conventional MRI, such as T1- and T2-weighted images, also have a limited value in differentiating posttreatment progression of brain tumors from similar therapy-related changes. 3 Newer treatment modalities, such as antiangiogenesis therapy, also impair the use of classic MRI-based criteria of treatment response. 4 Advanced imaging techniques such as perfusion-weighted MRI, proton magnetic resonance spectroscopy (1H-MRS), and positron emission tomography (PET) can provide quantitative assessment of functional and metabolic changes of the tumor tissue. Perfusion MRI measures regional cerebral blood volume, which is generally higher in recurrent high-grade gliomas than in areas with radiation injury.5,6 Low blood flow in low-grade gliomas and inaccurate estimation of perfusion due to contrast leakage through the blood-tumor barrier are among the limitations of this technique. 1H-MRS is capable of characterizing the metabolic properties of a tumor and is increasingly used to identify recurrent gliomas. However, this technique cannot provide true three-dimensional lesion coverage and currently has a limited value in detecting small tumors or evaluating lesions adjacent to scalp, ventricles, calcified structures, or hemorrhage. 6
PET plays a significant clinical role in the diagnosis, prognosis, and treatment of various cancers, including both primary and metastatic brain tumors.7–9 Current PET techniques predominantly detect tumors based on their altered energy metabolism, amino acid metabolism, and nucleic acid metabolism. In the early 1980s, imaging of brain tumors, using 2-deoxy-2[18F]fluoro-D-glucose (FDG), along with 11C-labeled amino acid and nitrosourea analogues, was the first oncologic application of PET.10–13 FDG-PET has evolved over the past three decades into a key clinical PET modality in detecting both intra- and extracranial tumors. Increased FDG uptake is common in highly proliferating cells because the tumor cells have increased expression of glucose transporters and hexokinase, the enzyme that converts glucose (and FDG) to a phosphorylated product. 14 FDG uptake is proportional to glucose uptake but not quantitatively equal to glucose metabolism. In neuro-oncology, the primary goal of FDG-PET is differentiation of malignant from benign lesions and distinguishing recurrent tumors from radiation necrosis. The main advantages of FDG include its relatively long half-life (110 minutes, allowing transport to nearby sites from a central cyclotron) and its streamlined radiosynthesis. However, FDG uptake has also been reported in inflammatory cells, 15 and the high baseline of glucose metabolism in the cerebral gray matter can diminish the contrast between malignant tumors and surrounding normal brain tissue. Also, this technique is not sensitive for detecting low-grade gliomas, shows limited specificity in identifying recurrent tumors, and has limitations in determining the prognosis of brain tumors. Assessment of therapeutic response also remains challenging with FDG- PET. Therefore, clinical applications of other types of PET imaging tracers, such as the use of radiolabeled amino acids, have been considered for tumor imaging since the late 1970s.16,17 Since then, a number of radiotracers have been tested, and their performance has been increasingly compared to that of other imaging modalities for the assessment of brain tumors. 18
The two most widely used amino acid PET radiotracers in human brain tumor imaging include L-[methyl-11C] methionine (MET) and 18F-fluoroethyl-tyrosine (FET). MET is an essential amino acid labeled with a carbon-11 positron-emitting isotope, which has a half-life of 20 minutes and has been used since the 1980s in multiple centers worldwide.8,19 FET was developed in the late 1990s 20 , 21 to provide an 18F-labeled amino acid PET tracer, with a longer (110 minutes) half-life, which is more suitable for routine clinical applications. After a surge of published clinical studies in the last decade, applications of MET-PET and FET-PET in brain tumor imaging have been comprehensively reviewed in a number of recent articles.8,22–25 These reviews summarize data accumulated on the use of these two radiotracers in the differentiation and grading of newly diagnosed brain tumors and recurrent gliomas, as well as the use of these techniques in treatment planning (surgery and radiotherapy) and response monitoring.
Imaging centers interested in brain tumor imaging and with the capability to expand their PET radiotracer repertoire can face the challenge to decide which amino acid radiotracer is more suitable for their needs. To facilitate this process, the current review focuses on the comparison of the applications of the most commonly reported amino acid PET tracers to highlight both similarities and key differences in their clinical performance. In addition to MET and FET, we also include key findings of two other amino acid analogues, which were not developed to study tumors originally: 18F-fluoro-L- dihydroxy-phenylalanine (FDOPA), an 18F-labeled compound developed to measure dopamine synthesis (mostly used for basal ganglia imaging)26,27 but increasingly used in some centers for brain tumor imaging during the last decade,28–31 and 11C-alpha-methyl-L-tryptophan (AMT), a compound that was developed originally to measure brain serotonin synthesis,32–35 found success in detecting epileptic foci,36–39 and was recently employed for PET imaging of brain tumors due to its unique properties in tracer metabolism related to tumoral immunoresistance (discussed below). Previous reviews often ignored these latter two tracers (FDOPA and AMT), but emerging new data warrant the inclusion of them in a comparative review.
In this review, first, we outline and compare the key mechanisms driving tumoral uptake and trapping of each of the four amino acid PET radiotracers. This is followed by a summary of the clinical performance of these compounds, with special emphasis on their performance compared to clinical FDG-PET imaging and to each other (where studies with direct comparisons are available). We also highlight some of the particular features of each tracer that set them apart from the other radioligands and make them an attractive choice for specific clinical applications.
Differential Mechanisms Driving Tumoral Uptake of Amino Acid PET Radiotracers
In general, tumor tissue takes up amino acids in larger quantities than normal cells, and this is the basis of a superior sensitivity to detect viable tumor tissue by PET imaging of radiolabeled amino acids. 18 For brain tumor imaging, amino acid PET has a remarkable advantage over FDG-PET due to its high uptake in tumor cells compared to low uptake in normal brain cells. 40 After entering tumor cells, standard amino acids are mostly used for protein synthesis. Positron-labeled analogues of essential amino acids with identical chemical structure to nonlabeled counterparts (e.g., [1-11C]methionine, 11C-leucine, and 11C-tryptophan) have been tested for estimation of amino acid uptake and regional protein synthesis rates in living tissue.17,41–43 However, such tracers, especially standard methionine and tryptophan analogues, also produce a number of non–protein-bound metabolites; thus, only 11C-leucine appears to be suitable for measuring protein synthesis, and accurate estimation of protein synthesis rates can be difficult and cumbersome.43,44 Therefore, most amino acid radiotracers used for cancer imaging have been modified by adding methyl or ethyl groups to create derivatives that are less likely to be substrates for protein synthesis or other metabolic pathways. Cellular accumulation of these tracers is mainly driven by the activity of transport systems that carry these amino acids into the tissue. 41 Amino acid transport and protein synthesis rates are both enhanced in malignancies. 42
The four amino acid radiotracers discussed in this review (MET, FET, FDOPA, and AMT) share common transport mechanisms to enter the tumor tissue. Namely, system L amino acid transporters (such as LAT1, LAT2, LAT3, and LAT4) transport a variety of neutral amino acids. LAT1 is widely expressed in primary human cancers and cancer cell lines and plays an essential role in the survival and growth of tumors.45–47 LAT2 is predominantly expressed in other cell types and carries small neutral amino acids, 48 whereas LAT3 and LAT4 have a narrower substrate selectivity (preferring phenylalanine). 49 Other transport systems, including system A, xCT, glutamine, and cationic amino acid transporters, have been explored for tumor imaging with radiolabeled amino acids.50–52 Still, system L currently appears to be the most suitable for brain tumor imaging due to its activity at the blood-brain barrier. 53 A recent study demonstrated that radiolabeled amino acids with an α-methyl moiety (found in AMT, for example) may be more specific for tumor-derived LAT1 and, therefore, show more tumor-specific accumulation. 54 Transport inhibition experiments with specific competitive inhibitors demonstrated that FET uptake into cancer cells is caused mainly (> 80%) by the L-type transport system. 20 In one study, maximum standardized uptake value (SUV) of MET in gliomas also showed a positive correlation with LAT1 expression. 55 FDOPA is also transported primarily by LAT1 in tumors and is able to detect both enhancing and nonenhancing tumors. 56 LAT1 expression positively correlated with FDOPA-PET uptake in resected glioma samples. 56 High LAT1 expression was also reported in meningiomas and dysembryoplastic neuroepithelial tumors, two low-grade tumor types often showing high AMT uptake on PET.46,47 Altogether, these data demonstrate that the main transport mechanism of all four PET radiotracers involves LAT1. Therefore, ligand-specific differences in tumoral accumulation may be due to either their different affinities to this transporter (this has not been directly compared) or their different metabolic fate and trapping mechanism in the tumor tissue; this is further discussed below.
After transport to the tumor tissue from the bloodstream, different amino acid tracers have unique metabolic fates that can be exploited in tumor imaging. They might become trapped without any change, get partially incorporated in proteins, and/or become metabolized through various pathways. In addition, because system L is a reversible transport system, 57 tumoral efflux of nonmetabolized amino acids may also occur, thus leading to a gradual radiotracer washout on dynamic PET images. 58 For MET, the main metabolic pathway is protein incorporation, but the influence of other, minor pathways precludes the use of MET-PET for accurate estimation of tumoral protein synthesis. 42 Among others, methionine plays a role in transmethylation processes. 59 FET uptake primarily measures the amino acid transport rate because this radiotracer is neither incorporated into proteins nor metabolized after being transported to the cell. FET has lower uptake in inflammatory cells compared to FDG and MET and is more specific to differentiate tumoral tissue from inflammation than MET.60–62 A study of 22 non–contrast-enhancing gliomas (where the confounding effect of blood-brain barrier leakage was eliminated) found that high FET SUV in the tumor mass highly correlated with vascular and cellular density. 63 FDOPA accumulation is also mostly driven by transport, but this ligand is also the substrate of aromatic amino acid decarboxylase,64,65 and extensive FDOPA metabolism in tissue may be problematic for kinetic analyses on PET imaging. 26 Also, FDOPA shows high physiologic uptake in the basal ganglia, 27 which could interfere with tumors in these locations.
Among the four amino acid radiotracers discussed here, AMT has been introduced most recently, and its uptake mechanisms deserve a more detailed description. This radioligand was originally designed for PET imaging of brain serotonin synthesis because in neurons that generate serotonin from tryptophan, AMT is converted to α-methyl-serotonin and becomes trapped in serotoninergic terminals.32–35 Subsequently, increased AMT accumulation was described in epileptogenic lesions (e.g., in epileptic tubers 36 ), which was attributed to an increased conversion and trapping of AMT via the inflammatory kynurenine pathway, which can be activated in such lesions.36,66 The interest in AMT as a tumor radiotracer emerged shortly thereafter, boosted by the initial report demonstrating high tumoral expression of indoleamine 2,3-dioxygenase (IDO), the initial and rate-limiting enzyme of the kynurenine pathway, whose activity contributes to tumoral immunoresistance. 67 Due to its poor substrate specificity, IDO can convert not only tryptophan but also AMT to kynurenine metabolites. Thus, tumoral accumulation of AMT, detected by PET, may reflect IDO-derived conversion and trapping as a labeled kynurenine metabolite. Indeed, initial studies showed high AMT accumulation in a variety of brain tumors and various extracranial cancers (such as lung and breast cancers), which are known to express IDO.9,47,68,69 Preliminary studies also confirmed that such increases were associated with high expression of IDO in resected tumor tissue.9,47,70 Importantly, due to the presence of the methyl group, AMT is not incorporated into proteins; therefore, build-up of AMT in tissue is not directly affected by increased tumoral protein synthesis. 34 On the other hand, as mentioned above, AMT is transported via LAT1; therefore, kinetic analysis separating tracer transport and trapping has been critical to fully exploit AMT for clinical tumor imaging.
Altogether, the four amino acid radiotracers discussed in this review fall into three categories based on tumoral metabolism: (1) FET and FDOPA show little metabolism and can accumulate in the tumor tissue largely unchanged; (2) MET is mostly incorporated to protein but can also be metabolized via smaller pathways; and (3) AMT can be converted to and trapped in the form of α-[11C]-methyl-serotonin and/or α-[11C]-methyl-kynurenine, depending on the presence and activity of specific enzymes in tissue. These metabolic differences likely play a major role in differences in uptake and in vivo kinetics of these radiotracers in PET studies, which are discussed below.
Clinical Applications of MET-PET and FET-PET
Among the four radiotracers, MET-PET is the most widely studied in brain tumor imaging. According to a recent, comprehensive review of 45 studies, more than 1,700 glioma patients have been examined with MET-PET imaging, which was reported to help detect low-grade tumors, assist histologic grading, define the extent of tumor (Figure 1), identify optimal biopsy sites, plan radiotherapy, and aid in assessing prognosis. 8 In a systematic review of 13 FET-PET studies with a total of 462 patients with primary brain tumors, a pooled sensitivity of 82 and 84% and an average specificity of 76% and 62% were reported in the diagnosis of primary brain tumors and gliomas, respectively (Figure 2). 22 In the largest single-center study of 393 patients with a variety of brain lesions, increased FET uptake was found in 52% of 157 nonglial brain tumors and nonneoplastic lesions, limiting its specificity for identifying gliomas. 71 The total number of clinical FET-PET studies on brain tumor patients (pre- and posttreatment) has surged in recent years: approximately one half of about 60 published studies (based on PubMed data when searching for the key words “PET, tyrosine, glioma, and/or metastasis” and dated back to 2000) were published between 2010 and 2013. A limited number of studies compared the performance of these PET modalities to FDG-PET and to each other directly, as summarized below.
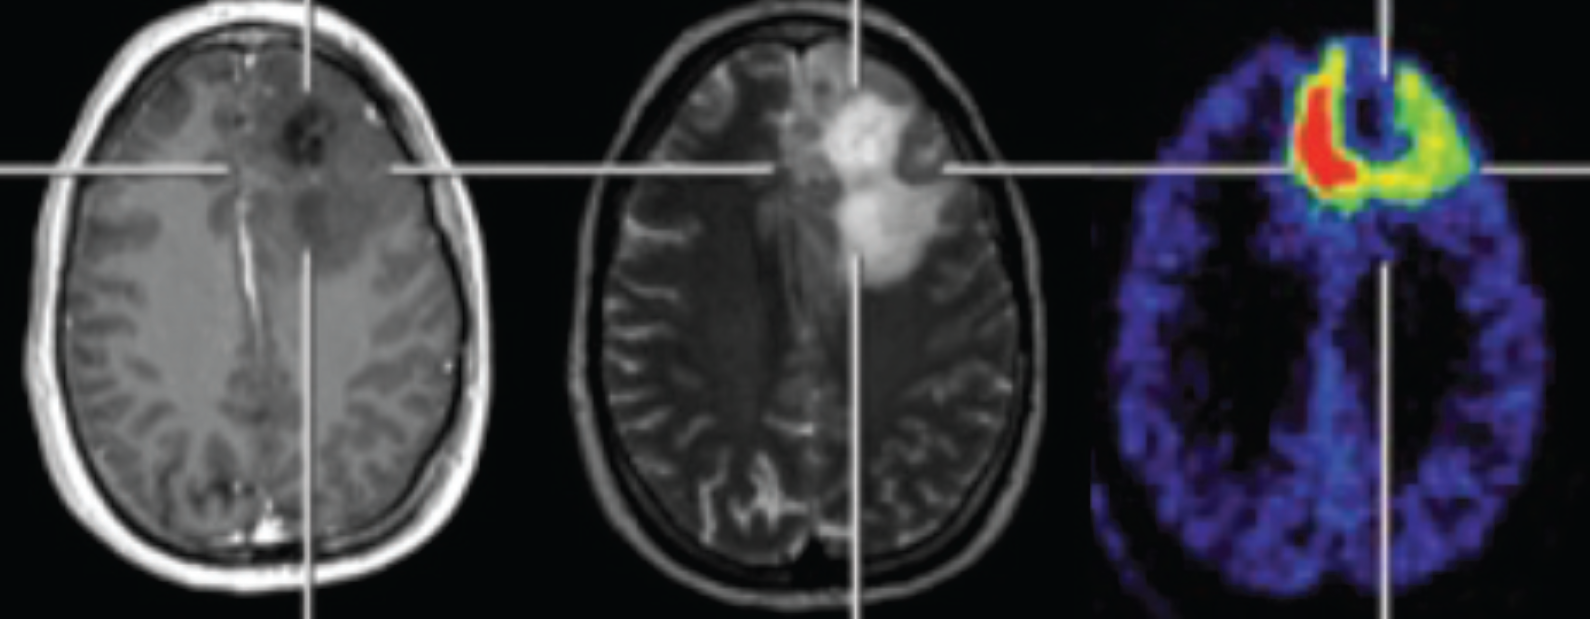
Coregistered T1-Gad (left), T2-weighted (middle), and MET-PET (right) images showing metabolically active tumor (glioblastoma) portions extending beyond the boundaries of the gadolinium-enhancing volume and partly extending beyond the high T2 signal. On the MET-PET image, blue/purple indicates low, whereas yellow to red indicates increased radiotracer uptake. Adapted from Galldiks N et al. 19
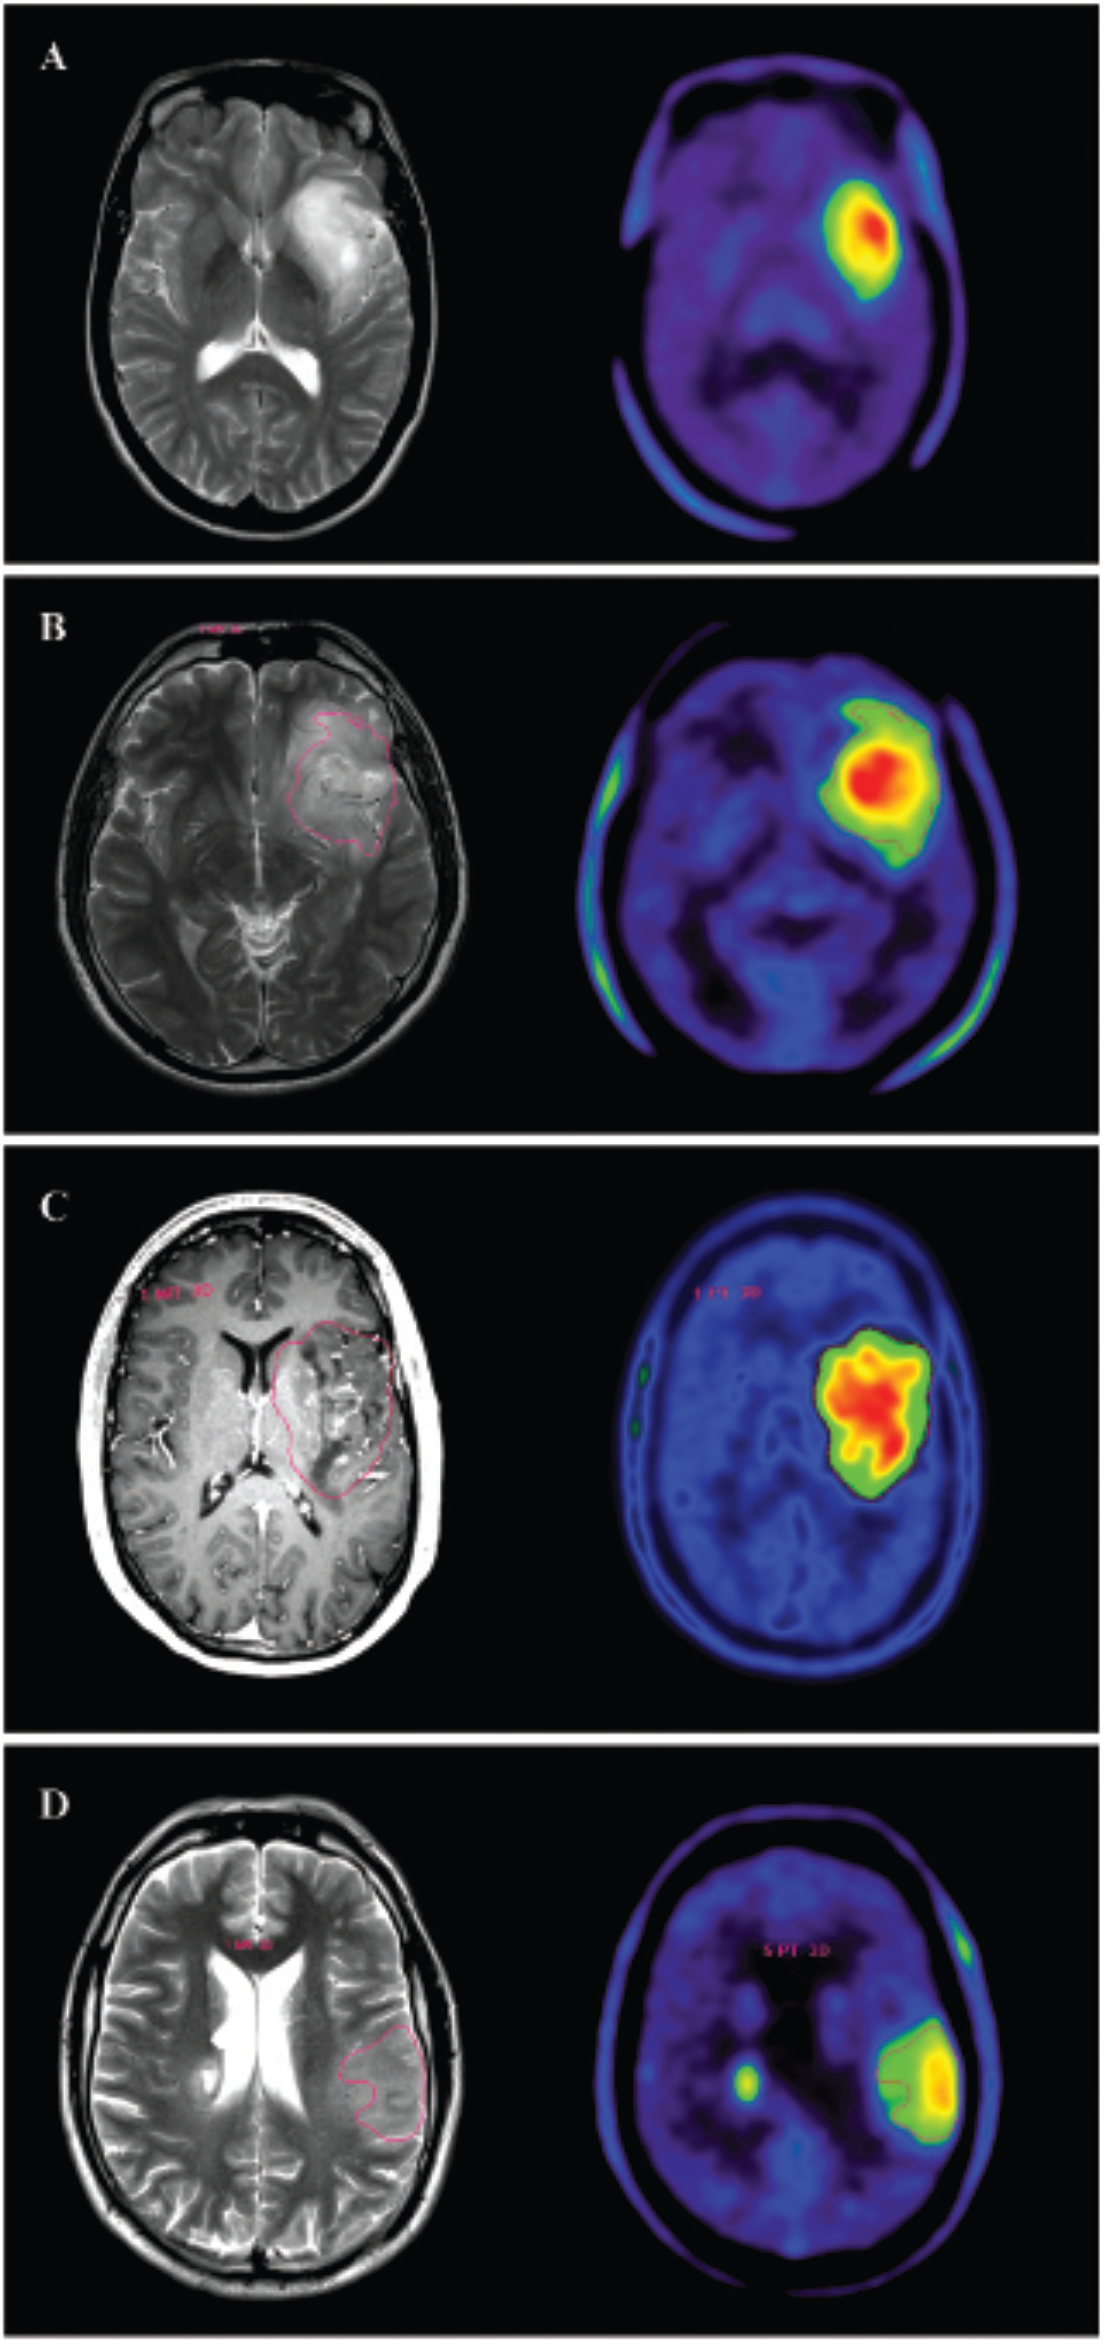
Coregistered magnetic resonance (left column, T2 weighted: A, B, D; T1-Gad: C) and FET-PET images (right column) of a newly diagnosed World Health Organization grade II astrocytoma (A), grade II oligodendroglioma (B), grade III anaplastic oligodendroglioma (C), and grade IV glioblastoma (D). On the FET-PET image, blue indicates low, whereas green to yellow to red indicates increasing radiotracer uptake. Note that both low- and high-grade gliomas show high FET uptake; tumor grades cannot be distinguished reliably based on static FET-PET images. Courtesy of Dr. Ian Law, Department of Clinical Physiology, Nuclear Medicine and PET, Rigshospitalet, Copenhagen University Hospital, Denmark.
Direct Comparison of MET with FDG-PET
In 17 studies directly comparing MET to FDG, MET was found to be superior to FDG in its clinical value, 8 although both of these tracers can accumulate not only in brain tumors but also in brain abscesses. 72 Increased uptake of FDG can be indicative of high-grade brain tumors, whereas low metabolic activity of FDG can be nonspecific, indicate low-grade glioma, or represent a posttreatment lesion. This hypometabolic region could be further analyzed with MET-PET to aid with a more specific diagnosis. In one study, increased MET uptake was noted in 35 patients with brain tumors that were hypo- or isometabolic on FDG-PET 73 ; this allows better delineation of gross tumor volumes and margins, especially in nonenhancing gliomas. The sensitivity of MET-PET was 89% in that study. In another study of 47 glioma patients, MET uptake was found to be an independent significant prognostic factor compared to FDG and MRI. 74 In their studies of patients with glioma who underwent PET-guided stereotactic biopsies, Pirotte and colleagues found that MET was superior to FDG in defining the target for tissue sampling due to its higher tumor specificity and because of its usefulness for target definition in tumors with low FDG uptake; thus, it was suggested that MET-PET could replace FDG in biopsy and resection planning.75,76 The same group also reported that MET-PET improved tumor volume definition over MRI in the majority (88%) of low-grade tumors during radiotherapy planning, 77 whereas FDG-PET would not be helpful in such cases.
Direct Comparison of FET with FDG-PET
Three studies provided a direct comparison of FDG and FET-PET results in the same patients. In a prospective pilot study of 21 suspected brain tumors, FET-PET was more accurate than FDG-PET for detecting malignant lesions, especially low-grade gliomas, with a sensitivity and a specificity of 93% and 100% (accuracy 96%), respectively, whereas FDG had a sensitivity of 27% and a specificity of 90% (accuracy 52%). 78 This study demonstrated a major advantage of FET in low-grade gliomas, which are often non–contrast enhancing. In another study of 15 patients with non-contrast-enhancing gliomas (11 newly diagnosed and 4 with suspected recurrence), the superiority of FET-PET over FDG-PET was demonstrated for biopsy planning by showing high FET uptake in all but one low-grade glioma. 79 In the largest direct comparative study of 52 patients with suspected cerebral gliomas, a local maximum uptake in the tumor area for biopsy guidance could be identified with FET in 76% and with FDG in 28% of the cases. 80 The lesion to background ratios showed significant differences between low- and high-grade tumors for both tracers but with considerable overlap, so reliable preoperative grading was not possible with either radiotracer. Accurate definition of tumor margins was often difficult or impossible on FDG-PET due to high uptake in the gray matter. Although a significant correlation of tracer uptake with overall survival was found with FDG only, the authors concluded that amino acid PET might be the preferred PET tracer for the clinical management of cerebral gliomas.
Direct Comparison of MET-PET and FET-PET
Two studies have reported direct comparisons between FET and MET uptake in PET imaging of brain tumors.81,82 In an initial study of 16 patients with a suspected primary or recurrent intracerebral tumor, 82 MET uptake was slightly higher than FET uptake, but there was a very close correlation between corresponding values (r = .98). Contrast between tumor and normal tissues was not significantly different between the two tracers; however, nonneoplastic lesions had significantly lower FET uptake than tumor tissue, suggesting better specificity for differential diagnosis. In a larger prospective study, MET and FET uptake was measured in patients with pretreated gliomas (n = 29) and brain metastases (n = 13) on the same day. 81 Again, a close correlation was found between MET and FET uptake in the lesions (r = .84), and the two modalities showed similar image contrast. Both radiotracers were able to delineate tumor tissue outside MRI changes and were able to differentiate tumor from treatment-related changes with high accuracy. Altogether, these two comparative studies demonstrated that MET-PET and FET-PET could provide quite similar diagnostic information.
FET-PET has the advantage over MET because of the longer half-life, which is more practical for routine clinical application. The simplicity of FET kinetics (tumoral transport and accumulation without significant metabolism) is also conducive to tracer kinetic analysis, which can provide useful additional clinical information. In a study of 55 patients with suspected World Health Organization (WHO) grade II gliomas who underwent FET-PET followed by stereotactic biopsy sampling of each tumor (a total of 373 biopsy samples), the authors found a strong correlation between uptake kinetics and histopathology findings. 83 Specifically, a homogeneous kinetic pattern throughout the tumor was linked to homogeneous histopathologic results. In contrast, heterogeneous uptake kinetics suggested high-grade portions in a low-grade tumor mass, covering 4 to 44% of the entire tumor volume. These findings demonstrated that FET uptake kinetics can identify anaplastic foci within a tumor mass, which has clear clinical value for both prognosis and surgical and radiation treatment planning. Using this approach, low- and high-grade recurrent gliomas using FET were differentiated with around 90% accuracy both before 84 and after 85 treatment. In a study of 31 patients with recurrent brain metastasis versus radiation necrosis, a 93% diagnostic accuracy was obtained when the tumor to brain ratio was > 1.9, with a time-activity curve pattern showing increased activity within 20 minutes after tracer injection followed by a decreased or stable uptake. 86 In contrast, a recent study found no additional prognostic information for dynamic FET-PET compared to tumor to brain ratios on static images during radiochemotherapy in patients with glioblastoma. 87 Thus, more work is needed to verify the clinical value of FET kinetic parameters in various clinical applications.
In addition to the above applications, a few recent studies have assessed the use of FET-PET imaging in the evaluation of treatment response and progression after rescue therapy of high-grade gliomas using the antiangiogenic drug bevacizumab. Although the number of patients was small, two groups demonstrated independently the potential of FET-PET (including standard and kinetic parameters) to detect tumor progression earlier than MRI in some cases.88–90 Another recent study also suggested that the addition of FET-PET to the diagnostic scheme may be cost-effective because it may help avoid overtreatment and related unnecessary side effects. 91 No similar data are available for comparison for MET-PET at this time.
Clinical Applications of FDOPA-PET
FDOPA-PET for brain tumor imaging was introduced in 1996 by Heiss and colleagues, who presented a patient with a movement disorder. 92 The scan revealed an unexpected increase in frontal FDOPA uptake, which was caused by a low-grade glioma. In the next decade, only a handful of reports were published on FDOPA brain tumor imaging.28,30,31 In the past 4 years, however, more than a dozen new studies explored the use of FDOPA for imaging newly diagnosed and previously treated brain tumors. A number of these studies compared the performance of FDOPA-PET to other imaging modalities, including MRI, FDG-PET, and MET-PET.
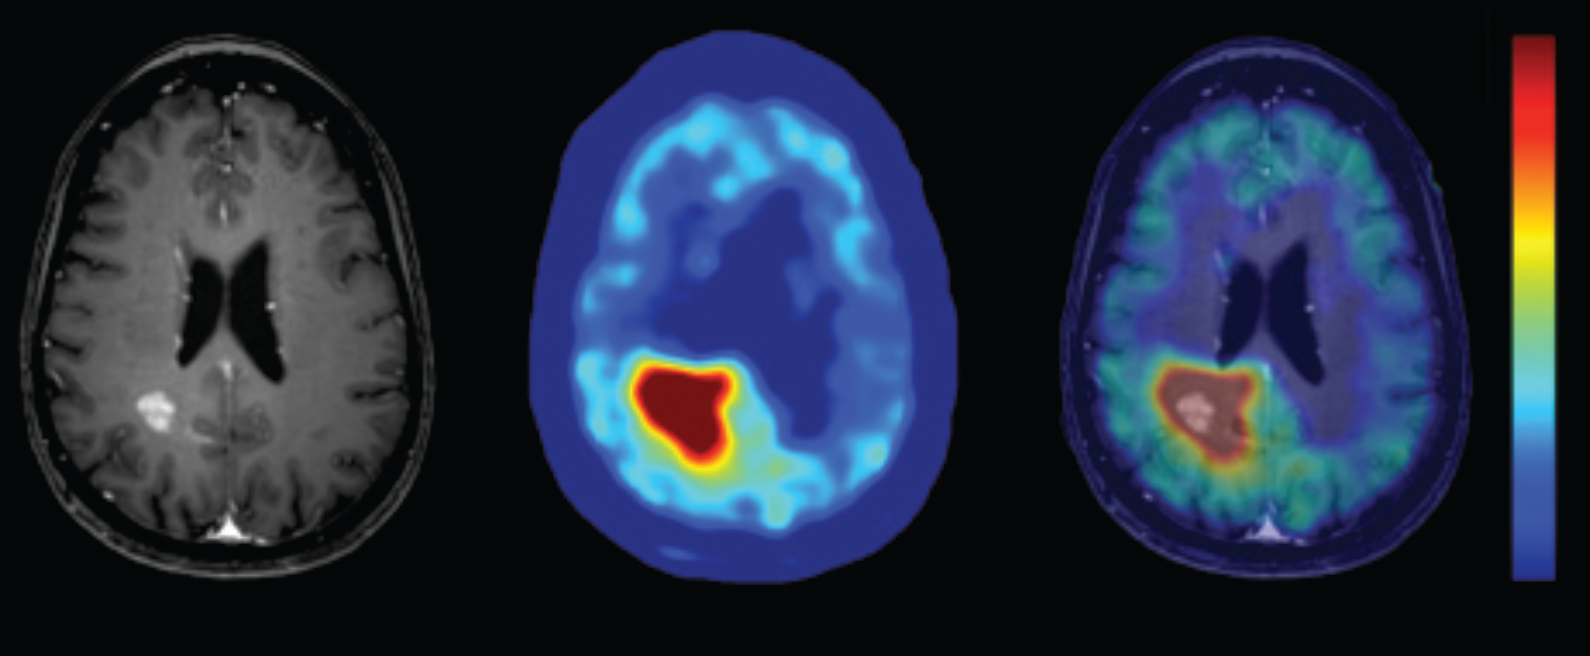
In newly diagnosed patients, the sensitivity and specificity of FDOPA-PET for differentiating low-grade from high-grade tumors varied from 70 to 96% and 86 to 100%, respectively (Figure 3).29,31,93 In one study, tracer uptake (maximum SUV) on FDOPA-PET correlated with tumor grade and proliferative activity only in untreated gliomas but not in previously treated gliomas. 29 In a study with tracer kinetic analysis in 37 gliomas, FDOPA was transported but not trapped in tumors. 30 The shape of the uptake curve was related to tumor grade. In high-grade tumors, uptake showed an early maximum followed by a steep descending activity, whereas low-grade tumors had a slowly declining curve, 30 a pattern that was similar to tumor kinetics reported in FET-PET studies. FDOPA had clinical utility in distinguishing higher density in gliomas using SUVs for guiding stereotactic biopsy. 94 In a large comparative study with MRI, including 91 patients, precise anatomic localization of FDOPA was facilitated by image fusion, with FDOPA-PET detecting both enhancing and nonenhancing tumors. 95 In some cases, FDOPA detected tumor before MRI. In a recent study of 35 patients studied for possible recurrent gliomas, the accuracy of FDOPA-PET/CT was higher compared to contrast-enhanced MRI (97% vs 80%). 96

Magnetic resonance (left column), FDG-PET (middle column), and FDOPA-PET (right column) images of a newly diagnosed glioblastoma (A) and a newly diagnosed World Health Organization grade II oligodendroglioma (B). Note that FDOPA uptake is elevated in both low- and high-grade gliomas. This research was originally published in JNM. Chen W, Silverman DH, Delaloye S, et al. 18F-FDOPA PET Imaging of Brain Tumors: Comparison Study with 18F-FDG PET and Evaluation of Diagnostic Accuracy. J Nucl Med. 2006;47(6):904-911. Figure 2. © by the Society of Nuclear Medicine and Molecular Imaging, Inc.
Direct Comparison between FDOPA-PET and FDG-PET
In direct comparisons, FDOPA-PET consistently outperformed FDG-PET in the diagnosis of brain tumors, especially low-grade tumors.31,97–100 In one of these studies, FDOPA was more reliable than FDG in detecting brain tumors and in finding recurrent tumors from both low- and high-grade tumors. However, in this study, FDOPA was not reliable to distinguish tumor grades. 97 In a recent study differentiating recurrent glioma from radionecrosis, FDOPA showed better sensitivity, specificity, and diagnostic accuracy (100%, 85.7%, and 96.4%, respectively) compared to FDG-PET; however, its accuracy was better than FDG-PET in recurrent low-grade tumors only. 98 In a study of 15 patients with low-grade glioma, FDOPA also outperformed both FDG-PET and 18F-3′-deoxy-3′-fluorothymidine (FLT)-PET. 99 In terms of response assessment during bevacizumab treatment of recurrent malignant gliomas, two separate studies evaluated the use of FDOPA (in 24 patients) and FDG-PET (in 25 patients).101,102 Both FDG and FDOPA uptakes proved to be a significant predictor of progression-free and overall survival. FDOPA-PET performed better than FLT-PET in direct comparison for predicting overall survival. However, no direct comparison is available to assess the usefulness of various amino acid versus FDG-PET modalities in response assessment during antiangiogenic treatment.
Direct Comparison between FDOPA-PET and MET-PET
In the only study to date comparing MET and FDOPA uptake in the same patients, 20 brain lesions (including 18 primary brain tumors) were studied. 28 All lesions were seen as hot spots with higher uptake than in the contralateral brain on both PET modalities. Mean tumor to contralateral SUV ratios were almost identical (2.05 for MET and 2.04 for FDOPA), whereas the only benign lesion (focal demyelination) showed a false-positive increased uptake on both scans. The authors concluded that FDOPA-PET may have a very similar clinical value to MET-PET and could be a preferred choice in brain tumor imaging due to its longer half-life in the clinical setting.
Potential Clinical Applications of AMT-PET
AMT-PET has been used in human neuroimaging studies since the early 1990s in four centers worldwide: McGill University, Montreal, Quebec, where AMT was developed32–34; Wayne State University, Detroit, Michigan35–38,66,68,103–107; the National Institutes of Health Clinical Center, Bethesda, Maryland 108 ; and, most recently, a multicenter group in Europe. 109 However, most studies focused on measuring abnormalities in brain serotonin synthesis or detecting epileptic foci. Neuro-oncologic application of AMT-PET originated from a single center (Wayne State University), where investigators observed high AMT uptake in a variety of low- and high-grade tumors.46,68,105 After the initial studies, it became clear that AMT-PET is extremely sensitive to detect WHO grade II—IV gliomas (Figure 4 and Figure 5) and grade I glioneuronal tumors and even grade I meningiomas (Figure 6), all of which almost invariably showed higher AMT uptake compared to normal cortex, regardless of the extent of contrast enhancement.46,47,68,105,110 The authors then used tracer kinetic analysis (mostly applying the Patlak graphical approach68,111) to explore if the different kinetic parameters are able to differentiate various tumor types, determine histologic grade of tumor, and/or differentiate glioma from radiation-induced tissue injury (Figure 7). These studies yielded a number of novel observations and applications of AMT-PET, some of which are unique and will need to be reproduced by other centers and with other amino acid radiotracers. Given that AMT brain tumor studies have not been reviewed before, in the next sections, we briefly summarize the main results with pre- and posttreatment AMT-PET imaging.

A, Tracer kinetic model for AMT. The inflow rate constant (K1) and the outflow rate constant (k2) describe the exchange of AMT between the plasma (CP) and the tissue (CT). CT includes the intracellular space (Cf) and the metabolite pool (Cm). In the intracellular space, a certain amount of AMT is enzymatically converted and enters the metabolite pool. The rate of this conversion is characterized by k3. The metabolite outflow rate (k4) is negligible in this model as the AMT metabolites are being trapped in the intracellular space, mainly in the form of 11C-alpha-methyl-L-kynurenine in tumors. B, The Patlak plots of two patients with a history of glioblastoma (GBM). The intercept of the curves represents the tracer volume of distribution (VD, which is proportional to the net tracer transport from the CP to CT), whereas the slope of the curves represents the estimated unidirectional AMT uptake (K complex). Note the higher slope and VD of the patient with pretreatment glioblastoma (see Figure 6) compared to the patient with previously radiated glioblastoma and prolonged survival, suggesting the presence of radiation necrosis in the magnetic resonance contrast-enhancing area in the latter patient (see Figure 7).

Contrast-enhanced magnetic resonance (left), AMT-PET (middle), and AMT/MRI fusion (right) images of a patient with a World Health Organization grade II glioma. The AMT-PET image is visualized using a rainbow scale, where red and yellow indicate increased and dark blue indicates decreased tracer uptake.
Contrast-enhanced magnetic resonance (left), AMT-PET (middle), and AMT/MRI fusion (right) images of a patient with pretreatment glioblastoma.
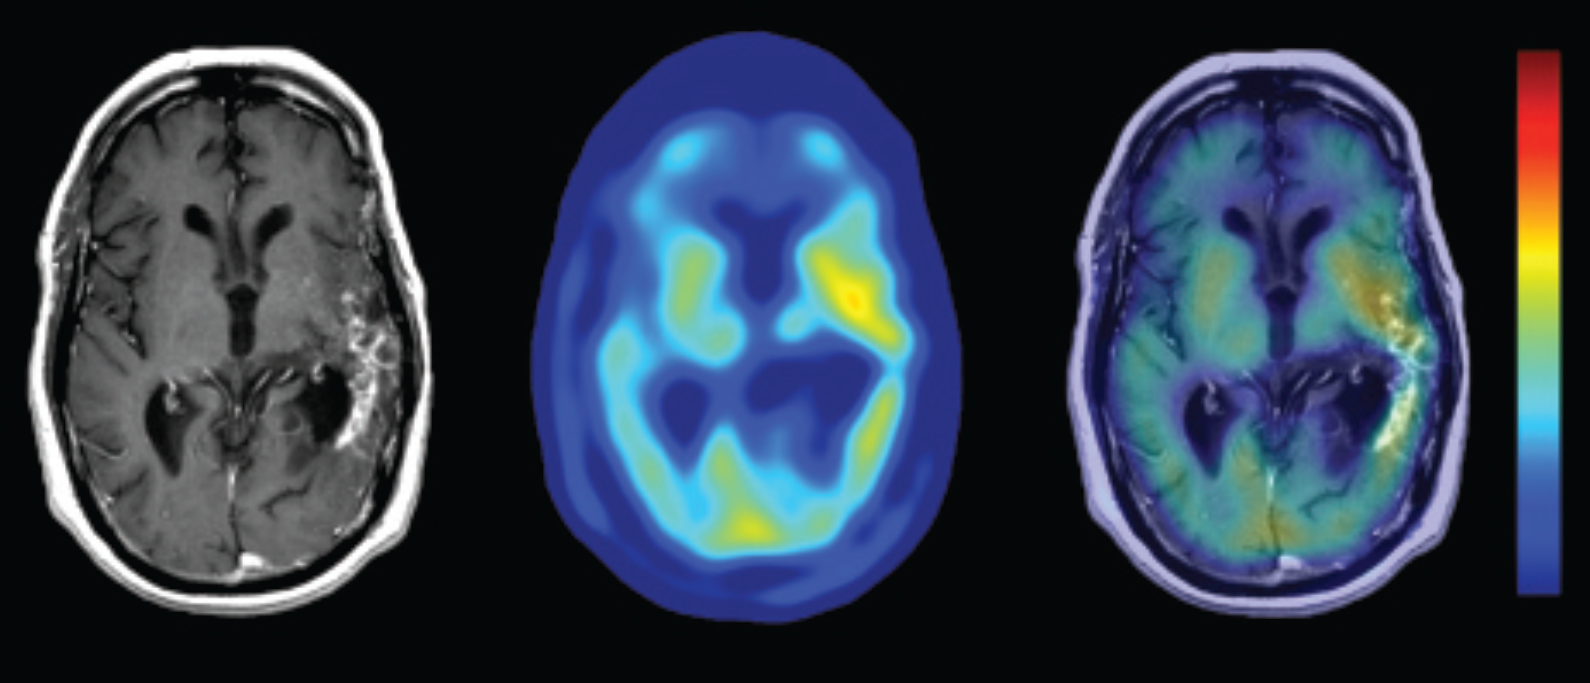
Contrast-enhanced magnetic resonance (left), AMT-PET (middle), and AMT/MRI fusion (right) images of a patient with previously radiated glioblastoma and prolonged survival. Low AMT SUV was associated with prolonged survival.
AMT-PET in Pre- and Posttreatment Evaluation of Brain Tumors
A unique feature of AMT-PET performed in untreated brain tumors is the ability to differentiate various tumor types based on their varied AMT kinetic characteristics. First, it has been shown that high AMT k3 tumor to cortex ratios can differentiate low-grade astrocytomas from oligodendrogliomas and dysembryoplastic neuroepithelial tumors (DNETs), tumors that cannot be distinguished by conventional MRI. 105 K3 is a kinetic PET parameter characterizing metabolic trapping, estimated by Patlak graphical analysis (as a ratio of K, the unidirectional uptake rate, and VD [volume of distribution], a measure of net tracer transport from the blood to the tumor) (see Figure 7). Noninvasive differentiation of low-grade glioma types may have high clinical value in the timing of treatment (surgery) and for prognosis. In a recent study, we also demonstrated that high-grade lesions with ring enhancement on MRI (common for both high-grade glioma and metastatic brain tumors) could be differentiated with 90% accuracy based on tumor to cortex SUV ratios. 112 This may have substantial clinical value in patients with newly diagnosed solitary ring-enhancing lesions.
Although AMT SUVs tend to be higher with increasing histologic grade, static AMT uptake is not a precise predictor of glioma grade (similar to the SUVs of most other amino acid PET tracers). However, AMT VD proved to be an accurate predictor of tumor proliferative index: high VD values were associated with high Ki-67 nuclear labeling measured in resected tumor tissue. 103 Tumor to cortex AMT VD ratios above 2.0 suggest at least a 10% Ki- 67 labeling index, which makes the presence of a high-grade tumor more likely.
Gliomas have a tendency to infiltrate into the surrounding brain parenchyma and can also induce significant peritumoral vasogenic edema. Increased AMT SUVs maybe helpful to detect tumor-infiltrated brain tissue beyond the MRI-detected tumor mass, 106 a finding that has been reported in other amino acid PET studies. In a study of 28 patients with WHO grade II–IV gliomas, AMT-PET-defined tumor volumes were greater than the MRI contrast-enhancing volume but smaller than T2 abnormalities. AMT-positive regions outside the contrast-enhancing glioblastoma mass were confirmed to be tumor-infiltrated brain by histopathology. 106 However, it remains unclear whether the performance of AMT-PET is different from that of other amino acid PET studies in this respect.
In a posttreatment study of 21 patients with MRI suspicion of glioma recurrence, the lesion to cortex ratio of AMT unidirectional uptake (K) differentiated recurrent gliomas from radiation necrosis with 90% accuracy, 110 which is a figure similar to what has been reported for FET-PET 85 and higher than reported in some MET-PET studies. 113 Our recent data also provided evidence indicating that simple AMT SUV measures can have a strong prognostic value regarding survival in patients with previously treated high-grade gliomas (Figure 8).104,107

Contrast-enhanced magnetic resonance (left), AMT-PET (middle), and AMT/MRI fusion (right) images of a patient with a World Health Organization grade I meningioma.
AMT-PET in Treatment Planning
In a longitudinal case study to observe treatment progression in a patient with an optic pathway glioma by AMT-PET, AMT uptake was high before and was considerably decreased after chemotherapy. 114 When the patient again developed vision difficulty, high AMT uptake reappeared, whereas the MRI showed no changes to identify the area of tumor for radiotherapy. In a recent study of 10 patients with high-grade glioma who underwent tumor resection followed by radiotherapy, AMT-PET provided superior coverage of the recurrence volume when compared to the gross tumor volume defined by clinical MRI. 115 Certainly, the clinical value of AMT-PET for treatment planning has to be verified on a larger number of patients.
Direct Comparisons between AMT-PET and FDG-PET
In the initial study of 40 patients with gliomas, the majority of tumors (77%) showed decreased or normal FDG uptake (including all low-grade tumors), whereas AMT-PET showed high uptake in 95% of the cases. 68 The only two lesions showing normal or decreased AMT uptake was a grade I astrocytoma and a hamartoma. In a subsequent study, AMT-PET was particularly sensitive for detecting DNETs, 46 which are highly epileptogenic lesions with invariably low glucose metabolism. Interestingly, two children with persistent seizures after tumor resection showed extratumoral cortical increases of AMT SUV, suggesting that AMT-PET could detect extratumoral epileptogenic cortex. This is a unique feature of AMT not reported for other amino acid tracers.
Tumoral AMT Trapping on PET: A Potential Imaging Marker of Tumoral Immunoresistance
As mentioned earlier, one of the most intriguing features of AMT-PET imaging lies in its potential to characterize tumoral activation of the immunosuppressive kynurenine pathway.36,70 Tryptophan catabolism via this pathway is a major mechanism involved in tumor immunoresistance.67,116 High expression and activity of IDO, the initial and rate-limiting enzyme of the kynurenine pathway, induces an immunosuppressive tumoral microenvironment by depleting tryptophan and by creating immunosuppressive metabolites such as L-kynurenine. 47 High kynurenine concentration can lead to suppression of regulatory T cells, thus promoting the escape of tumor cells from the host immune response. IDO (and a related enzyme, tryptophan 2,3-dioxygenase [TDO]) can be overexpressed in various tumors, including malignant gliomas.67,70,117,118 High IDO expression, detected by immunostaining, was found in primary brain tumors showing high AMT trapping. 70 In addition, AMT-PET studies showed high uptake in WHO grade I meningiomas, whose IDO expression could be blocked by a selective inhibitor of IDO1 (one of two isoforms of IDO). 47 Based on these studies, high AMT uptake and accumulation may be an imaging marker of high LAT1 and IDO activity, respectively. These results may have important therapeutic implications in clinical trials with emerging IDO inhibitors (e.g., INCB024360 [Incyte Corp.], 119 a highly potent inhibitor that has progressed to a phase II clinical trial), which aim to break tumoral immunoresistance, thus allowing chemotherapy to exert maximum effect. In such trials, AMT-PET may provide at least two unique pieces of imaging information not readily generated from other imaging approaches: high AMT accumulation may highlight tumors with high IDO/TDO activity, identifying tumors most amenable to enzyme inhibitor treatment, and AMT-PET may also be instrumental to monitor IDO inhibitor activity noninvasively by showing changes in AMT trapping after administration of the enzyme inhibitor.
Conclusion
Amino acid PET offers powerful molecular imaging probes for noninvasive evaluation of brain tumors. Quantification and tracer kinetic analysis can greatly enhance the clinical information obtained by these techniques: for example, a good estimation of tumor proliferative activity is only possible this way rather than by static uptake values, which show great overlap across glioma grades. Although most studies indicate that the studied radiotracers offer benefits over widely used clinical modalities (conventional MRI and FDG-PET), direct comparisons among the various amino acid tracers are limited, and none of them appear to have a clear advantage over the others in all aspects of brain tumor imaging. Indeed, all of these have their advantages and pitfalls (Table 1). Although most amino acid radiotracers share common transport mechanisms, they have different metabolic fates in the tumor, which can be exploited to find optimal clinical applications for specific tracers. To test these applications, there is a need for prospective comparative studies in large patient cohorts to sort out the clinical value of the most promising radiotracers and compare them not only to each other but also to emerging advanced MRI modalities.
Main Advantages and Limitations of Amino Acid PET Tracers Used for Brain Tumor Imaging
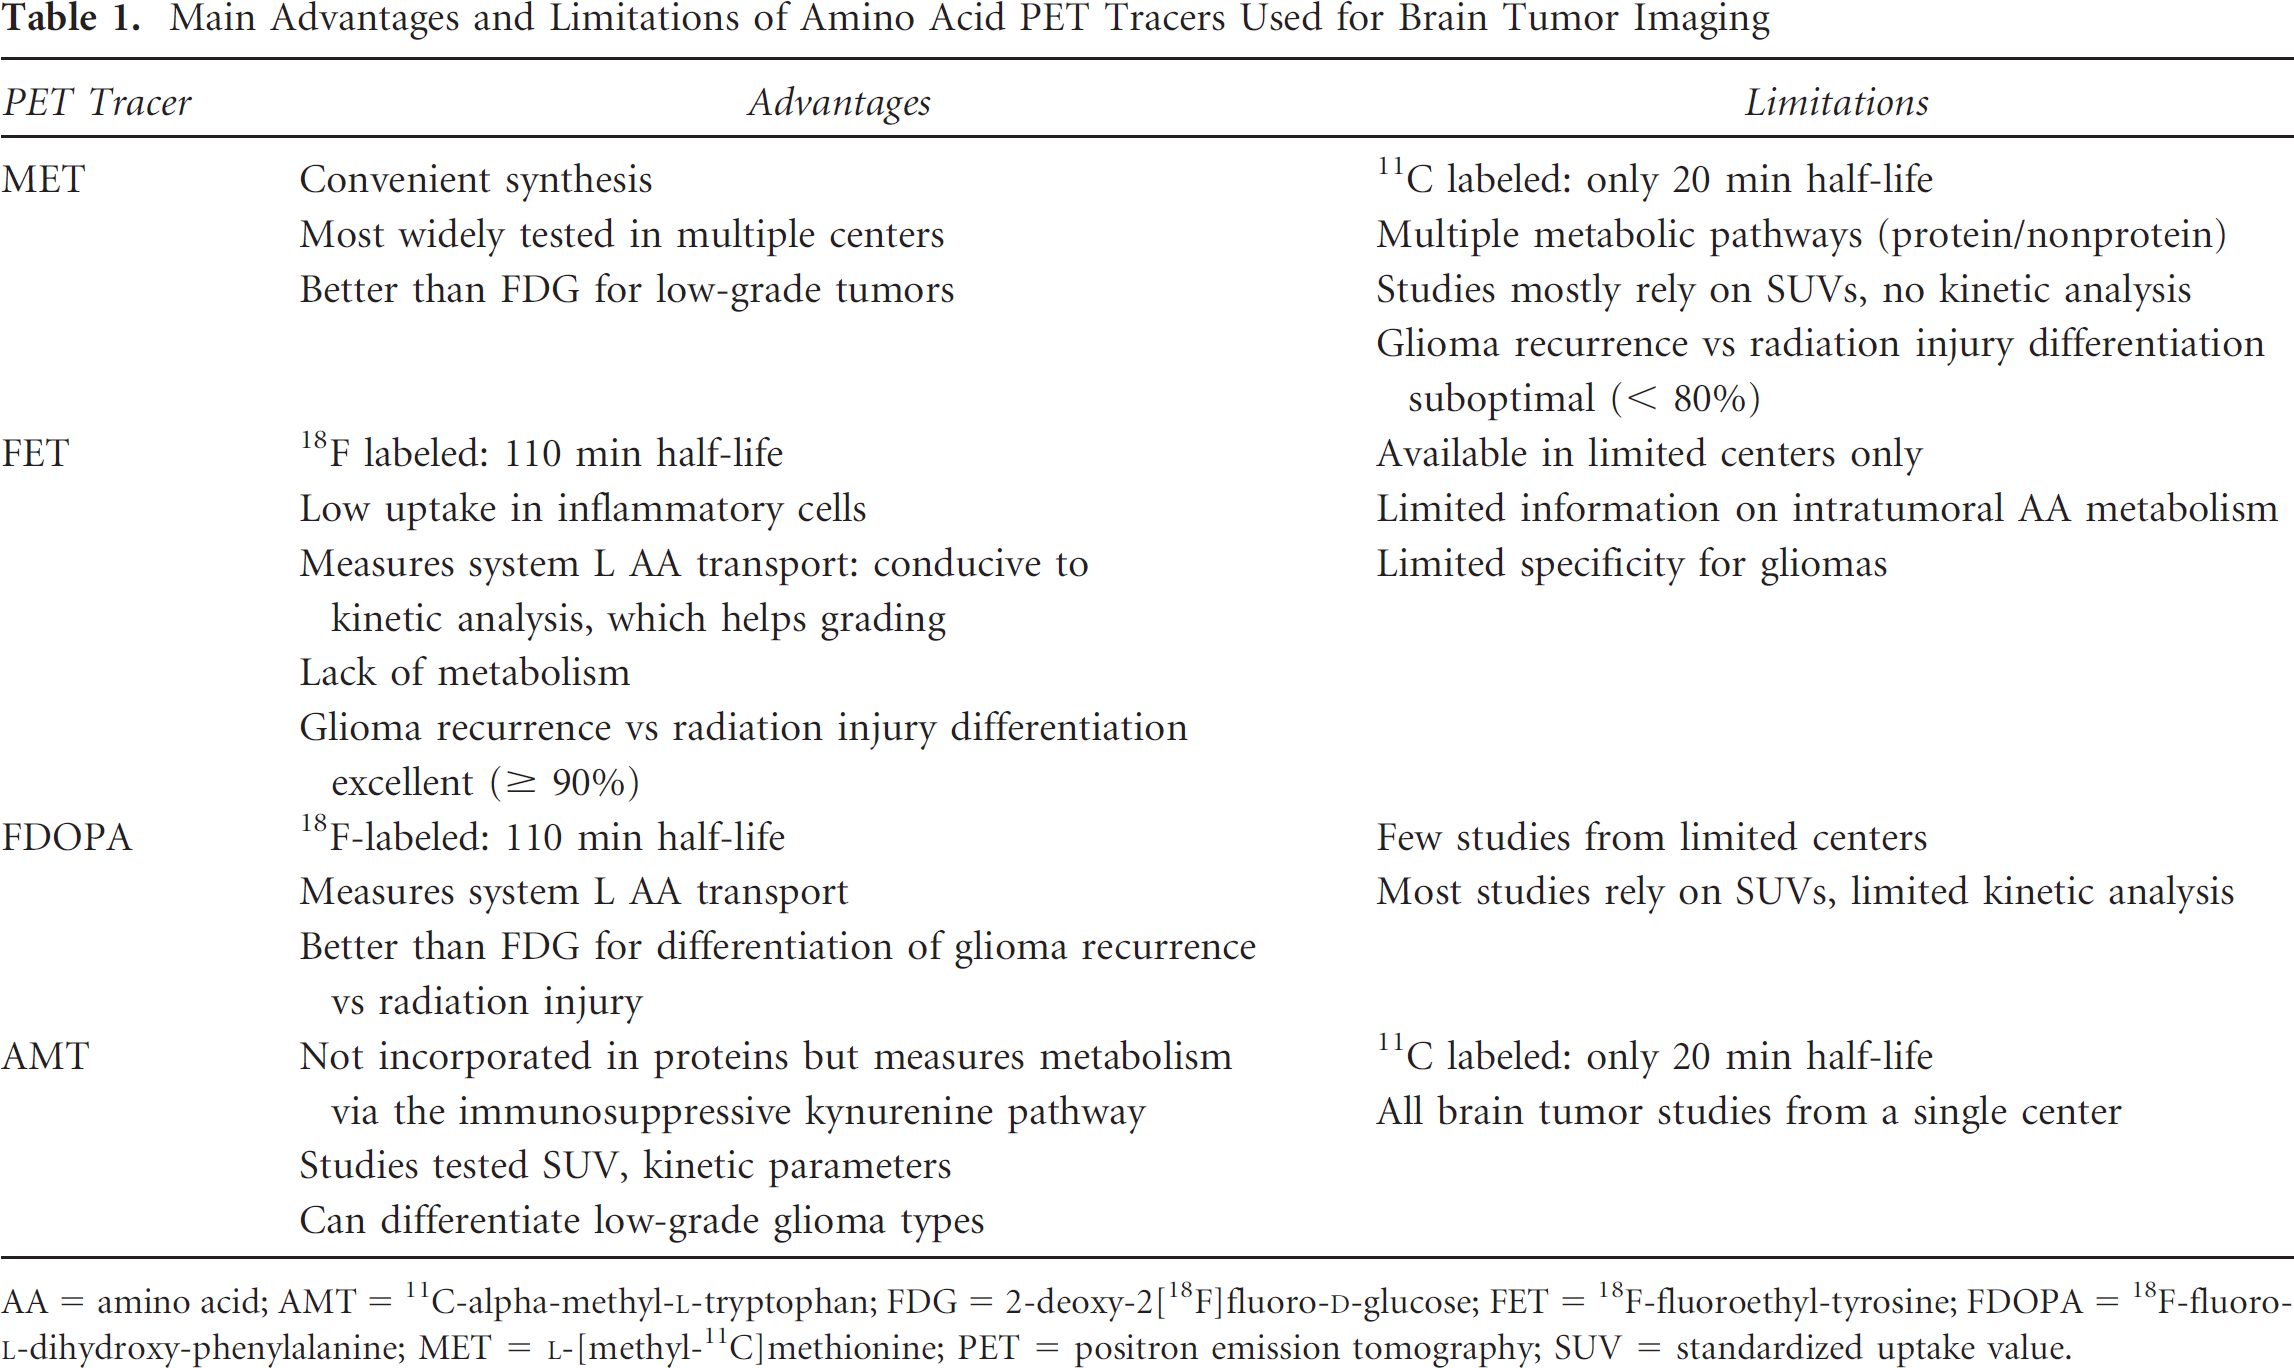
AA = amino acid; AMT = 11C-alpha-methyl-L-tryptophan; FDG = 2-deoxy-2[18F]fluoro-D-glucose; FET = 18F-fluoroethyl-tyrosine; FDOPA = 18F-fluoro-L-dihydroxy-phenylalanine; MET = L-[methyl-11C]methionine; PET = positron emission tomography; SUV = standardized uptake value.
Footnotes
Acknowledgment
Financial disclosure of authors: The study was supported by a grant (R01 CA123451 to C.J. and S.M.) from the National Cancer Institute; a grant from the Fund for Medical Research and Education, Wayne State University School of Medicine (to S.M.); and a Strategic Research Initiative Grant from the Karmanos Cancer Institute (to S.M. and C.J.).
Financial disclosure of reviewers: None reported.