
Abstract
Noninvasive imaging methods are required to monitor the inflammatory content of atherosclerotic plaques. FEDAA1106 (N-(5-fluoro- 2-phenoxyphenyl)-N-(2-(2-fluoroethoxy)-5-methoxybenzyl) acetamide) is a selective ligand for TSPO-18kDa (also known as peripheral benzodiazepine receptor), which is expressed by activated macrophages. We compared 18F-FEDAA1106 and 2-deoxy-2-[18F]fluoro-D- glucose (18F-FDG, a marker of glucose metabolism) for positron emission tomographic (PET) imaging of vascular inflammation. This was tested using a murine model in which focal inflammation was induced in the carotid artery via placement of a constrictive cuff. Immunostaining revealed CD68-positive cells (macrophages) at a disturbed flow site located downstream from the cuff. Dynamic PET imaging using 18F-FEDAA1106 or 18F-FDG was registered to anatomic data generated by computed tomographic (CT)/CT angiography. Standardized uptake values were significantly increased at cuffed compared to contralateral arteries using either 18F-FEDAA1106 (p < .01) or FDG (p < .05). However, the 18F-FEDAA1106 signal was significantly higher at the inflamed disturbed flow region compared to the noninflamed uniform flow regions, whereas differences in FDG uptake were less distinct. We conclude that 18F-FEDAA1106 can be used in vivo for detection of vascular inflammation. Moreover, the signal pattern of 18F-FEDAA1106 corresponded with vascular inflammation more specifically than FDG uptake.
ATHEROSCLEROSIS is a chronic inflammatory disease of the arterial wall. The degree of inflammation and the presence of macrophages are believed to influence the risk of plaque rupture. 1 Thus, noninvasive methods to monitor the inflammatory content of plaques are required for the clinical management of patients with cardiovascular disease.
We recently developed a novel imaging method to study the effects of altered blood flow on vascular function in living animals that involves coupling of positron emission tomographic (PET) imaging with the generation of spatially distinct blood flow fields in murine carotid arteries. 2 The method involves surgical placement of a cuff manufactured from polytetrafluoroethylene (PTFE) on the carotid artery. The cuff has an internal diameter of 500 μm tapering to 250 μm over a length of 1 mm, thus altering the geometry of the vessel lumen. We demonstrated that the altered geometry of cuffed arteries corresponds to altered patterns of blood flow. Specifically, the cuff generates regions of high uniform (at the cuff), low uniform (upstream), and disturbed (downstream) blood flow.3,4 Using this model, we previously demonstrated that vascular inflammation occurs specifically at the downstream disturbed flow site and that uptake of 2-deoxy-2-[18F]fluoro-D-glucose (18F-FDG, an analogue of glucose) is enhanced at this region. 2 However, although PET-FDG is widely used to assess vascular inflammation,5–8 it remains an unspecific marker. Indeed, uptake of FDG can be associated with multiple, diverse processes that involve glucose metabolism, including cell division, muscle contraction, overall metabolic activity, and fibrosis as well as inflammation. Thus, FDG-PET does not differentiate between glucose uptake due to inflammation and the uptake due to other metabolic processes in adjacent tissues. This problem is exemplified during analysis of FDG uptake in inflamed carotid arteries and thoracic aortas, which can be affected by spillover of uptake in brain and heart, respectively, due to their high metabolic activity. It is thus of primary importance to develop new imaging biomarkers that identify inflamed regions of arteries more specifically.
During the late 1980s, tracers binding to benzodiazepine receptors in the brain were also found to interact with the outer mitochondrial membrane. They were originally referred to as peripheral benzodiazepine receptors because of their high expression in peripheral organs such as adrenal glands and kidneys 9 but are now termed translocator protein 18 kDa (TSPO). 10 TSPO is highly expressed in macrophages11,12 and therefore may be a suitable target for imaging inflammation. Numerous TSPO PET tracers have been developed and used mainly for the imaging of neuroinflammation. 13 , 14 Recent publications have demonstrated the potential use of TSPO tracers as a surrogate marker of vascular inflammation.15–18 The aim of the present study was to examine whether the TSPO tracer 18F-FEDAA1106 can be used to image vascular inflammation in vivo and to compare the specificity of 18F- FEDAA1106 and 18F-FDG for imaging of inflammation.
Methods
Animals
Male C57BL/6 mice or apolipoprotein E-deficient mice (ApoE−/−; C57BL/6 background) between 2 and 4 months of age were used. Constrictive cuffs with an internal diameter of 500 μm tapering to 250 μm over a length of 1 mm were manufactured from PTFE. They were placed on the right carotid artery under isoflurane anesthesia as previously described.3,4 All experiments were carried out according to the guidelines laid out in the Animals Scientific Procedures Act (1986) under a project license from the UK Home Office and approved by the local ethical review panel following guidelines from the Geneva University Animal Care and Use Committee in accordance with Swiss regulations.
Radioprobes
18F-FDG was provided by Siemens PETNET Solutions (Mount Vernon Hospital, UK). N-(5-fluoro-2-phenoxyphenyl)-N-(2-18F-fluoroethyl-5-methoxybenzyl) acetamide (18F-FEDAA1106) and unlabeled FEDAA1106 were kindly provided by the Wolfson Brain Imaging Centre, University of Cambridge. Synthesis was performed by radiofluorination of a tosyl precursor (TsEDAA1106). The [18F]- FEDAA1106 synthesis concentration range was 0.156 to 0.55 nmol/mL, and the specific activity was 224 to 1,357 GBq/mmol.
In Vivo FDG PET/CT Imaging
A combined PET/computed tomographic (CT) preclinical scanner was used (Inveon, Siemens Preclinical Solutions, Munich, Germany). A CT scan was first acquired to correct PET data for photon attenuation with the power of the x-ray source set to 80 kVp and 500 mA, 220 projections, and an exposure time of 200 ms. Three bed positions were acquired to match the full PET field of view with a final isotropic resolution of 103 microns. PET acquisition for 1 hour was initiated simultaneously to intravenous injection of 18F-FDG (8.9 ± 3.6 MBq, n = 5) or 18F-FEDAA1106 (9.1 ± 3.4 MBq, n = 6), with an energy window of 350 to 650 keV and a coincidence timing window of 3.4 ns. Finally, the animal bed was moved back to the center of the CT field of view prior to CT angiography using Ultravist 370 (Bayer Healthcare Pharmaceuticals, Leverkusen, Germany), which was infused intravenously at a speed of 6 mL/hr using a syringe pump (PHD 22/2000, Harvard Apparatus, Holliston, MA). 2 CT angiography was acquired using the following parameters: electrocardiography and respiration gating, x-ray source set to 80 kVp and 500 mA, 220 projections over 220°, and an exposure time of 200 ms.
Image Reconstruction
PET and CT reconstructions were performed using the Inveon Acquisition Workplace (IAW v1.5, Siemens Preclinical Imaging). All PET scans were normalized for detector inhomogeneity and corrected for scatter and attenuation. Then PET data were assessed over 37 frames to identify any movement artifacts and were reconstructed using an iterative approach with a combination of ordered subset expectation maximization and maximum a posteriori (OSEM-MAP) algorithm with two OSEM3D iterations and 16 subsets, followed by 18 MAP iterations. The smoothing factor β in MAP reconstructions was set to 0.5. A matrix of 256 × 256 and a zoom of 2 were applied to all data during reconstruction, providing a final resolution of 0.215 × 0.215 × 0.796 mm. CT data were reconstructed using a filtered backprojection-based method modified from the algorithm of Feldkamp and colleagues 19 with no down-sampling, a bilinear interpolation, and a Shepp-Logan filter. Polynomial-based soft tissue beam hardening correction was applied to the projection data for CT angiography. Pre- and postcontrast three-dimensional (3D) volumes were coregistered using rigid body transformation. Data were then subtracted using an in-house script written in Matlab 7.0 (MathWorks, Natick, MA) and visualized using 3D maximum intensity projection in OsiriX 3.9 (OsiriX Imaging Software, Los Angels, CA).
Definition of Regions of Interest and Quantification
Analysis was performed in IRW 4.0 (Siemens Preclinical Solutions). Briefly, CT, PET, and CT angiography data were loaded simultaneously and coregistered using adaptive rigid body transformation (Siemens IRW 4.0). Regions of interest were defined on CT angiography images and then overlaid onto PET images to allow quantification of PET signals. Six regions, each 8 mm3, were studied: on the cuff (high undisturbed flow) and downstream (rostral; disturbed flow) and upstream (caudal; low undisturbed flow) on the ipsilateral (cuffed) and contralateral (unmanipulated) sides. Standardized uptake values (SUVs) normalized to body weight were calculated providing a comparable quantification (g/mL) for each animal on the summed framed for the last 15 and 20 minutes for 18F-FEDAA1106 and 18F-FDG, respectively. CT angiography volumes were segmented using a Hounsfield unit window of 400 to 700. Right and left carotid diameters were then determined at the same level of each region of interest used for the PET analysis.
Arterial Input Function
The arterial input function was derived from the images. A volume of interest was drawn covering the left ventricle of the heart. Time-activity curves were then extracted for voxels with highest activity at early times after injection (within the first 12 seconds following the injection) and the lowest activity at the late time point (30-60 minutes postinjection) to avoid voxels corrupted by the spillover of the uptake in the surrounding tissues. Typically, the region of interest for the arterial input function included 90 ± 18 voxels.
Nonlinear Least Square Fitting for Kinetic Modeling
Kinetic modeling was achieved using a one-tissue compartment model. In this model, the kinetic rate constants K1 and k2 represent the tracer uptake from the blood pool (Cp) by the tissue (C1) and the elimination from tissue to blood pool, respectively. The macroscopic parameter Vt (volume of distribution) was extracted as the ratio between K1 and k2:

Graphical Analysis
The linearization of reversible binding was achieved using the technique described by Logan 20 implemented under IRW 4.0 (Siemens Preclinical Solutions). Parameters were estimated from the following equation:

where V represents the Vt after reaching the equilibration time t*. At t*, V and b were estimated as the slope and intercept, respectively, using the linear regression form the time T>t*. In our case, we started the linear regression with t* set to 30 minutes.
Statistics
The appropriateness of the model was estimated by computing the Akaike information criterion (AIC):

where n is the number of data points, w. is the weight applied to the points (Poisson weighting), p is the number of parameters, Ycal is the value calculated by the model, and Yobs is the observed data. For graphical methods, the goodness of fit was estimated using the linear correlation coefficient (R2). Correlations with R2 < .8 were rejected. Changes between time-activity curves were assessed using the Mann-Whitney nonparametric test. Kinetic parameters were compared using the Wilcoxon signed rank test followed by a paired t-test. Data are expressed as mean ± standard error of the mean (*p < .05; **p < .01; ***p < .001).
Immunostaining
The accumulation of macrophages at high (at the cuff), low (upstream), and disturbed (downstream) flow regions was assessed by en face immunostaining. Animals were perfused in situ with phosphate-buffered saline and then perfusion fixed with 2% formalin prior to the harvesting of carotid arteries. Fixed vessels were tested by immunostaining using anti-CD68 antibodies (Serotec, Hercules, CA) and Alexa Fluor 568-conjugated secondary antibodies. Endothelial cells were identified by costaining with anti-CD31 antibodies (BD Biosciences Pharmingen, San Jose, CA) conjugated with fluorescein isothiocyanate (FITC). Cell nuclei were visualized through a DNA-binding probe with far-red emission (ToPro3, Invitrogen). Costaining of TSPO (Abcam, Cambridge, UK, ab 109497; 1:50 dilution) and MAC3 (macrophage marker; BD Pharmingen; 1:100 dilution) was carried out using frozen cross sections. Modified arteries were embedded in OCT compound and snap frozen prior to the preparation of 5 μm thick sections. Fluorescence was measured in stained vessels using confocal laser-scanning microscopy (Zeiss LSM 510 META, Oberkochen, Germany).
Results
18F-FEDAA1106 Binding to TSPO-Rich Tissues
We assessed the specificity of the 18F-FEDAA1106 probe by studying its ex vivo binding to murine hearts, which are enriched for TSPO expression. We observed in three independent experiments that preincubation of tissue sections with 1 μM unlabeled FEDAA1106 reduced subsequent binding of 18F-FEDAA1106 by 55% (p < .05; Figure S1, online version only). Moreover, in vivo studies revealed that 18F-FEDAA1106 signals from the heart were reduced by 93% following a subsequent injection of unlabeled FEDAA1106 (2.6 mg/kg; 250 nmol per animal), indicating that the unlabeled form can displace 18F-FEDAA1106 from cardiac tissues (Figure S2, online version only). Collectively, these data indicate that 18F-FEDAA1106 can bind to TSPO- rich tissues and likely indicate specificity.
18F-FEDAA1106 In Vivo Biodistribution in Mice
The in vivo biodistribution of 18F-FEDAA1106 was studied in mice with cuffed carotid arteries. PET signals were quantified in multiple tissues and at particular regions of right and left carotid arteries using a multimodality approach in which CT angiography and PET were coregistered with a CT scan (Figure 1). It was observed that 18F-FEDAA1106 showed primary elimination through the kidneys and the liver (Figure 2). The uptake observed at the level of the lungs and brain appeared to progressively decrease, whereas the uptake at the level of the carotids increased. These data indicate that systemically introduced 18F-FEDAA1106 distributes quickly and then washes out rapidly from tissues through the kidneys and liver.
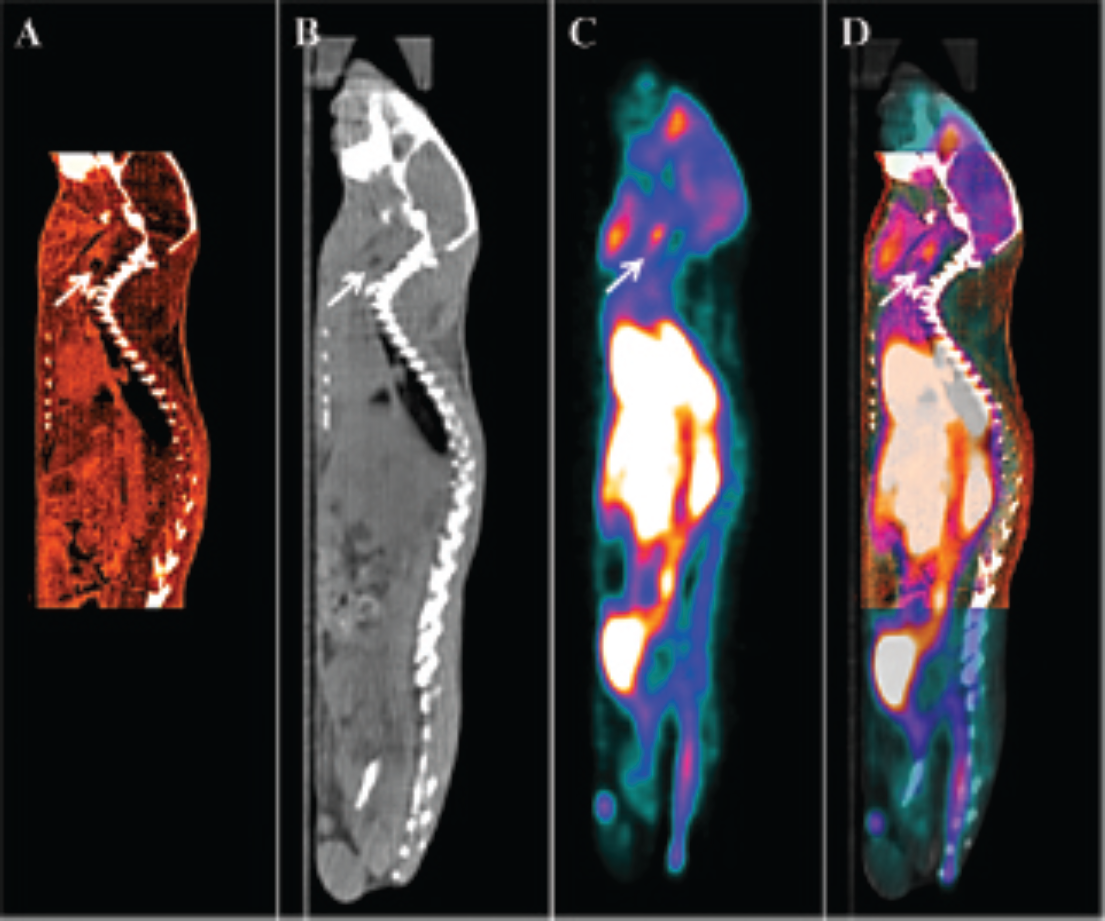
Multimodality approach using CT/PET/CT angiography data. The right carotid arteries of mice (C57BL/6) were modified using a constrictive cuff. After 2 weeks, mice were injected intravenously with 18F-FEDAA1106. CT angiography (A) and FEDAA1106 PET (C) were coregistered to the CT scan (B). This resulted in a complex image (PET/CT/CT angiography) (D) in which the cuff (indicated by arrow) and PET signal can easily be identified. Eight cubic millimeter regions of interest were drawn on the CT angiography and used to inform quantitation of PET signals at discrete sites within the carotid arteries. Data are representative of those obtained from five animals.

18F-FEDAA1106 dynamic biodistribution at multiple sites. The right carotid arteries of mice (C57BL/6) were modified using a constrictive cuff. After 2 weeks, mice were injected intravenously with 18F-FEDAA1106. Time-activity plots are shown for different organs. Data from six animals were pooled and are expressed as percentage of injected dose per cubic centimeter (%ID/cc, mean 6 SEM) as a function of postinjection time (minutes).
18F-FEDAA1106 Uptake Was Enhanced at a Site of Vascular Inflammation
A flow-altering cuff was used to modify murine carotid arteries to generate spatially distinct sites of vascular inflammation. In vivo CT angiography enabled clear localization of the constrictive cuff (Figure 3) and therefore the precise location of regions of interests for PET quantification. Moreover, the 3D rendering enabled us to visualize the constriction induced on the carotid artery and, more importantly, to ensure that the cuff was not placed too close to the vessel bifurcation, which is a site of endogenous disturbed flow and inflammation. Our study revealed that the diameter of contrast media associated with the right carotid (cuffed) was significantly higher than the diameter at the left carotid artery (unmanipulated) (see Figure 3E; 1.25 ± 0.09 mm vs 0.58 ± 0.03 mm, respectively). This is unlikely to be due to aliasing because the density of PTFE is very close to water. Instead, we suggest that a proportion of the contrast medium at the right carotid artery was extravascular as a signal appeared to originate from outside the cuff (see Figure 3D, arrowhead).

Visualization of carotid arteries using CT angiography. The right carotid arteries of mice (C57BL/6) were modified using a constrictive cuff. After 2 weeks, CT scans were performed before (A) and following (B) intravenous injection of Ultravist 370 contrast agent. CT angiography allowed localization of the constrictive cuff (arrow) on the right carotid artery. Pre- and postcontrast CT images were subtracted (C). The subtracted 3D data were then processed for 3D rendering (D). Note the accumulation of contrast agent outside the cuff at the right carotid artery (arrowhead). E, The diameters of contrast agent associated with the right or left carotid arteries were measured. Measurements were made at the level of the cuff, downstream and upstream in the right carotid artery, and at equivalent positions in the left carotid artery. Data were pooled from three measurements from each site using five mice, and mean values ± SEM are shown. Scale bars indicate 1 cm.
To avoid the potential effects of soluble/pooled probe, we quantified PET signals in carotid arteries using late frames where the soluble probe had been “washed out.” Using this approach, it was observed that the 18F- FEDAA1106 signal was significantly higher in the right compared to the left carotid artery (Figure 4A; 0.72 ± 0.15 vs 0.50 ± 0.08, respectively, p < .01). When investigating more precisely the uptake at the level of the carotids, time-activity curves (Figure 5A) showed a significantly higher increase in binding at the downstream region (disturbed flow) when compared to the cuffed or upstream regions (3.55 ± 0.98 vs 2.30 ± 0.67 %ID/g for downstream and cuff, respectively, at 60 minutes postinjection, p < .001, Mann-Whitney test). This increase in the binding reached a steady state early after injection (within 2-3 minutes) and remained constant until the end of the scan (60 minutes). By contrast, time-activity curves extracted from the brain and lungs revealed maximum activity at 1 minute postinjection and then a progressive decrease over time (see Figure 3 and Figure 5A). Similarly, calculation of SUVs from 45 to 60 minutes post-FEDAA1106 injection demonstrated enhanced activity at the downstream site (see Figure 4D; 0.9 ± 0.18 vs 0.6 ± 0.11 [cuffed] and 0.65 ± 0.12 [upstream] at 60 minutes postinjection). The estimation of K1, k2, and Vt by one-compartment analysis and the Vt estimated by the graphical Logan plot were calculated for carotid arteries (and for brain as a reference; Table 1). Vt was significantly higher at the downstream region compared to adjacent sites (0.71 ± 0.15 vs 0.43 ± 0.10 [cuff] vs 0.41 ± 0.081 [upstream] estimated by non least square fitting (NLS), p < .05). This result reflects the significant increase in K1 in that region (0.148 ± 0.071 [downstream] vs 0.105 ± 0.06 [cuff] vs 0.12 ± 0.07 [upstream], p < .001). Although the mean Vt values estimated by the graphical analysis were larger than those estimated by compartmental analysis in all regions, a good correlation was observed between them (r2 = .998; see Figure 5B).
Non Least Square Fitting and Graphical Analysis Summary.
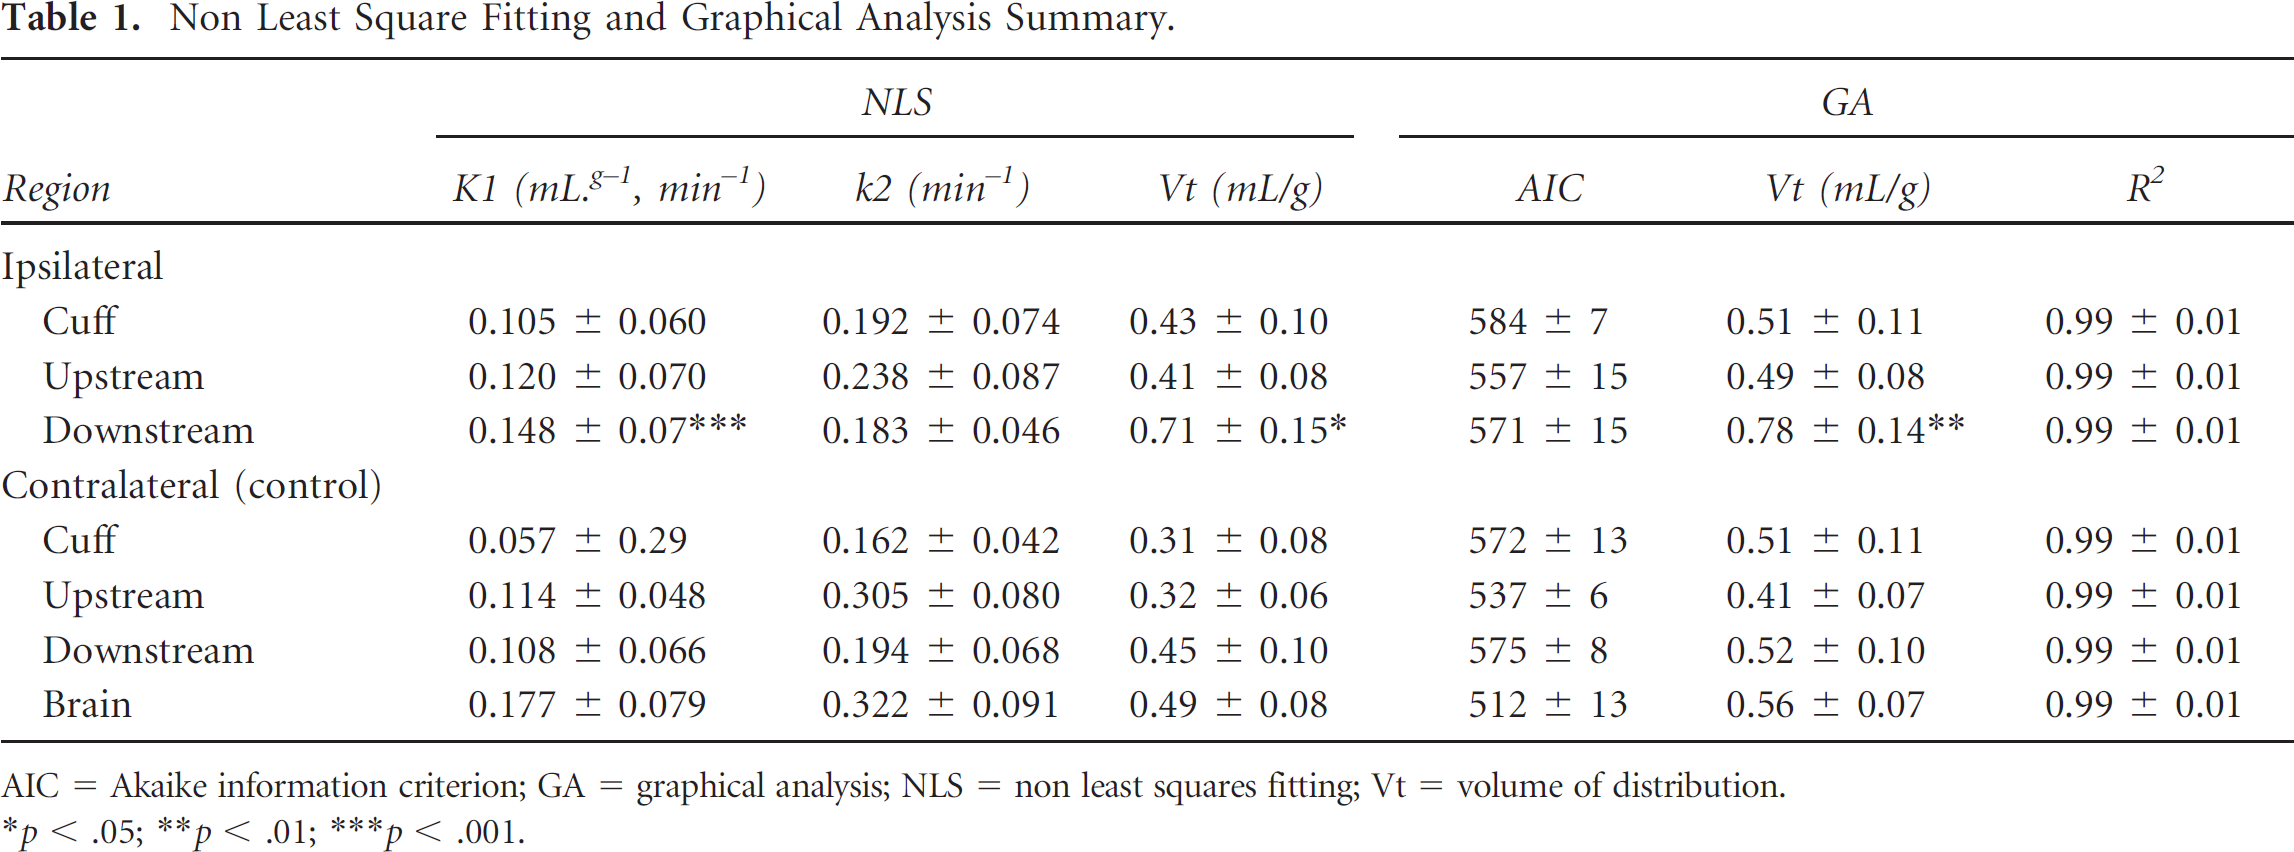
AIC = Akaike information criterion; GA = graphical analysis; NLS = non least squares fitting; Vt = volume of distribution.
p < .05
p < .01
p < .001.
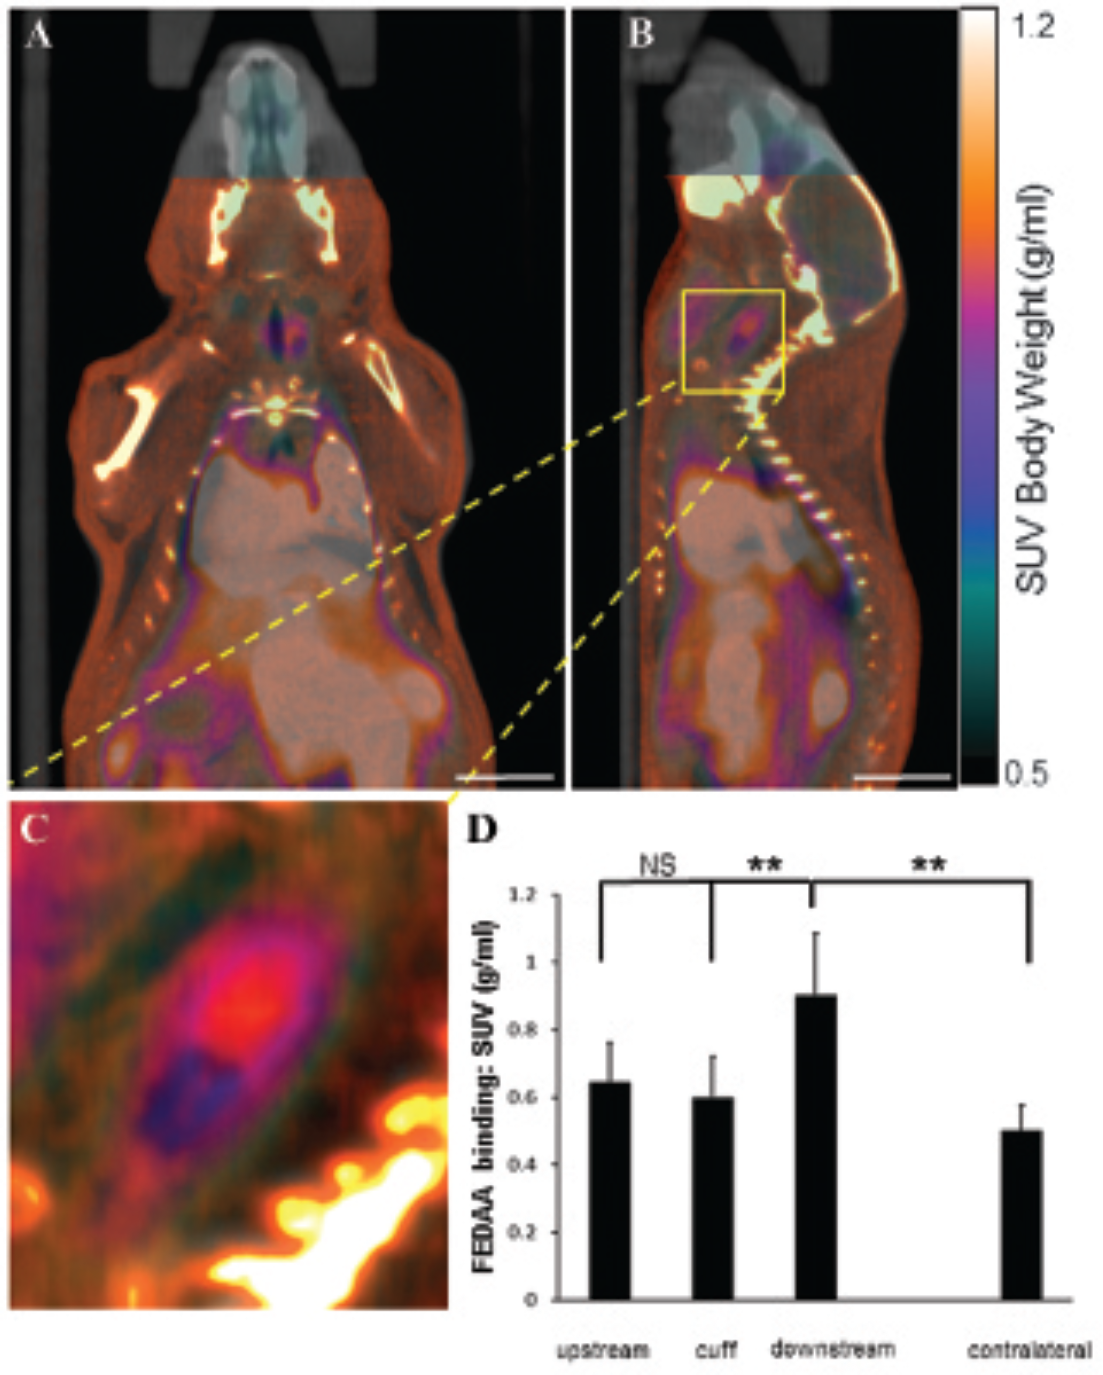
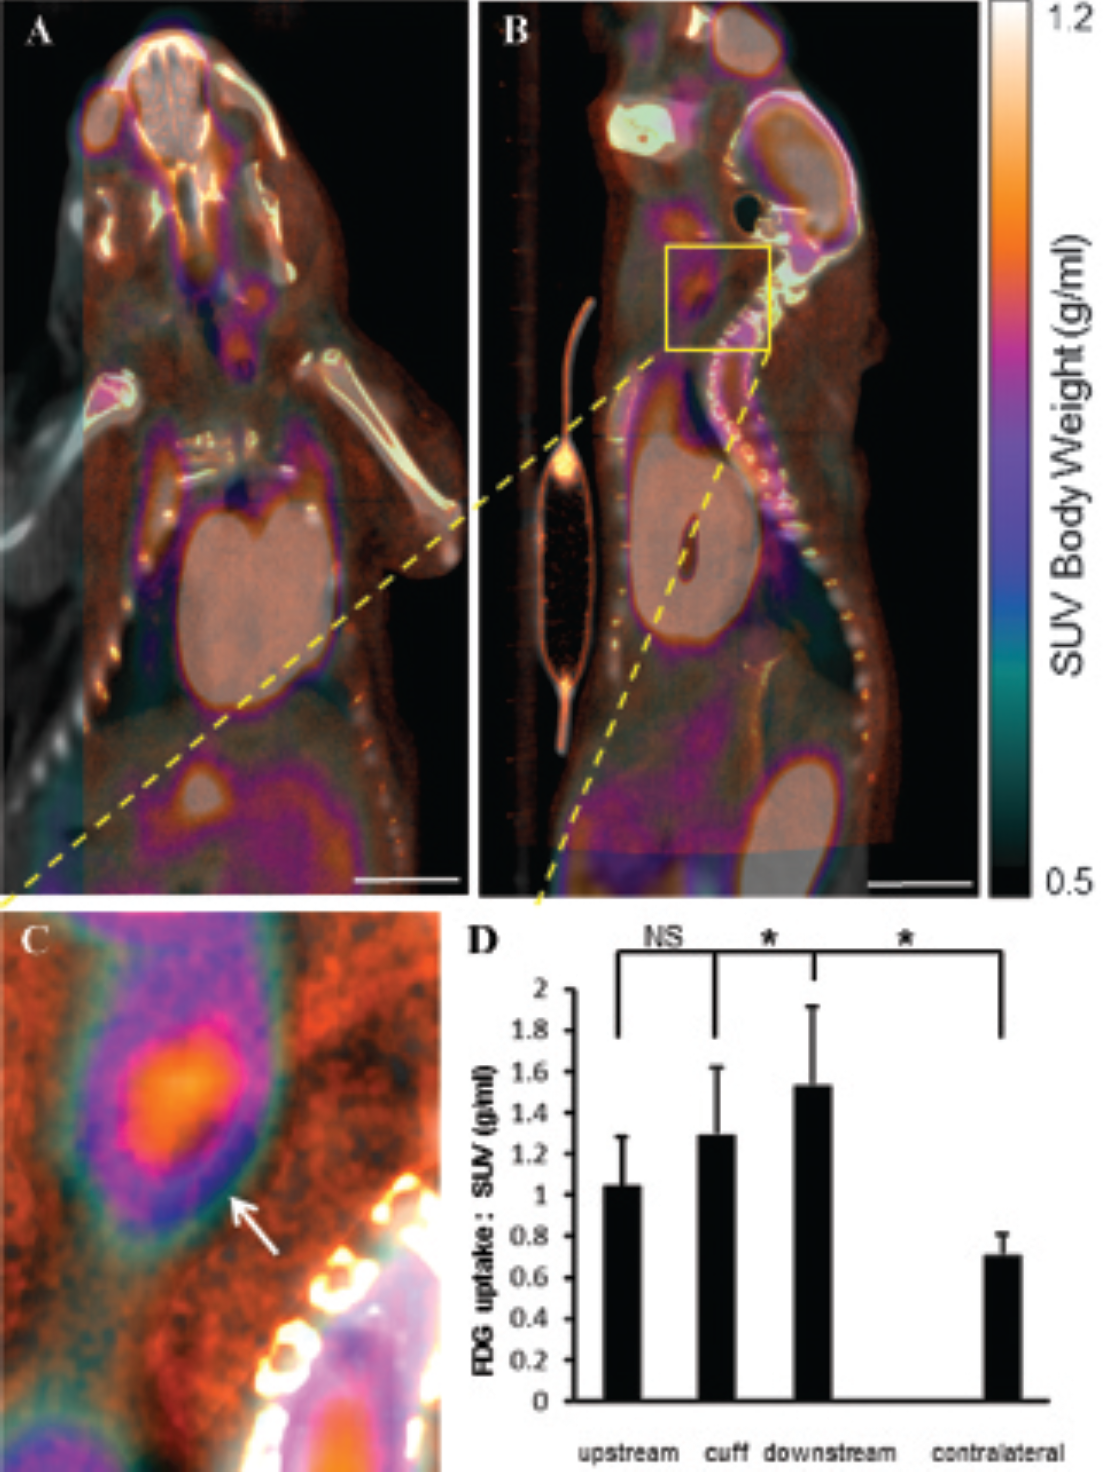
18F-FEDAA1106 binding was enhanced at a disturbed flow region in cuffed arteries. The right carotid arteries of mice (C57BL/6) were modified using a constrictive cuff. After 2 weeks, mice were injected intravenously with 18F-FEDAA1106. 18F-FEDAA1106 binding was studied in the right (cuffed) or the left (unmanipulated) carotid artery. PET/CT/CT angiography images were coregistered, and representative composite images are shown in coronal (A) or sagittal (B, C) orientation. D, 18F-FEDAA1106 binding was quantified at the cuff and downstream and upstream regions in the right carotid artery and at equivalent positions in the contralateral carotid artery expressed as SUVs. Data from six animals were pooled, and mean SUVs ± SEM are shown. Scale bars indicate 1 cm.

Kinetic modeling of 18F-FEDAA1106 binding in experimental arteries. The right carotid arteries of mice (C57BL/6) were modified using a constrictive cuff. After 2 weeks, mice were injected intravenously with 18F-FEDAA1106. A, Time-activity plots are shown. 18F-FEDAA1106 binding was quantified in right (cuffed) carotid arteries at the cuff and at downstream and upstream regions. Data from six animals were pooled and are expressed as percentage of injected dose per cubic centimeter (%ID/cc, mean ± SEM) as a function of postinjection time (minutes). The downstream region to the cuff elicited a significantly higher activity than the cuff or upstream regions (***p < .001, Mann-Whitney tests). B, Vt values estimated using the non least squares method were plotted against those generated using the graphical method as a comparison. Each point represents the average Vt value calculated from each of the regions analyzed. Mean values ± standard deviations are shown (*p < .05, ***p < .001, Wilcoxon signed rank test followed by paired t-test).
En face immunostaining of the lumen of cuffed arteries revealed that CD68-positive cells accumulated at the downstream region but not at the upstream or cuffed region (Figure 6A). There was increased FEDAA1106 binding in regions containing increased CD68-positive cells (compare Figure 4 to Figure 6A). Moreover, costaining studies revealed that TSPO was expressed by macrophages in modified arteries (Figure 6B). Thus, we conclude that 18F-FEDAA1106 PET can be used to discriminate between inflamed and noninflamed regions in experimental arteries.
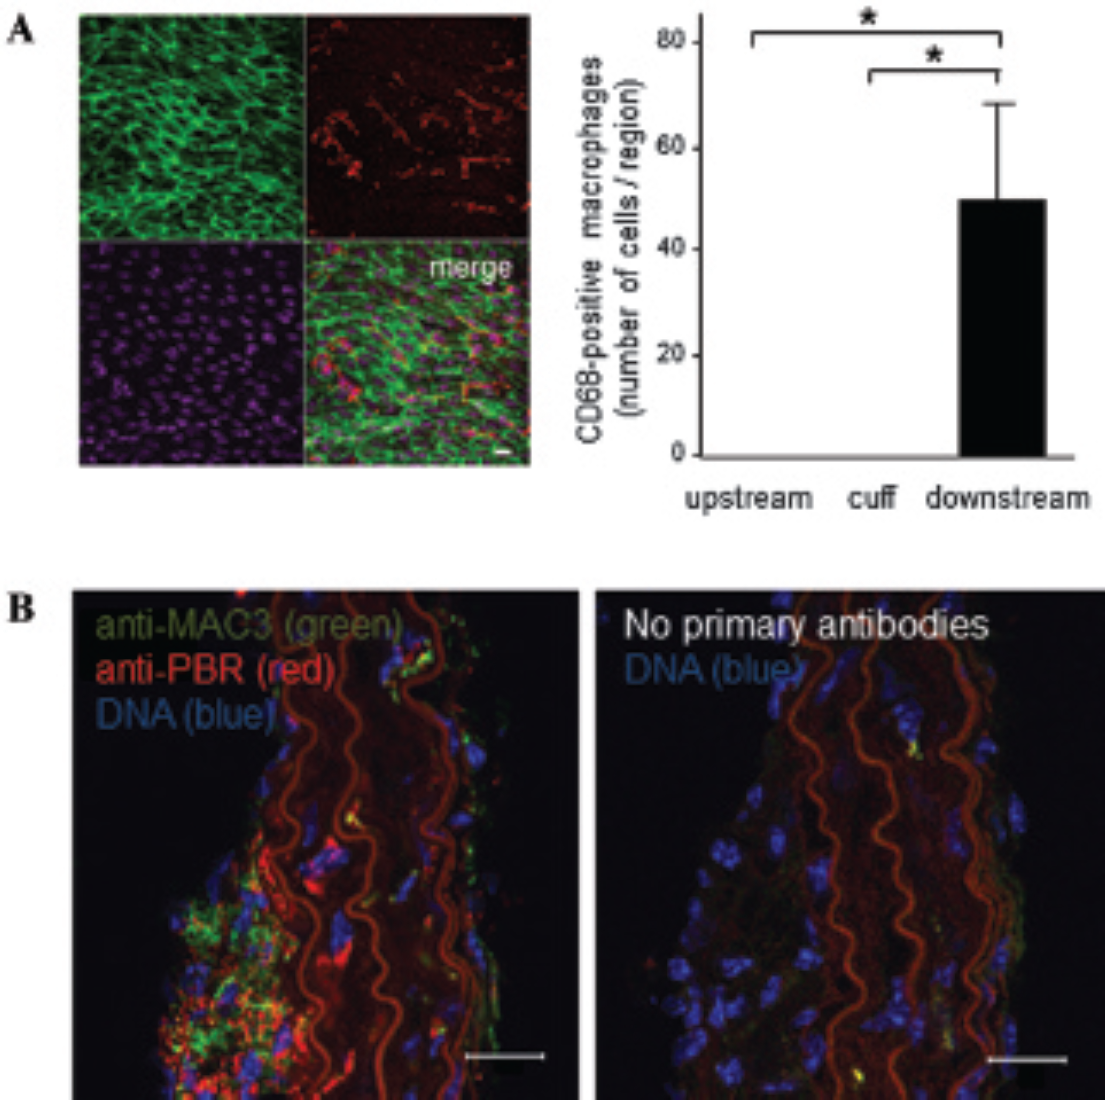
TSPO expression corresponded with regions of macrophage enrichment in cuffed arteries. A, The right carotid arteries of mice (C57BL/6) were modified using a constrictive cuff. The accumulation of CD68-positive cells (red) in cuffed arteries was assessed by en face staining of the lumen at the cuff and at downstream and upstream regions. Endothelial cells were identified by costaining with anti-CD31 antibodies conjugated to FITC (green). Cell nuclei were identified using ToPro3 (purple). Representative images are shown. Data were pooled from three independent experiments, and mean numbers of macrophages (± standard deviations) are shown. B, The right carotid arteries of mice (ApoE−/−) were modified using a constrictive cuff. After 6 weeks, cross sections of modified carotid arteries were stained using antibodies that recognize macrophages (MAC3; green) and TSPO (red) and fluorescent secondary antibodies (leftpanel). Adjacent sections were processed in the absence of primary antibodies as a control for specific staining (right panel). The data shown are representative of those generated from four mice. Scale bars indicate 20 μm.
FDG Uptake at Inflamed and Noninflamed Sites
PET imaging revealed that FDG uptake was enhanced in the right compared to the left carotid artery (Figure 7A; 1.29 ± 0.28 vs 0.71 ± 0.10, respectively, p < .05). Analysis of particular regions of interest in the right carotid artery revealed that FDG uptake was elevated at the downstream region compared to adjacent regions (Figure 7, B to D; 1.53 6 0.38 downstream vs 1.29 ± 0.32* [cuff] and 1.04 ± 0.24* [upstream]; *p < .05). However, the 18F-FEDAA1106 signal pattern discriminated between the inflamed (downstream) region and noninflamed (cuff) regions more effectively than FDG uptake (compare Figure 4 and Figure 7).
18F-FDG uptake was enhanced at multiple regions of cuffed arteries. 18F-FDG uptake was studied in the right (cuffed) or the left carotid artery (unmanipulated). PET/CT/CT angiography images were coregistered, and representative composite images are shown in coronal (A) or sagittal (B, C) orientation. D, 18F-FDG uptake was quantified at the cuff and downstream and upstream regions in the right carotid artery and at equivalent positions in the contralateral carotid artery and expressed as SUVs. Data from five animals were pooled, and mean SUVs ± SEM are shown. Placement of the flow-altering, constrictive cuff induced an increase in FDG uptake at the cuff and at a downstream region. Scale bars indicate 1 cm.
Discussion
Murine models offer several advantages for studies of vascular inflammation, including the availability of transgenic/knockout animals, short generation time, and ease of manipulation and husbandry. However, the small size of mice presents significant challenges for molecular imaging studies. We previously attempted PET imaging to study the spatial distribution of vascular inflammation in murine arteries, a process that occurs preferentially at branches and bends that are exposed to disturbed flow. However, it was not possible to distinguish between specific sites (eg, aortic arch, ostia of carotid arteries) because they were closer than the spatial resolution of PET imaging (approximately 1 mm; data not shown). Because of these considerations, we developed a novel imaging system that coupled PET imaging to surgical application of a constrictive cuff in murine carotid arteries. 2 The cuff generated a site of disturbed flow-induced inflammation (downstream from the cuff) that could be imaged by PET as it was spatially separated from adjacent inflammation-prone regions.
Here we used the constrictive cuff model to compare binding of a TSPO tracer to uptake of FDG for imaging of vascular inflammation. The study required a multimodality approach so that the spatial localization of PET signals could be coregistered with CT angiography data. CT angiography also suggested that contrast agent was located outside the cuff in experimental arteries, and we hypothesize that leakage of cuffed arteries is a consequence of altered blood flow. Our observation has important implications for the interpretation of PET data as the bioavailability of the tracer is likely to be altered in cuffed compared to unmanipulated arteries. For this reason, comparison of PET signals between distinct regions of interest within the cuffed artery may have greater validity than comparing signals between cuffed and control vessels.
The most extensively studied TSPO tracer is 11C- PK11195.15,18 In vitro studies demonstrated that PK11195 binds to sites of inflammation in human carotid artery plaques.16,17 This probe has also been used successfully to image vascular inflammation in patients with large vessel vasculitis.12,18 However, Laitinen and colleagues demonstrated that PK11195 interacted with both healthy and diseased arteries in hypercholesterolemic mice, possibly due to nonspecific binding of PK11195 leading to a poor signal to background ratio. 15 This observation has been supported by other studies that revealed high uptake of PK11195 in healthy, noninflamed tissues. 21 The quantification of TSPO probes in general has proved to be very challenging because of the small amount of specific binding but also the relatively nonnegligible specific binding to blood vessels.22–24 Because of these concerns, alternative TSPO probes have now been developed.17,25,26 These include N-(2,5-dimethoxybenzyl)-N- (5-fluoro-2-phenoxyphenyl)acetamide (DAA1106), which colocalized with CD68-positive macrophages in atherosclerotic plaques more specifically than PK11195. 17
Here we studied a novel TSPO probe, 18F-FEDAA1106, using a murine model. In vivo biodistribution analyses of multiple tissues demonstrated that this probe was distributed rapidly immediately following injection. Uptake of 18F-FEDAA1106 progressively decreased in lung and brain, and the probe was eliminated via the kidneys and liver. These data informed subsequent analyses of 18F- FEDAA1106 uptake in murine carotid arteries; of particular note, signals in the carotid arteries were quantified at late frames when soluble levels of probe were low. Our observations were broadly similar to an in vivo biodistribution study of 18F-FEDAA1106 in humans, which demonstrated decline of probe uptake from lung and brain. 27 This study also revealed an absence of 18F- FEDAA1106 signal from carotid arteries and a relatively low signal in the heart 1.7 hours after intravenous injection. Thus, it is feasible that clinical protocols could be developed to image 18F-FEDAA1106 uptake in carotid or coronary arteries.
To determine whether 18F-FEDAA1106 can be used to detect vascular inflammation, we compared probe binding in three regions of cuffed murine carotid arteries in vivo: the upstream region (noninflamed), the cuff (also noninflamed), and the downstream region (inflamed). 18F-FEDAA1106 binding at the downstream site was significantly higher than binding at the nonupstream or cuffed regions, indicating that binding was associated with vascular inflammation. Thus, the noninflamed portions of the cuffed artery served as internal controls for nonspecific binding not associated with inflammation. Kinetic analyses of the 18F-FEDAA1106 PET data also demonstrated that the downstream region had higher K1 values compared to other tissues but similar k2 values, suggesting an increase in binding at this site. It is likely that the signal at the downstream site was generated by tissue-bound 18F-FEDAA1106 and that the contribution of soluble/pooled probe was minimal because (1) PET signals in the carotid arteries were quantified at late frames when soluble levels of probe were low; (2) immunostaining demonstrated that TSPO was expressed by macrophages in cuffed arteries; and (3) 18F-FEDAA1106 binding in the heart competed with unlabeled FEDAA and could be displaced by unlabeled FEDAA1106, likely indicating specificity. Collectively, these data suggest that elevated FEDAA1106 binding in inflamed arteries is mediated by enhanced interaction with TSPO expressed by macrophages.
Although FDG uptake was most pronounced at the inflamed region, it was also detected at adjacent noninflamed sites, suggesting that the increase in FDG uptake was not related exclusively to the presence of macrophages but possibly due to the presence of fibrotic tissue that developed around the cuff. 2 We conclude that 18F- FEDAA1106 binding has greater specificity for vascular inflammation compared to FDG uptake because it corresponded more tightly with the spatial localization of vascular inflammation in experimental arteries.
Our study relied on alteration of flow in the carotid artery to establish mechanical conditions that were permissive for vascular inflammation. This reductionist approach allowed us to assess the potential utility of 18F- FEDAA1106 for PET imaging of vascular inflammation in inflamed arteries in the absence of lipid deposition or the build-up of other atheromatous materials. Further studies are now required to monitor 18F-FEDAA1106 binding during plaque development, to assess the influence of plaque materials (eg, lipid, calcium, cell debris) on 18F- FEDAA1106 uptake, and to assess whether 18F-FEDAA1106 can be used to monitor inflammatory load in atherosclerotic plaques in vivo.
Footnotes
Acknowledgments
We acknowledge Dr. Mohammed Hankir for technical assistance in subject preparation and scanning.
Financial disclosure of authors: This study was funded by the British Heart Foundation and through a grant from the Swiss National Science Foundation (310030_143343/1 to B.R.K.).
Financial disclosure of reviewers: None reported.