
Abstract
In this study, we evaluated the partial volume effect (PVE) of 2-deoxy-2-[18F]fluoro-D-glucose (18F-FDG) tracer accumulation in the bladder on the positron emission tomographic (PET) image quantification in mice and rats suffering from inflammatory bowel disease. To improve the accuracy, we implemented continuous bladder flushing procedures. Female mice and rats were scanned using microPET/computed tomography (CT) at baseline and after induction of acute colitis by injecting 2,4,6-trinitrobenzene sulfonic acid (TNBS) intrarectally. During the scans, the bladder was continuously flushed in one group, whereas in the other group, no bladder flushing was performed. As a means of in vivo and ex vivo validation of the inflammation, animals also underwent colonoscopy and were sacrificed for gamma counting (subpopulation) and to score the colonic damage both micro- and macroscopically as well as biochemically. At baseline, the microPET signal in the colon of both mice and rats was significantly higher in the nonflushed group compared to the flushed group, caused by the PVE of tracer activity in the bladder. Hence, the colonoscopy and postmortem analyses showed no significant differences at baseline between the flushed and nonflushed animals. TNBS induced significant colonic inflammation, as revealed by colonoscopic and postmortem scores, which was not detected by microPET in the mice without bladder flushing, again because of spillover of bladder activity in the colonic area. MicroPET in bladder-flushed animals did reveal a significant increase in 18F-FDG uptake. Correlations between microPET and colonoscopy, macroscopy, microscopy, and myeloperoxidase yielded higher Spearman rho values in mice with continuously flushed bladders during imaging. Comparable, although somewhat less pronounced, results were shown in the rat. Continuous bladder flushing reduced image artifacts and is mandatory for accurate image quantification in the pelvic region for both mice and rats. We designed and validated experimental protocols to facilitate such.
IN MANY MOLECULAR IMAGING TECHNIQUES, such as single-photon emission computed tomography (SPECT), positron emission tomography (PET), computed tomography (CT), and magnetic resonance imaging (MRI), accumulation of the imaging probe or contrast agent in the bladder can cause image artifacts1,2 and can hamper the quantification of the tracer in a nearby organ or region of interest (ROI)2,3 due to the partial volume effect (PVE) 4 in a system with a limited spatial resolution, causing spillout activity in that ROI. As a consequence, these artifacts can lead to false positives when the signal intensity in nearby regions is artifically increased or to false negatives when the signal of the bladder hides true lesions. This is especially important in pathologies such as pelvic bone tumors; inflammatory bowel disease; colorectal malignancies; and bladder, prostate, and ovarian cancer. One could make use of imaging probes that are not excreted in the urine, such as the radiotracers 11C-choline and 11C-methionine used in PET cancer imaging. 5 However, these tracers have a lower availability and do not cover all indications. Making use of better image reconstruction algorithms can reduce artifacts. 6 Ordered subset expectation maximization (OSEM) iterative reconstruction performs significantly better than filtered backprojection. OSEM iterative reconstruction can be optimized by selecting the best number of iterations and subsets to further reduce the artifacts. 7 Some digital filters can be used to correct the image artifacts after reconstruction 8 but are not always satisfactory. These data from the literature suggest that it is recommended to avoid accumulation of the imaging probe in the bladder. In humans, some techniques are exploited to overcome this accumulation. These include elective voiding,9,10 catheterization, continuous bladder flushing,11–13 and, as used in daily clinical practice, forced diuresis with, for example, furosemide (Lasix).9,14 In small animals, the accumulation of tracer or contrast agent in the bladder is an even greater problem than in humans as the metabolism and excretion rates in rodents are much faster (rapid refilling of the bladder) and the aforementioned techniques are much more challenging due to the extremely small dimensions of the urinary tract. In some small-animal pelvic imaging studies, the bladder is manually expressed to minimize its signal. 15 Haney and colleagues showed in 2006 that female mice catheterization is mandatory and possible in electron paramagnetic resonance imaging. 16 Our group further refined this technique by designing a dedicated small-animal gynecologic frame to optimize the catheter insertion, scanning, and collection of the efflux. We applied such an optimized protocol on a larger scale in two mice models for colitis in 2010.17,18 Meanwhile, an oncologic urology group published an article describing catheterization of female mice and rats as an essential translational tool. 19
In this article, for the first time, we accurately quantify the exact influence of 2-deoxy-2-[18F]fluoro-D-glucose (18F-FDG) bladder accumulation on a pathologic signal, here exemplified in a model of inflammatory bowel disease. Using microPET/CT, inflammation in the colon of female OF1 mice and Sprague Dawley rats after induction of colitis was quantified with and without continuous flushing of the bladder. To establish bladder flushing in microPET as state of the art and to provide a high level of confidence, the 18F-FDG uptake was tested with phantom experiments and correlated with gamma counting in healthy naive animals and with different “gold standards” for scoring gastrointestinal inflammation, such as colonoscopy, macroscopy, microscopy, and myeloperoxidase (MPO) activity in colitis-diseased animals.
Materials and Methods
We first proved the concept by studying the influence of bladder accumulation on quantification in molecular imaging by (1) a microPET phantom experiment artificially simulating colon and bladder and (2) by correlation of microPET in healthy naive animals versus its gold standard, gamma counting. Following these two a priori feasibility studies, we evaluated the influence of bladder activity in animals induced with colitis.
Phantom, Animals, and Model Induction
For the phantom study, a mouse- and rat-sized phantom, including both a fabricated colon and a bladder in a warm background, was constructed. The mouse body and its colon were represented by, respectively, a 20 mL syringe and a distally inserted 1 mL syringe shortened to 4.5 cm (Figure 1). To realistically represent the FDG activity only in the colonic wall and not in the lumen, the shortened 1 mL syringe was on its turn inserted with a solid 4 mm diameter polymethyl methacrylate cylinder in the center and rubber sealed. The rat body and colon were represented by, respectively, a 100 mL syringe and a distally inserted 3 mL syringe shortened to 6.5 cm (see Figure 1), inserted with a solid 7 mm diameter polymethyl methacrylate cylinder in the center and rubber sealed. The bladders were custom shaped in latex: 0.5 mL and 1 mL for mouse and rat, respectively.

A, Three-dimensional (3D) volume rendering of the mouse phantom simulating the colon and bladder and two-dimensional (2D) PET/CT overlays with no tracer accumulation in the bladder (top) and with tracer accumulation in the bladder (bottom). Cold regions outside volumes of interest (VOI) are rubber sealings of shortened inserts. B, 3D volume rendering of the rat phantom simulating the colon and bladder and 2D PET/CT overlays with no tracer accumulation in the bladder (top) and with tracer accumulation in the bladder (bottom). Cold regions outside VOI are rubber sealings of shortened inserts.
For the in vivo studies, female OF1 mice (n = 36) and female Sprague Dawley rats (n = 36) were obtained from Charles River (Brussels, Belgium). All mice (24-26 g) were 5 to 6 weeks of age, whereas the rats (200–225 g) were 7 to 8 weeks of age at the initiation of the experiments. Acute colitis was induced in mice and rats using 2,4,6- trinitrobenzene sulfonic acid (TNBS) as follows: after an overnight fast, TNBS (100 μL of 3 mg TNBS in 30% ethanol for mice 20 and 500 μL of 7.5 mg TNBS in 50% ethanol for rats 21 ) was administered intrarectally through a flexible catheter. TNBS dissolved in ethanol induces severe colonic damage and acute inflammation. The damage is associated with high MPO activity, mainly as a reflection of neutrophilic infiltration into the damaged tissue 22 and caustic injury to the colonic epithelium and interstitium as measured by the rapid and dramatic increase in mucosal permeability. 23 The TNBS model of colitis is mediated by T helper type 1 cells, 24 and it was previously shown that mucosal FDG uptake was specifically correlated with GLUT-1 (glucose transporter) expression by CD4+ T cells. 15 After TNBS injection, animals were held upside down in a 45° position for 30 seconds to prevent leakage of the TNBS solution and were replaced in their individually ventilated cages with free access to food and water under environmentally controlled conditions (12-hour normal light/dark cycles, 20-23°C and 50% relative humidity). All animal procedures were performed in accordance with the European Ethics Committee (decree 86/609/CEE), and the study protocol was approved by the local Animal Experimental Ethical Committee of the University of Antwerp, Belgium (2013-2014).
Protocols
MicroPET/CT Scanning
Animals were fasted overnight for 15 hours, after which they were anesthetized with isoflurane (5% for induction and 2% for maintenance) and received an intravenous injection of 18.5 MBq (mouse) or 37 MBq (rat) 18F-FDG 30 minutes before the microPET/CT scan (Siemens Inveon, Knoxville, TN). These Inveon systems have a typical reconstructed spatial image resolution of 1.4 mm in the center of the field of view (FOV) leading to PVE. During the scan, the animals were kept at 37°C to reduce the tracer uptake in brown adipose tissue. To visualize the colon on the CT scan, the animals were rectally injected with Gastrografin (0.5 mL for mouse and 1 mL for rat) a few seconds before the acquisition. The CT scan was acquired in 4X binning mode with a 50 μm spot size at 80 kVp and 500 mA in 120 projections, followed by a static PET scan of 10 minutes, during which in one group, the animal's bladder was continuously flushed, whereas in the other group, no bladder flushing was performed. The CT acquisitions were analytically reconstructed using the Feldkamp algorithm to a 352 × 352 × 606 matrix with 0.223 μm voxels. The microPET data were reconstructed using 2 iterations with 16 subsets of the three-dimensional OSEM and 18 maximum a posteriori (MAP) iterations, including scatter and attenuation correction, resulting in a 128 × 128 × 159 matrix of 0.77 × 0.77 × 0.79 mm voxels.
Based on the size of the scanner's FOV, volumes of interest (VOI) for the distal part of the colon and the brain (mouse) or liver (rat) as a reference region were outlined on the CT images using PMOD 3.3 (PMOD Technologies, Zurich, Switzerland). The ratios of the mean voxel counts of the PET in the VOI versus the reference region were calculated.
Bladder Flushing
In those groups in which the bladder was continuously flushed, a double-lumen urethral catheter was used consisting of a polyethylene tube (PE10; ID 0.28 mm, OD 0.61 mm) inside a catheter (20 G Introcan Safety IV Catheter, B. Braun Medical Inc., Melsungen, Germany) with a silicone tubing extension (ID 1.01 mm, OD 2.16 mm, VWR, Geldenaaksebaan, Belgium). This PE10 tubing was allowed to extend 1.5 cm beyond the catheter tip (Figure 2, B and C). To insert the catheter, the animal was put in a gynecologic position. The legs were clamped and the back was lifted so that the pelvis was in a tilted position to gain better access to the bladder. For mice, a dedicated in house-designed frame (Figure 2, A to C) was used to optimize catheter insertion, scanning, and collection of the efflux. Water was continuously injected into the PE10 tubing at a rate of 15 mL/h (mouse) or 10 mL/h (rat) using a clinical infusion pump (Fresenius, Bad Homburg, Germany) to rinse out the urine in the animal's bladder. Doing so, flushing water is introduced through the PE10 tubing into the bladder, after which the bladder effluent exits through the intravenous catheter and the silicone tubing, allowing it to drip into a collection reservoir (see Figure 2).
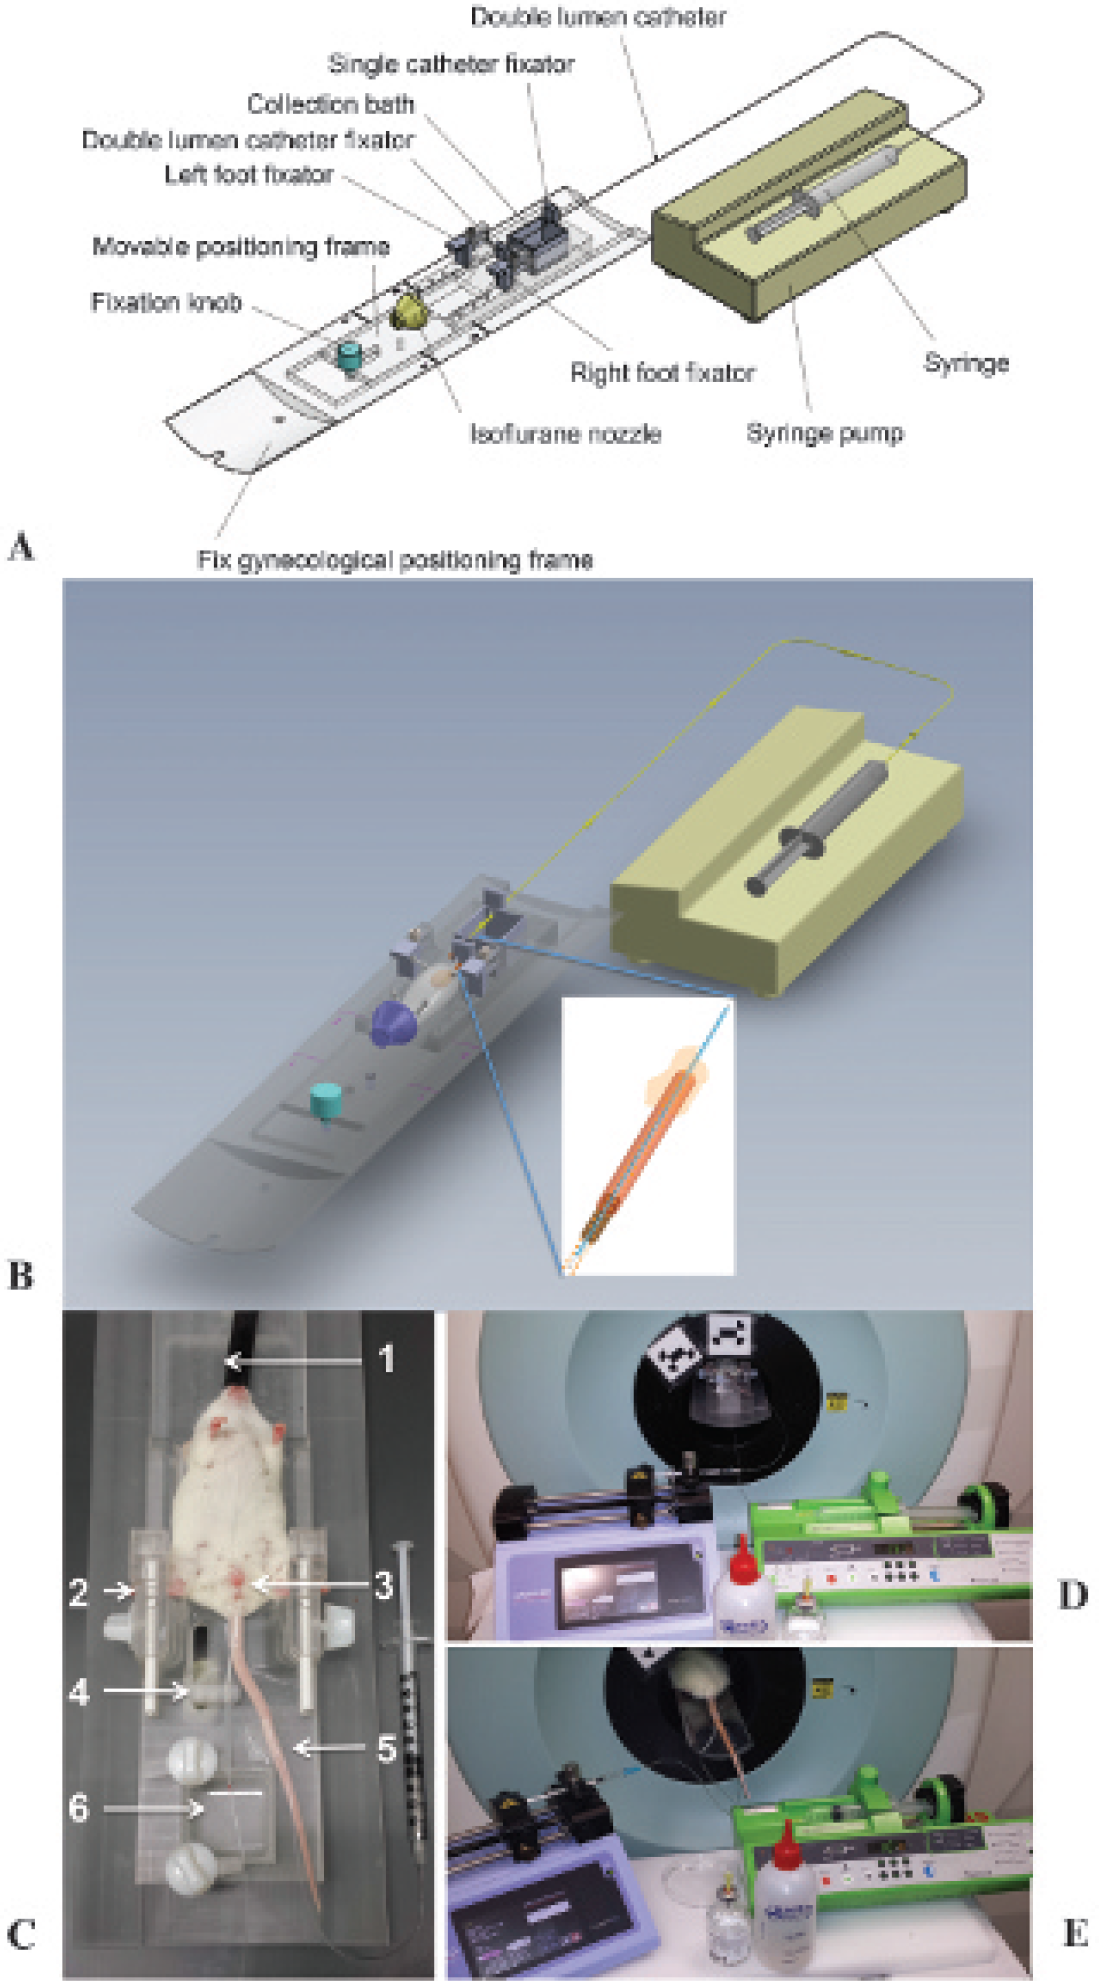
A and B, Schematic drawings of the dedicated small-animal gynecologic frame. C, Photograph of the bed frame used for optimal catheter insertion, scanning, and collecting the bladder efflux. The mouse is positioned in dorsal recumbence. (1) Inlet for the isoflurane anesthesia; (2) foot clamps; (3) double-lumen catheter inserted through the external urethral ostium into the bladder; (4) catheter guidance; (5) catheter for 18F-FDG injection; and (6) collection vessel for the bladder efflux. D, Setup of the bladder-clearing procedure during the scanning of the mouse. At the right, we see the infusion pump for continuous flushing of the bladder, and at the left, we see the injection pump. At the front, we see the lubricant gel used for catheter insertion and water for injection used to flush the bladder. E, Setup of the bladder-clearing procedure during the scanning of the rat. Here the bladder efflux is collected in a Petri dish.
Proof of Concept
First, for the phantom experiment, the activity of the background in the mouse phantom was 88 kBq/cc (1,592 kBq in 18 mL) and the colonic wall activity was 783 kBq/cc (64 kBq in 0.08 mL), resulting in a ratio of 9:1. When averaged over the colon as a whole (0.21 mL), the ground truth value for the activity is 304 kBq/cc. In the rat phantom, the background activity was 37 kBq/cc (3,236 kBq in 87 mL) and the colonic wall activity was 330 kBq/cc (382 kBq in 1.16 mL), resulting in a ratio of 9:1. When averaged over the colon as a whole (3.53 mL), the ground truth value for the activity is 108 kBq/cc. The bladders were filled with a solution of 13.2 MBq/cc 18F-FDG to mimic radiotracer accumulation as extrapolated from our experimental in vivo values for these pragmatic bladder volumes, and phantoms were scanned with a microPET/CT protocol similar to that outlined above.
Second, for the gamma-counting experiment, both healthy naive mice (n = 12) and rats (n = 12) were divided into two groups: one group (n = 6 per species) underwent continuous flushing of the bladder (see above) during the scanning procedure, whereas in the other group (n = 6 per species), no bladder flushing was performed. The animals underwent microPET/CT scanning, and afterward, their colon was dissected, weighed, and measured in a gamma counter (2480 WIZARD automatic gamma counter, PerkinElmer, Waltham, MA).
Quantification of Colitis
In the main study, both mice (n = 24) and rats (n = 24) were again divided into these two groups: with continuous flushing of the bladder (n = 12 per species) and without (n = 12 per species). All animals now received a baseline microPET/CT scan on day — 1 (Figure 3). TNBS colitis was induced on day 1, and a second microPET/CT scan was performed on day 3 (see Figure 3). On both scan days, small-animal colonoscopy was performed on all animals before initiating the microPET/CT scans. At the end of each scan day, four to six animals of each group were sacrificed for postmortem examination of the colon based on three parameters: a macroscopic and a microscopic inflammation score and the colonic MPO activity.

Top: Timeline of the study design. Bottom: Experimental protocol of the PET/CT scan.
Colonoscopic Procedure
Colonoscopy was performed to evaluate the extent of colitis, using a flexible Olympus URF type P5 ureteroscope (OD 3.0 mm, 1.8 mm working channel; Olympus Europa GmbH, Hamburg, Germany) for mice and a flexible Olympus GIF-N30 gastroscope (OD 5.2 mm, 2.0 mm working channel; Olympus Europa GmbH) for rats as previously described.18,21
After an overnight fast, animals were anesthetized with isoflurane and placed in a supine position. The anal sphincter and endoscope were lubricated with gel (RMS- Endoscopy, St. Martens-Lennik, Belgium) to facilitate insertion of the endoscope. The endoscope was carefully introduced through the anus and inserted into the colon as far as possible under endoscopic vision. The endoscope could be introduced approximately 4 cm proximal to the anal verge in mice and 10 cm proximal to the anal verge in rats. Occasionally, the colon was inflated with air for better visualization of the lumen, and any remaining feces were flushed out by injecting water through the working channel of the endoscope if necessary. While withdrawing the scope, disease-induced mucosal damage was assessed using our previously published scoring system 21 to quantify and determine the severity of colitis. The following parameters were included: the degree of inflammation (0–6 points), extent of disease (0–4 points for mice and 0–10 for rats), edema (0–1 point), stenosis (0–1 point), and bleeding (0–1 point). The cumulative score thus ranged from 0 (no signs of inflammation) to 13 in mice and 0 to 19 in rats (signs of severe inflammation). Each colonoscopic procedure required approximately 3 minutes. After the colonoscopic examination, the animals were returned to their cages to regain consciousness.
Macroscopic Inflammation Score
To score the colonic mucosal damage macroscopically, the animals were euthanized by exsanguination under anesthesia and their colons were removed. The colon was carefully opened along the mesenteric border and pinned out on a Petri dish filled with ice-cold Krebs-Ringer solution. The mucosal surface of the colon was inspected with a binocular (Zeiss Jena, Jena, Germany) to detect signs of inflammation. Dedicated macroscopic inflammation scores for mice and rats were used as previously described20,21 and as summarized in Table 1, leading to an accumulative score between 0 and 12 for mice and 0 and 10 for rats.
Macroscopic Scoring System for Acute TNBS Colitis in Mice and Rats

TNBS = 2,4,6-trinitrobenzene sulfonic acid.
Microscopic Inflammation Score
A full-thickness segment of 1 cm long was taken from the removed colon in a standardized way, approximately 3 cm proximal to the rectum. The colonic segment was fixed in 4% formaldehyde for 24 hours and embedded in paraffin, and thin sections (5 μm) were cut and stained with hematoxylin-eosin. Inflammation in both mice and rats was scored according to a previously published microscopic inflammation score.20,21 The following criteria were included in this scoring system: the degree of inflammatory infiltrate in the lamina propria (0–3 points), number of layers infiltrated (0–3 points), mucosal tissue damage (0–3 points), and mucosal edema (0–1 point). The cumulative score ranged from a minimum of 0 to a maximum of 10 for both species.
MPO Activity Assay
Colonic MPO activity, which is directly related to the number and the activity of myeloid cell infiltrates in the inflamed tissue, was assayed according to a previously published method to monitor the degree of inflammation. 20 In brief, a full-thickness tissue sample was harvested from the remaining colon in a standardized way. The colonic segment was blotted dry, weighed, and placed in a potassium phosphate buffer (pH 6.0) containing 0.5% hexadecyltrimethylammonium bromide at 5 g of tissue per 100 mL of buffer. The sample was placed on ice, minced, and homogenized for 30 seconds. The homogenate was subjected to two sonication and freeze-thaw cycles. The suspension was centrifuged at 15,000g for 15 minutes at 4°C. An aliquot (0.1 mL) of the supernatant was added to 2.9 mL of o-dianisidine solution (16.7 mg of o-dianisidine in 1 mL of methyl alcohol, 98 mL of 50 mM potassium phosphate buffer, pH 6.0, and 1 mL of 0.05% H2O2 solution as a substrate for the MPO enzyme). The change in absorbance was read at 460 nm with a Spectronic Genesys 5 spectrophotometer (Milton Roy, Rochester, NY). One unit of MPO activity was defined as the quantity able to convert 1 mmol of H2O2 to H2O per minute at 25°C, and the activity was expressed in units per gram of tissue.
Statistical Analysis
A two-way analysis of variance (ANOVA) was performed to compare the groups without and with bladder flushing (factor 1 flushing), to evaluate the difference between baseline and day 3 (factor 2 TNBS inflammation), and to investigate a possible interaction between both factors. Appropriate post hoc testing was performed using either a one-way ANOVA or a Student t-test. Correlations between the PET values and gamma counting, colonoscopy, macroscopy, microscopy, and MPO activity were measured with the nonparametric Spearman rho test. For all statistical tests, significance was defined as p < 0.05. Data were analyzed using GraphPad Prism 6.0b (GraphPad Software Inc, San Diego, CA) and presented as mean ± standard error of the mean (SEM).
Results
Proof-of-Concept Studies
First, for the phantom study, PET image quantification in a CT-based VOI of the mouse colon as a whole resulted in an average activity concentration of 295 kBq/cc (97% recovery of the original 304 kBq/cc) when no bladder activity was present. However, when the bladder was filled with radioactive FDG, the reconstructed PET value was 474 kBq/cc, indicating a 61% erroneous overestimation, due to not flushing the bladder. Image quantification of the rat colon resulted in an average activity concentration of 107 kBq/cc (99% recovery of the original 108 kBq/cc) and 148 kBq/cc, respectively, without and with radiotracer in the bladder, indicating an 38% overestimation when the bladder is filled.
Second, in the gamma-counting, experiment, the Spearman rho correlations between microPET and its gold standard gamma counting were only -0.60 and 0.08 for mice and rats without their bladder flushed and increased to 0.94 (p < .05) and 0.89 (p < .05), respectively, when bladder flushing was performed during the microPET scanning.
Longitudinal Quantification of the MicroPET/CT Signal
Mice
At baseline, the average count ratio for colon/brain was 0.81 ± 0.09 for mice imaged without flushing, whereas it was only 0.55 ± 0.02 if the bladder was flushed (Figure 4). Two-way ANOVA therefore showed a significant effect of the factor flushing (p = .0044) (Figure 5). Two days after TNBS induction, the ratios increased due to the fulminant inflammation to, respectively, 1.01 ± 0.07 and 0.76 ± 0.08, resulting in a significant effect of the second factor inflammation (p = .0065) without a significant interaction between both factors (p = 0.9735). Post hoc analysis, however, showed that the signal due to inflammation was significantly increased only in the group with bladder flushing (p = .0008). On both days, the signal was significantly different between the groups (p = .0093 on baseline and p = .0479 on day 3).

MicroPET/CT, colonoscopic, and microscopic images of mice without and with bladder flushing scanned on baseline and day 3. MicroPET/CT images: The colon is delineated with Gastrografin. White arrows on the microPET/CT images depict the bladder tracer accumulation when no bladder flushing was performed. On day 3, we see higher 18F-FDG uptake in the colon on the PET images due to TNBS-induced inflammation. Colonoscopic images: At baseline, mice show a normal vascular pattern and a smooth transparent mucosa. At day 3, the colon is occupied by severe longitudinal extended ulcerations and is characterized by a reduced transparency and bleeding mucosa (white arrow). Microscopic images (hematoxylin-eosin stains, × 10 original magnification): (•) mucosa, (*) submucosa, and (Δ) muscle layer. At baseline, mice show normal colon morphology. At day 3, the tissues are characterized by edema, mucosal damage, and transmural infiltration of inflammatory cells.
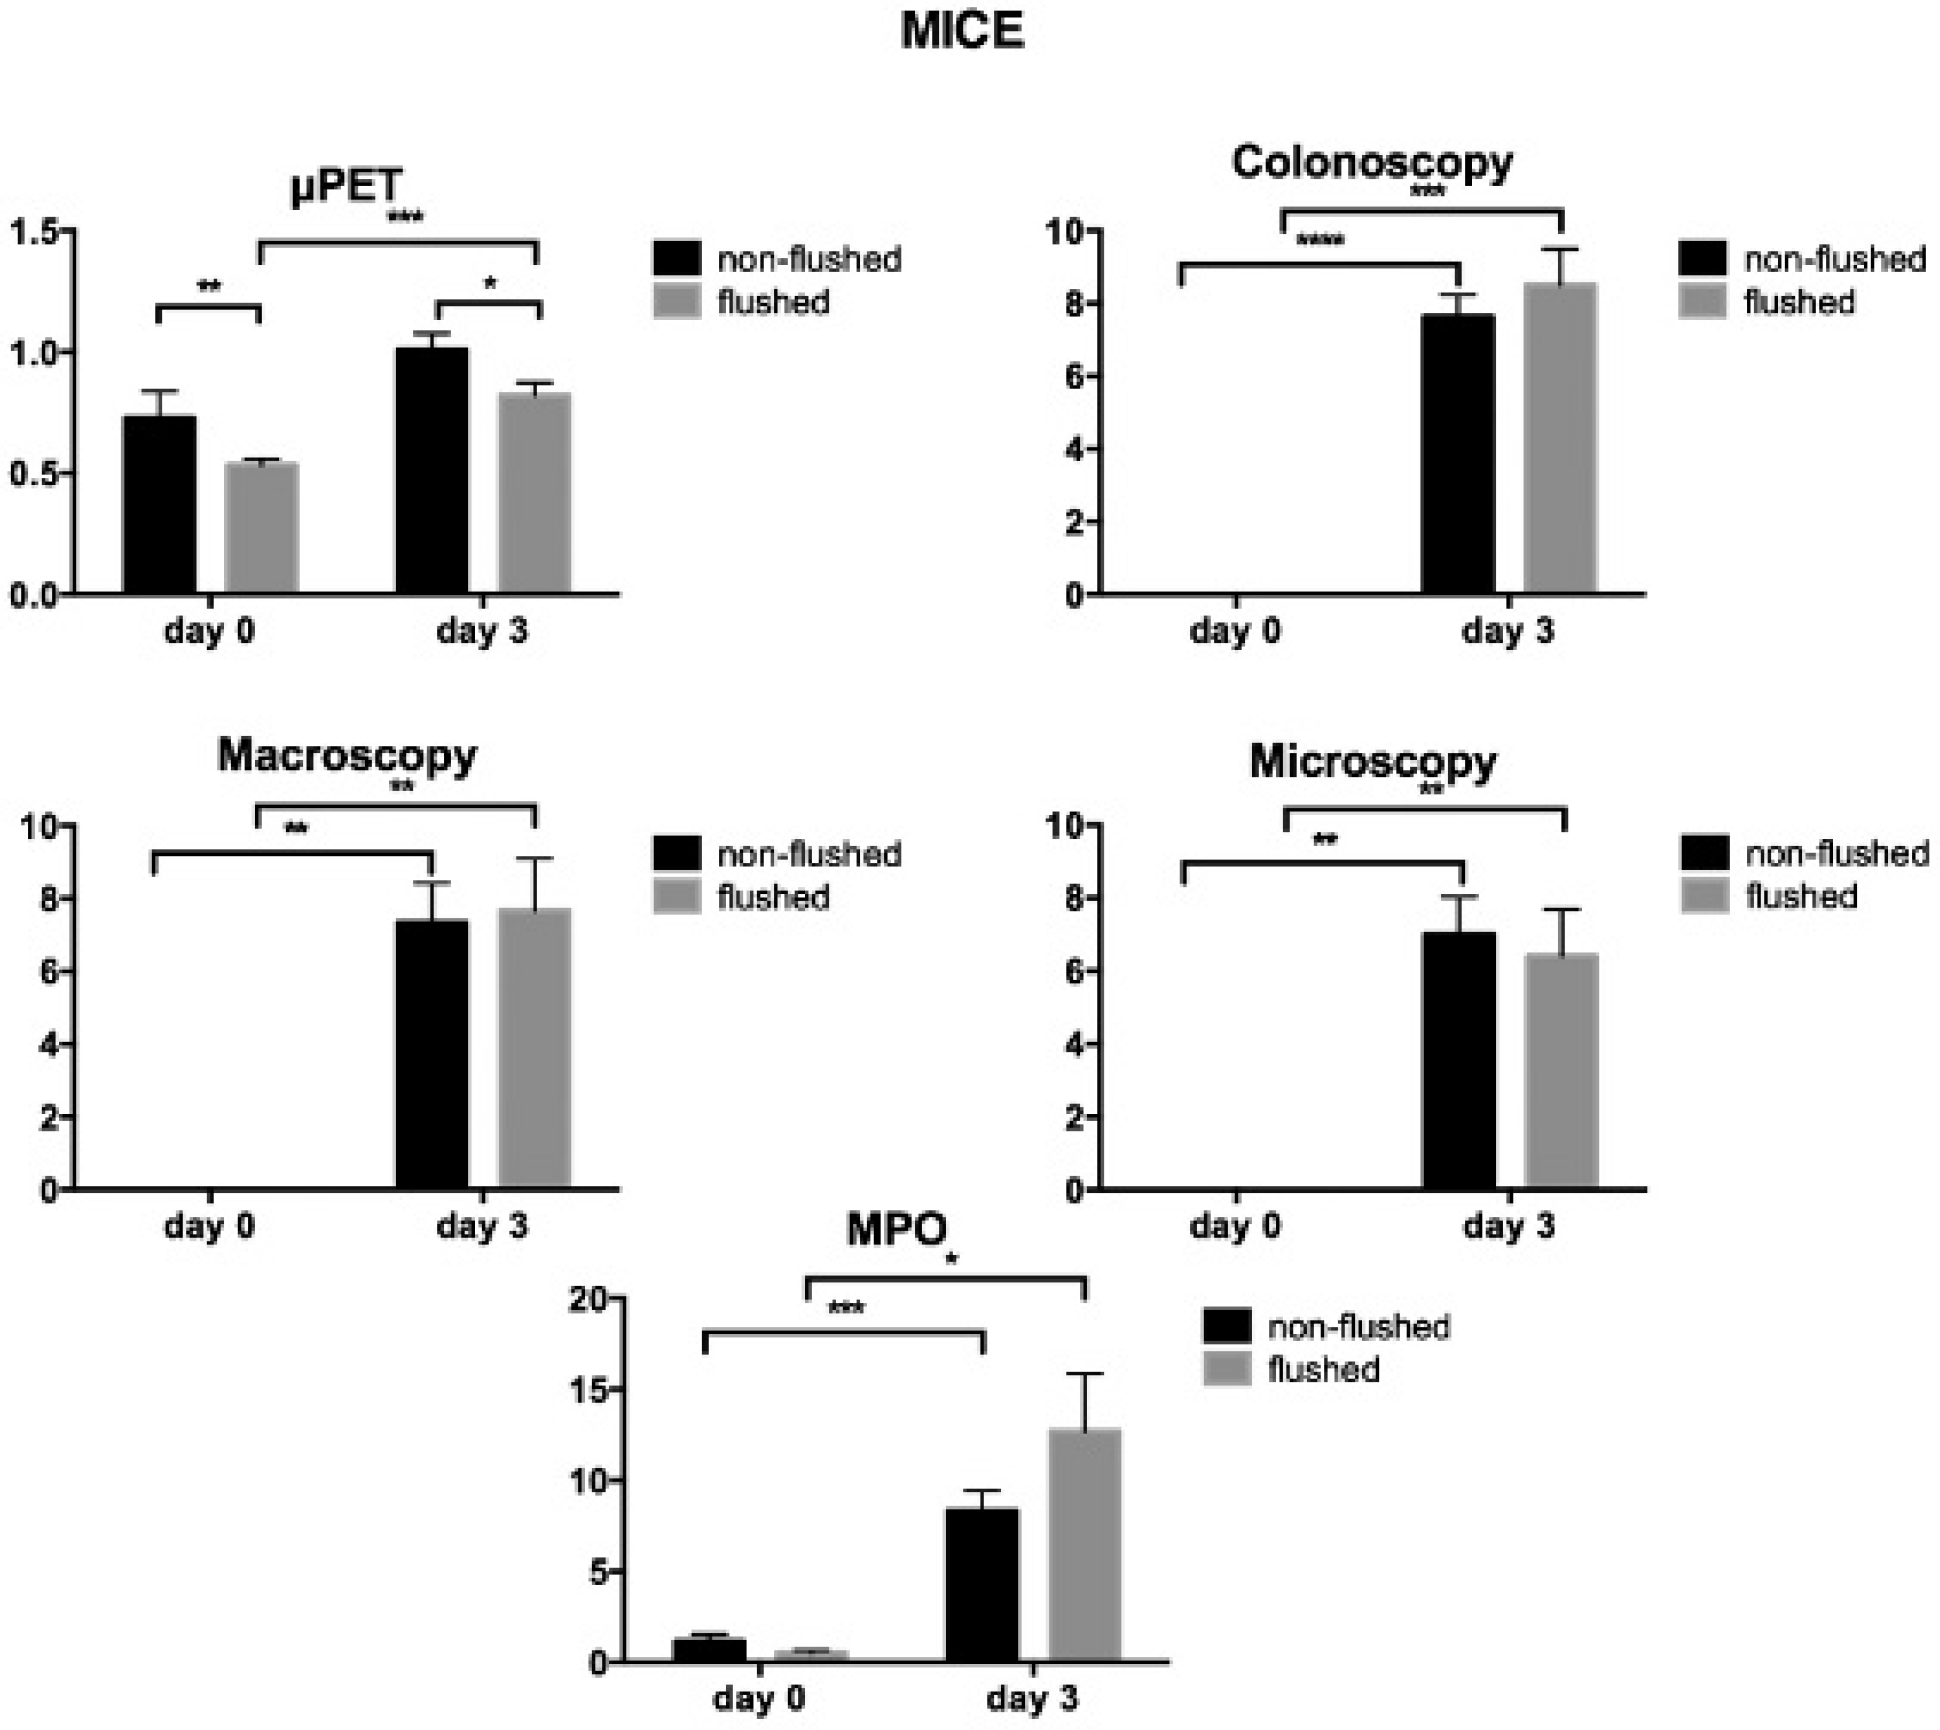
Effect of TNBS colitis in nonflushed and flushed mice on microPET, colonoscopy, macroscopy, microscopy, and MPO scores. Data are represented as mean ± SEM (*p < .05; **p < .01; ***p < .001; ****p < .0001).
Rats
For rats scanned at baseline, the count ratio was 1.22 ± 0.16 and 0.59 ± 0.04, respectively, for the groups without and with bladder flushing (Figure 6). Two-way ANOVA showed a significant effect of the factor flushing (p = .0007). Two days after TNBS induction, the ratios increased to 2.11 ± 0.38 and 0.82 ± 0.03, respectively, resulting in a significant effect of the second factor inflammation (p = .0289) without a significant interaction between both factors (p = .2428). Post hoc analysis showed a significant increase due to inflammation for the nonflushed group (p = .0174) and a highly significant increase for the flushed group (p = .0013). On both days, the signal was significantly different between the groups (p = .0029 on baseline and p = .0208 on day 3) (Figure 7). Three flushed rats did not survive the combination of the flushing procedure and colitis, leaving nine rats in the analysis.

MicroPET/CT, colonoscopic, and microscopic images of rats without and with bladder flushing scanned on baseline and day 3. MicroPET/CT images: The colon is delineated with Gastrografin. White arrows on the microPET/CT images depict the bladder tracer accumulation when no bladder flushing was performed. On day 3, we see higher 18F-FDG uptake in the colon on the PET images due to TNBS-induced inflammation. Colonoscopic images: Baseline animals show a normal vascular pattern and transparent mucosa. At day 3, the multiple colonic ulcerations with longitudinal extension over several centimeters and bleeding mucosa (white arrow) are present. Microscopic images (hematoxylin-eosin stains, X10 original magnification): (•) mucosa, (*) submucosa, and (Δ) muscle layer. At baseline, rats show no signs of inflammation in the sections. At day 3, severe colonic inflammation is developed characterized by destruction of the mucosal architecture and a dense transmural infiltrate.

Effect of TNBS colitis in nonflushed and flushed rats on microPET, colonoscopy, macroscopy, microscopy, and MPO scores. Data are represented as mean ± SEM (*p < .05; **p < .01; ***p < .001; ****p < .0001).
Colonoscopy
Mice
At baseline, all mice from the bladder-flushed group and from the nonflushed group showed a thin, translucent colonic wall characterized by a smooth and shiny mucosa and normal blood vessel architecture (see Figure 4), resulting in a colonoscopic score of 0. Two days after TNBS injection, all mice developed acute colorectal mucosal inflammation, characterized by severe ulceration, edema, and stenosis (see Figure 4). Consequently, the average colonoscopic scores increased to 7.63 ± 0.60 and 8.50 ± 0.99, respectively, 2 days after TNBS induction for the group without and with bladder flushing. Two-way ANOVA showed no significant effect of the factor flushing (p = .4522) and a significant effect of inflammation (p < .0001) without an interaction between the factors (p = .4522). With a p value of .5301, there was no significant difference between the flushed and nonflushed groups (see Figure 5). The increase due to inflammation was highly significant for both groups (p < .0001 for the nonflushed group and p = .0001 for the flushed group).
Rats
The colonic appearance at baseline was normal on endoscopy in both the nonflushed and flushed groups (score 0). The endoscopic picture was characterized by a pink, shiny mucosa with translucency of blood vessels, as shown in Figure 6. Two days after TNBS induction, multiple ulcerations extending longitudinally over several centimeters of the distal gut were present in all rats (see Figure 6).
The colonoscopic score was comparable for nonflushed (6.00 ± 0.82) and flushed (8.25 ± 0.85) groups. Two-way ANOVA showed no significant effect of the factor flushing (p = .1318) and a significant effect of inflammation (p < .0001) without an interaction between the factors (p = .1318). With a p value of .1032, there was no significant difference between the flushed and nonflushed groups (see Figure 7). The increase due to inflammation was highly significant in both groups (p = .0002 in the nonflushed group and p = .0024 in the flushed group).
Postmortem Analysis: MPO, Microscopy, and Macroscopy
Mice
At baseline, mice from both groups did not show macroscopic or microscopic signs of colonic damage (see Figure 4), resulting in scores of 0. This was also confirmed by low MPO activity in both groups (1.15 ± 0.39 for bladder nonflushed vs 0.51 ± 0.15 for bladder flushed). This MPO difference between the groups at baseline was not significant. Two days after TNBS injection (day 3), the colons of both groups were macroscopically characterized by ulcerations, colonic wall thickening, and mucosal edema, resulting in macroscopic scores of 7.33 ± 1.09 and 8.0 ± 1.70, respectively, for the group without and the group with bladder flushing. Two-way ANOVA showed no significant effect of the factor flushing (p = .8546) and a significant effect of inflammation (p < .0001) without an interaction between the factors (p = .8546). The difference between the flushed and nonflushed groups was not significant (p = .8564) (see Figure 5). The increase due to inflammation was highly significant (p = .0011 for the nonflushed group and p = .0030 for the flushed group).
Total destruction of the mucosal architecture, increased infiltration of inflammatory cells within the colonic layers, and edema were seen after microscopic examination of inflamed colonic tissues (see Figure 4). Consequently, the microscopic scores were 7.00 ± 1.03 and 6.40 ± 1.44, respectively, for the group without and the group with bladder flushing. Two-way ANOVA showed no significant effect of the factor flushing (p = .7171) and a significant effect of inflammation (p < .0001) without an interaction between the factors (p = .7171). The difference between the flushed and nonflushed groups was not significant (p = .7213) (see Figure 5). The increase due to inflammation was higly significant (p = .0011 for the nonflushed group and p = .0077 for the flushed group). Elevated MPO activities were also seen in both groups (8.32 ± 1.10 and 12.71 ± 3.76, respectively, for the group without and the group with bladder flushing). Two-way ANOVA showed no significant effect of the factor flushing (p = .3842) and a significant effect of inflammation (p = .0003) without an interaction between the factors (p = .4522). There was no significant difference between MPO scores of the flushed and nonflushed groups (p = .2191) (see Figure 5), whereas the increase by inflammation was significant for both groups (p = .0010 for the nonflushed group and p = .0150 for the flushed group).
Rats
Postmortem analysis after the baseline scan did not show any macroscopic or microscopic signs of inflammation in nonflushed and flushed rats (score 0) (see Figure 6). This was confirmed by low MPO activity in both groups: 0.51 ± 0.13 and 0.74 ± 0.23, respectively, for the group without and the group with bladder flushing.
Two days after TNBS instillation, colitis was present in all rats. TNBS-induced inflammation was macroscopically characterized by multiple ulcerations extending over several centimeters of the distal gut. Macroscopic damage scores were similar for nonflushed (6.25 ± 1.20) and flushed (7.75 ± 0.25) rats. Two-way ANOVA showed no significant effect of the factor flushing (p = .2442) and a significant effect of inflammation (p < .0001) without an interaction between the factors (p = .2442). The difference between the flushed and nonflushed groups was not significant (p = .2666) (see Figure 7). The increase due to inflammation was highly significant (p = .0020 for the nonflushed group and p < .0001 for the flushed group). Microscopic evaluation showed the presence of a dense, transmural infiltrate, severe mucosal damage, and edema (score 5.75 ± 0.85 and 6.75 ± 1.18, respectively, for the group without and the group with bladder flushing). Twoway ANOVA showed no significant effect of the factor flushing (p = .5058) and a significant effect of inflammation (p < .0001) without an interaction between the factors (p = .5058). This difference between the flushed and nonflushed groups was not significant (p = .5183) (see Figure 7). The increase was highly significant (p = .0005 for the nonflushed group and p = .0012 for the flushed group). MPO activity was similarly increased in both groups (21.70 ± 6.54 and 26.42 ± 12.46). Two-way ANOVA showed no significant effect of the factor flushing (p = .6959) and a significant effect of inflammation (p = .0018) without an interaction between the factors (p = .7231). The groups were not significantly different (p = .7319) (see Figure 7). The increase by inflammation was significant (p = .0118 for the nonflushed group and p = .0312 for the flushed group).
Correlation Analysis
In the main study, the Spearman rho correlations between microPET and colonoscopy, macroscopy, and microscopy and MPO scores for mice without their bladder flushed were only 0.45, 0.10, 0.08, respectively, and —0.2, whereas the correlations were much higher when there was no accumulation of 18F-FDG in the bladder: 0.72, 0.72, 0.76, and 0.83, respectively (Table 2).
Spearman Rho Correlations between MicroPET with and without Bladder Flushing and the “Gold Standards,” Colonoscopy, Macroscopy, Microscopy, and MPO

MicroPET = micro-compuetd tomography; MPO = myeloperoxidase.
p < .05
p < .01
p < .001.
Also, the correlations for the rats with their bladder flushed were moderately higher, 0.81, 0.82, 0.74, and 0.62, respectively compared to 0.63, 0.73, 0.73, and 0.62, respectively, for the group without bladder flushing (see Table 2).
Discussion
In this study, we demonstrated the importance of bladder flushing when quantification of an imaging probe is to be performed in an anatomic region near the bladder, exemplified here for the colon in an experimental model for inflammatory bowel disease. Until now, most imaging studies involved manually expressing the bladder, leaving some residual probe behind and rapidly refilling due to the fast metabolism and excretion rates in small animals, which hampers pharmacologic approaches as applied in humans. Also, although OSEM iterative reconstruction and especially MAP result in a better resolution recovery and convergence, these algorithms are not able to minimize the PVE of the bladder spillover adequately.
We designed a gynecologic small-animal frame for mice to facilitate insertion of a double-lumen catheter and for the collection of bladder effluent. Here the imaging probe was 18F-FDG and the region of interest was the colon. The bladder flushing technique is, however, expandable to other imaging probes accumulating in the bladder and to other regions of interest in the pelvic region with PET but also with other modalities (eg, in SPECT, MRI, CT). However, with the flushing of the bladder, as we propose, there are also some limitations. Obviously, the major difficulty remains the catheterization of male mice and rats due to the complex male rodent anatomy. Even catheterization of female mice and rats still requires some practice, and although techniques are described for easy and fast insertion of the catheter, 19 the procedure is still associated with an increased risk of complications, such as infection. In our hands, we experienced, on average, a mortality rate of less than 10% for mice catheterized with the gynecologic frame and about 25% for rats. The mortality was, however, a consequence of the fulminant colitis rather than difficulties in catheterization. Abrasion or penetration of the ureters by the catheter is almost always the cause of bloody urine, intraperitoneal free fluids, or death, as also reported by Haney and colleagues. 16 It is noteworthy that when the bladder is flushed with pressure, a minor amount of urine flows back through the ureters to the kidneys, which can also slightly reduce image quality. Also, in terms of radiation exposure for the personnel, it is preferable to insert the catheter before the radiotracer injection. However, this means that the tracer uptake will happen in an anesthetized animal.
The influence of the urinary secretion of 18F-FDG on the colon image quantification was investigated by comparing the scanning of animals (both mice and rats) without and with bladder flushing. We demonstrated proof of concept in a phantom study, indicating overestimation of 61% and 38% for mouse and rat, respectively, if the bladder was not emptied. There was also no correlation between microPET and its gold standard, gamma counting, for the colon if the bladder was not flushed, although there was a very strong and significant correlation in animals whose bladder was continuously flushed during the microPET acquisition. In both mice and rats, it was seen that at the baseline scan, the average 18F-FDG uptake in the colon was significantly higher in the nonflushed group. Because this significant difference was not observed by colonoscopy or postmortem analyses, which both showed a healthy colon in the flushed and nonflushed groups, these results suggest that spillout activity of the large bladder signal in the nonflushed groups masks the relatively lower colon uptake signal, leading to a false positive. Moreover, a significant increase in 18F-FDG uptake due to inflammatory disease was observed in mice with a flushed bladder but not in nonflushed bladders, whereas colonoscopic and postmortem scores in nonflushed mice did reveal a significant increase in inflammatory parameters. Also, in rats, the colitis-induced increase in FDG was more significant when the animals' bladders were flushed. Moreover, for mice, there was almost no correlation between microPET and colonoscopy/postmortem analysis if the animals' bladder was not flushed, whereas there was a very high and significant correlation in the group that was continuously flushed. For rats, the correlation with colonoscopy and postmortem analysis was also higher for the group that was continuously flushed, but the increase in significance was more moderate compared to the findings in mice.
Given our well-established protocol for in vivo colonoscopy in mice and rats,18,21 with high sensitivity and specificity in established disease and, on the other hand, the potential impingement risks of bladder flushing in microPET, one may question the additional benefits of bladder flushing and, eventually, microPET. We have previously proven that microPET/CT detects colonic inflammation 2 weeks before colonoscopic symptoms arise. 18 Hence, microPET/CT gives better insight in the onset of the disease and can aid in preventive therapy evaluation. Moreover, we show here that bladder flushing in rodents is mandatory when quantifying microPET/CT images in the pelvic region. Moreover, colonoscopy only visualizes the colon mucosa, and stenosis and impaction of the feces in severe inflammation are contraindications for colonoscopy.
Future work consists of evaluating the bladder flushing technique in orthotopic tumor models with implantations in the cecal wall for colorectal cancer and in the mammary fat pads for breast cancer. Given the results of this inflammatory bowel disease study, we are strongly convinced that preclinical lower pelvic oncologic microPET studies may have been misquantified in the past due to the strong PVE of the nearby bladder spillover activity as well as by the image streak artifacts caused by the reconstruction algorithms that were used.
Conclusion
We designed and optimized a bladder flushing procedure for rodents, including catheter insertion, scanning, and collection of the efflux. Continuous bladder flushing reduced image artifacts and improved image quantification in the pelvic region for both mice and rats.
Footnotes
Acknowledgments
We thank Philippe Joye of the Molecular Imaging Center Antwerp for his technical assistance and for sharing his small-animal surgical expertise.
Financial disclosure of authors and reviewers: None declared.