
Abstract
Using positron emission tomography, we investigated the kinetics of [11C]vorozole ([11C]VOR), a radiotracer for the enzyme aromatase that catalyzes the last step in estrogen biosynthesis. Six subjects were scanned under baseline conditions followed by retest 2 weeks later. The retest was followed by a blocking study with 2.5 mg of the aromatase inhibitor letrozole. The binding potential (BPAd) was estimated from a Lassen plot using the total tissue distribution volume (VT) for baseline and blocked. BPAND for the thalamus was found to be 15 times higher than that for the cerebellum. From the letrozole studies, we found that [11C]VOR exhibits a slow binding compartment (small k4) that has a nonspecific and a blockable component. Because of the sensitivity of VT to variations in k4, a common value was used for the four highest binding regions. We also considered the tissue uptake to plasma ratio for 60 to 90 minutes as an outcome measure. Using the ratio method, the difference between the highest and lowest was 2.4 compared to 3.5 for the VT. The ratio method underestimates the high regions but is less variable and may be more suitable for patient studies. Because of its kinetics and distribution, this tracer is not a candidate for a bolus infusion or reference tissue methods.
COMPARED TO NEURORECEPTORS, relatively few radiotracers have been developed for investigating enzymes related to brain function in vivo with positron emission tomography (PET). 1 Fluorodeoxyglucose, which is phosphorylated by hexokinase, is the most common example, although there are others, including acetylcholine esterase, histone deacetylase, and monoamine oxidase A and B.1–6 The use of high-affinity inhibitors to map enzyme concentration and the relationship to disease and drug action has been applied to the study of monoamine oxidase A and B using the suicide inhibitors [11C]clorgyline and [11C]deprenyl as well as [11C]harmine.4,7 More recently, an inhibitor for the cytochrome P-450 enzyme aromatase, which catalyzes the conversion of androgens to estrogens in specific brain regions, has been developed and studied in nonhuman primates and humans.8–12
In many mammalian species, aromatase is important in the sexual differentiation of the brain. The estrogen synthesized from circulating testosterone via aromatase is essential for the development of male behaviors. 13 High levels of aromatase measured in the developing brain of many species suggest that local estrogen production could be important in development beyond sexual differentiation. 14 Supporting this view is the fact that during brain development, estradiol acts in the brain to restrain cell death and to promote the establishment of important neural pathways. 14
Aromatase extends its influence to the adult brain, in which locally produced estrogens regulate processes that vary with age, sex, and physiologic state. 14 Locally generated estrogens can influence brain function by direct effects at neuronal membranes. It has been suggested that estrogens display the characteristics of neuromodulators. 15 A link between serotonin and estrogen and the effect on mood and cognition is discussed in a review of animal and human data. 16 Also, the emotional instability and aggression that are side effects of the abuse of anabolic-androgenic steroids by athletes and others may be mediated by aromatase. 17 After treatment with anabolic-androgenic steroids, an increased level of aromatase was observed in the hypothalamus of macaque monkeys as measured with the aromatase inhibitor [11C] vorozole ([11C]VOR), a carbon 11–labeled high-affinity aromatase inhibitor. 18 Another role of aromatase is neuroprotection via its role in the biosynthesis of estrogen from testosterone. Injury from experimentally induced strokes and trauma has been shown to be less severe in female rats and mice for an equivalent amount of injury.19–21 The expression of aromatase is increased at the site of injury, and this occurs in the reactive astrocyte rather than the neuron. 22 This expression of aromatase as a result of injury may be a component of the body's response to neurodegenerative insults. 23 Furthermore, there is evidence of a neuroprotective effect of estrogen in Alzheimer disease. 24 This makes aromatase a potential target for therapies associated with neurodegenerative disorders. Of special interest is the fact that nicotine inhibits aromatase in vivo, which may underlie the observation that female smokers show hypoestrogenic effects, including early menopause and osteoporosis.25–28 For all of these reasons, a better understanding of aromatase and its relationship to brain function and pathology is needed, and [11C]VOR with PET provides a method for establishing this link.
Vorozole is a nonsteroidal aromatase inhibitor originally developed as an antineoplastic agent. 9 It was first labeled with carbon 11 in 1998. 9 However, a subsequent investigation revealed that the [11C]VOR produced by the reported purification method was contaminated by a radiolabeled isomer. 11 The synthesis of pure [11C]VOR and studies in the baboon revealed that the highest aromatase levels were in the amygdala and preoptic area. 11 The work reported here is an extension of the human studies reported in 2010 in which high levels of aromatase were found in the thalamus as well as the amygdala and preoptic area. 12 For this study, five males and one female were imaged under test–retest and baseline/blocking conditions. Our goal was to investigate in more detail the binding kinetics of [11C]VOR and methods of quantitating its uptake to obtain regional estimates of aromatase concentration in these subjects and to determine the reproducibility of repeated measures. Blocking by the specific aromatase inhibitor letrozole (Femara) would allow us to detect and quantify the presence of any nonaromatase binding component of [11C]VOR.
Two challenges became apparent in our analysis. The first is that [11C]VOR is a high-affinity ligand with a slow washout and thus exhibits some of the characteristic problems in modeling slow radiotracers. 29 Related to this is the fact that the study duration (due to the relatively low injected dose and short half-life of carbon 11) was 90 minutes, which limits the ability to accurately estimate k4, the ligand enzyme dissociation constant. Another complicating factor revealed by letrozole blocking is that there is a slow binding nonspecific component that cannot be separated from the slow aromatase binding.
Both types of binding form the slow compartment (C2) in the two-tissue compartment model (2TCM; Figure 1A) used to estimate the total distribution volume (VT). We used Lassen plots to estimate the occupancy and the distribution volume component of the slow nonspecific binding to separately estimate the aromatase binding potential (BPAND). 30 In terms of the consensus nomenclature, 31 BPND for the 2TCM is the sum of BPAND and the “nonspecific” binding potential (BPNSND). To estimate the error involved in using a 2TCM when the true binding is composed of three tissue compartments, we performed simulations using a three-compartment model (Figure 1B) with fixed model parameters for the nonspecific binding and a variable binding parameter to represent different amounts of aromatase. The simulated time activity curves (TACs) were then fit using the 2TCM to estimate the error.

Compartment models used to represent [11C]VOR binding in human brain. A, The two–tissue compartment model has a nonspecific fast compartment (C1) and a slow compartment (C2) that contain the aromatase binding as well as a slow nonspecific component. B, A three-tissue compartment model containing a fast and a slow nonspecific component (C1 and C3) and a specific compartment representing binding to aromatase. This model is used for simulation purposes. C, A two-tissue compartment model representing uptake of [11C]VOR (C1) and the labeled metabolites (C2). The input for C1 is the [11C]VOR component in plasma CpA, and the input for C2 is CpM, the labeled metabolites in plasma. This model represents the blocked condition with no aromatase binding.
We considered the possibility that the slow nonspecific binding is due to the movement of labeled metabolites from plasma into brain tissue. The potential effect of this was addressed by using a simple one-tissue model for both [11C]VOR and its metabolites (Figure 1C). This model was applied to the blocked data to minimize the effect of aromatase binding.
In addition to the 2TCM, we also compared the results for graphical analysis (GA) and a simple tissue (from a region of interest) to plasma ratio (ROI/Cp) for times from 60 to 90 minutes. 32 The use of the tissue to plasma ratio was inspired by the fact that for many regions, the uptake curves, instead of washing out, as is the case for many radiotracers, were either relatively flat or increasing after 30 minutes. In addition, the tracer is slowly metabolized, so the plasma tracer concentration does not change rapidly. Although this does not qualify as an equilibrium measure, it may correlate with the VT calculated by other methods.
Methods
Subjects
This study was carried out at Brookhaven National Laboratory and approved by the local Institutional Review Board (Committee on Research Involving Human Subjects, Stony Brook University). Six normal healthy subjects (one female, five males), age range 23 to 67 years, were included in the study. Written informed consent was given by all subjects. Subjects were excluded for recent or current use of steroids, recreational drugs, or medications affecting brain function and for neurologic/psychiatric/metabolic disorders. Subjects' characteristics and injected dose in millicuries for each study are given in Table 1.
Subject Characteristics and [11C]Vorozole Injected Dose (mCi)

Study Design
Subjects were scanned at baseline, and then approximately 2 weeks later, a second baseline (retest) scan was performed followed by a blocking study 2.5 hours after the first injection with an oral dose (2.5 mg) of letrozole (a drug that binds specifically to aromatase) given 2 hours prior to the PET scan. This is the clinical dose of letrozole and is based on dose-response studies in humans showing it to be high enough to block more than 80% of aromatase activity in adult humans. 33
Radiotracer Synthesis, Input Function, and Analysis of Unchanged [11C]VOR in Plasma
The synthesis of pure [11C]VOR and PET studies in humans has been previously reported by our group.11,34 An arterial input function was obtained from arterial blood samples counted every 5 seconds for the first 2 minutes (using the Ole Dich automatic blood sampler, Ole Dich Instrumentmakers ApS, Hvidovre, Denmark) and then at 5, 10, 20, 30, 60, and 90 minutes. Samples at 1, 5, 10, 20, 30, 60, and 90 minutes were analyzed for unchanged [11C]VOR. The fraction of [11C]VOR remaining in plasma at specified time points was determined by automated solid-phase extraction after validating by high-performance liquid chromatography (HPLC) using conditions previously described.11,35
PET Scans
Dynamic PET data for each study were acquired over a 90-minute period using a whole-body positron emission tomograph (Siemens, Munich, Germany, HR+, 4.5 × 4.5 × 4.8 mm at the center of the field of view) in three-dimensional dynamic acquisition mode. 36 A transmission scan was obtained with a 68Ge rotating rod source prior to the emission scans. For each PET scan, subjects received an injection of [11C]VOR (2.5-7.4 mCi); at the time of injection, the average specific activity was 1.31 ± 0.59 mCi/nmol (range 0. 47–1.98 mCi/nmol). The average amount of micrograms injected was 1.57 ± 0.95 (range 0.7-3.2 μg).
Image and Data Analysis
Regions of Interest
Timeframes for the PET scans were summed over the 90- minute scanning period for the purpose of region of interest (ROI) placement. ROIs were placed on the following structures: hypothalamus (Hyp), thalamus (Thl), preoptic area (Poa), amygdala (Amy), pons (Pons), putamen (Put), inferior temporal cortex (Inf), superior temporal cortex (Sup), cingulate (Cng), occipital cortex (Occ), cerebellum (Cb), and cortical white matter (Wm).
Models
Regional VTs, were estimated using the 2TCM of Figure 1A to estimate VT as VT = λ (1 + k3/k4), where λ = K1/k2, and using GA (to estimate VT directly). 32 Because of the sensitivity of VT estimates to variations in k4 when using the 2TCM, the four highest regions (Hyp, Thl, Amy, and Poa) were combined into a single region and the optimum k4 for this combined region was used in the VT estimates of all high regions. Similarly for the low regions, Cb, Cng, Inf, Sup, and Occ were combined for the purpose of estimating k4. For each region, three parameters (K1, k2, and k3) were optimized, with k4 remaining fixed. VTs for Put and Wm were calculated using k4 for the low regions. The average ratio of tissue to plasma [11C]VOR between 60 and 90 minutes was also calculated and compared to the values of VT.
Estimation of Aromatase Inhibition by Letrozole and Aromatase Binding Potential (BPAND)
The occupancy (Occ) and nonspecific component of the distribution volume (VND) were estimated using equation 1, known as a Lassen plot:

where VTBase is the estimated distribution volume from the baseline study and VTBlk is the distribution volume from the blocked study with letrozole.
30
The baseline distribution volume is taken to be

Images (mL/cm3) and uptake curves showing hypothalamus (Hyp), thalamus (Thl), amygdala (Amy), and cerebellum (Cb) for baseline (A, B) and blocked (E, F) studies. The solid lines in B and F represent the model fits to the data using the two-tissue compartment model. The symbols and lines are color coded for each region of interest as indicated. The plasma radioactivity and fraction of radioactivity due to parent compound versus time for baseline and blocked conditions are shown in C, D (baseline) and G, H (blocked). Only the first 30 minutes of the plasma curve is shown.

The fraction of the total distribution volume due to aromatase binding is

Values for λ for each subject were estimated using the blocked studies for each subject and a single ROI that combined into one ROI the high and low regions.
Simulations
To test the effect of using a 2TCM when the true model consists of three tissue compartments, simulations were done using the model shown in Figure 1B. The model parameters used were K1 = 0.12 mL/min/cm3, k2 = 0.22 min−1, k4 = 0.0075 min−1, k5 = 0.05 min−1, kg = 0.02 min−1, and k3, taking values of 0.07, 0.06, 0.05, 0.03, and 0.01 min−1 to represent different amounts of aromatase. The model parameters k5 and k6 represent the slow nonspecific binding component and are similar to the values found for the blocked and low binding regions, whereas k3 and k4 represent binding and dissociation of the ligand to aromatase. The simulated data were then fit with the 2TCM used to analyze the PET data. VT calculated using the 2TCM (see Figure 1A) was compared to the “true” VT (see Figure 1B).
Sensitivity of VT to Variations in k4
The sensitivity of VT to variations in k4 was calculated from the absolute value of the normalized derivative of VT with respect to k4,

using the 2TCM fits to the simulated data for high and low binding regions.
Labeled Metabolite Uptake Model
To test whether the uptake of metabolites could be responsible for the slow nonspecific binding component, we used an alternative 2TCM in which the input to one compartment was the metabolite fraction of the input function and the input to the other was the normal input function. We used data from blocking studies with the model shown in Figure 1C. Four model parameters (K1, k2, K1′, k2′) were optimized.
Software and Statistical Analyses
All statistical analyses were done using SigmaPlot (Systat Software, San Jose, CA). Test–retest variability of VT was calculated as
Results
Baseline Blocked
VT, BPAND and Occ
Images and uptake TACs for the Hyp, Thl, Amy and Cb are shown in Figure 2 for subject 1 for baseline and blocked conditions. The solid lines are the fits to the 2TCM (see Figure 1A). The images are the average of the tissue to plasma ratio for times from 55 to 90 minutes. The plasma radioactivity and fraction due to unchanged [11C]VOR are also shown for baseline and blocked conditions. Letrozole (2.5 mg) produced total blocking in four of six subjects (1, 2, 3, and 4) using equation 1 to calculate occ and VND. In most cases, both high and low ROIs were used in the calculation, but in one subject (4), VTS for the low regions from blocked studies were higher than the baseline, so only the high region VTs for baseline and blocked studies were used in equation 1. Two subjects (5 and 6) had occupancies of 0.86 and 0.91. The average occupancy calculated from the Lassen plots was 0.999 ± 0.087 (range 1.1-0.86). The essentially total blocking is consistent with the fact that the blocked VTs for low and high regions were very close (e.g., Figure 2B). The average VT over subjects from the blocking studies for the low binding regions (Inf, Sup, Cng, Cb, and Occ) was 1.43 ± 0.30 and 1.47 ± 0.38 mL/cm3 for the high regions (Amy, Hyp, Thl, Poa).
The estimation of the aromatase binding potential BPAND (equation 2) requires estimates of λ (K1/k2) and the nonspecific binding component, VND. The parameter λ was estimated using a single ROI formed from the high and low binding areas in the blocking studies. These values formed a bimodal distribution in which four subjects (3, 4, 5, and 6) had an average value of 0.70 ± 0.03 mL/cm3 and two subjects 0.46 ± 0.03 mL/cm3 for λ. VND from the Lassen plot agreed very well with the average of the VT for the blocked studies, average VND 1.45 ± 0.32 mL/cm3. The aromatase binding potentials are given in Figure 3A; the highest is Hyp (5.29 ± 0.8) > Thl (4.5 ± 0.9) > Poa (2.56 ± 0.53) = Amy (2.55 ± 0.48) > Pons (1.10 ± 0.3) = Put (0.96 ± 0.3) and > Wm (0.54 ± 0.21). At the low end is Cb (0.25 ± 0.06). BPA for Thl is on the order of 15 to 20 times higher than for Cb.

A, Regional binding potentials for aromatase calculated from equation 2. B, Average VT (two-tissue compartment model) baseline (Base) and blocked (Blk) by region. The lowest regions (cerebellum [Cb], cingulate [Cng], inferior temporal cortex [Inf], superior temporal cortex [Sup], and occipital cortex [Occ]) were combined into one region designated “low.” C, Fractional change in VT (baseline/blocked) by region. All regions showed significant (p < .007) reductions in VT except white matter (Wm), which had greater variability. D, Regional K1 averaged over subjects for the three conditions studied, baseline, retest, and blocked.
The average VTs over subjects for baseline and blocked conditions are shown in Figure 3B, and fractional change in VTs between baseline and blocked is shown in Figure 3C. The low regions (Cb, Cng, Inf, Sup, and Occ) were combined into one region for the “low” region. At the high end, the VT blocking is on the order of 60 to 70% for the Hyp and Thl. The Amy, Hyp, Thl, Pons, and Poa were significantly blocked (paired t-test p < .007). For the low regions, blocking is on the order of 10%, and this was significant based on a paired t-test (p < .001) (based on five subjects, leaving out the one with the blocked VT higher than baseline). The average change in the Put was 15% (p < .005 paired t-test). There is some evidence that the Put may have a somewhat higher blocked VT than other low regions. Comparing the Put from the blocked studies to the average of the low regions (also blocked) for each subject, the Put was found to be higher (p = .05), and the average ratio of Put to “low” was 1.25 ± 0.15. This higher value may be due to a somewhat higher BPNSND.
K1 and Plasma Integrals
Average regional K1 values for test, retest, and blocked conditions (retest is baseline for blocked) are shown in Figure 3D. Averaged K1 values over ROIs and subjects for the retest and blocked conditions were 0.142 ± 0.04 and 0.132 ± 0.04 mL/min/cc, respectively. The average ratio of K1 retest to blocked condition was 1.09 ± 0.20. The average metabolite-corrected plasma integrals were 0.247 ± 0.053 and 0.233 ± 0.047 min standardized uptake value (SUV) for the retest and blocked condition, respectively. The average ratio of plasma integral baseline to blocked condition was 1.06 ± 0.07. There was a trend for K1 and the plasma integral for the first study to be higher (p = .052); however, the differences for K1 and the plasma integrals between the retest and blocked conditions were less than 10%.
Test–Retest: K1, k4, and Plasma Integrals
K1 averaged over subjects and ROIs was 0.15 ± 0.04 (test) compared to 0.142 ± 0.042 (retest). K1 was significantly higher for the first study compared to the second (p < .001 average ratio across subjects and ROIs for test–retest 1.15 ± 0.29). Values for K1 were low compared to normal blood flow values, which are ≈ 0.55mL/min/cm3. Averages ranged from 0.11 (Poa and Wm) to 0.18 mL/min/cm3 (Cb and Thl). The average k4 for the high regions was 0.0157 ± 0.0026 min−1 and 0.024 ± 0.005 min−1 for the low regions.
The average plasma integral ([11C]VOR) was 0.24 ± 0.054 min − SUV for scan 1 (test) and 0.237 × 0.053 min × SUV for scan 2 (retest). The average ratio (test–retest) was 0.98 ± 0.10 (no significant difference).
VT Comparing Methods
The average VTs for each region for the three methods considered are given in Table 2. Combining both baseline and retest, the average VTs (2TCM) for the five high regions are 4.59 ± 0.9 (Hyp), 4.29 ± 0.5 (Thl), 2.96 ± 0.56 (Poa), 3.10 ± 0.53 (Amy), and 2.21 ± 0.29 (Pons) compared to ROI/Cp (55-90 minutes) 3.70 ± 0.53 (Hyp), 3.51 ± 0.40 (Thl), 2.52 ± 0.40 (Poa), 2.47 ± 0.4 (Amy), and 1.90 ± 0.20 (Pons). VT estimated by GA was close to that using 2TCM but with greater variability. Figure 4 plots correlations of GA and ROI/Cp versus 2TCM, respectively, for all subjects, baseline and blocked conditions. ROI/Cp gives lower estimates of VT than 2TCM (slope 0.73) but is strongly correlated, whereas GA is in closer agreement with 2TCM (slope 0.94) and also strongly correlated. The average coefficient of variation for the high regions across subjects was 0.159 ± 0.03 (2TCM), 0.17 ± 0.05 (GA) and 0.138 ± 0.028 (ROI). VT for the Hyp was found to be greater than for the Thl using the 2TCM (p < .001). For the low regions (Inf, Sup, Cb, Cng, and Occ), the average VT (2TCM) ranged from 1.50 to 1.66, and for the Put, the average VT was 1.96. For ROI/Cp, the range was 1.52 to 1.67 for the low regions and 1.92 for the Put. Comparing the combined low regions (Low) with the Put, the Put is significantly greater using the 2TCM and ROI/Cp (p < .001 for both).
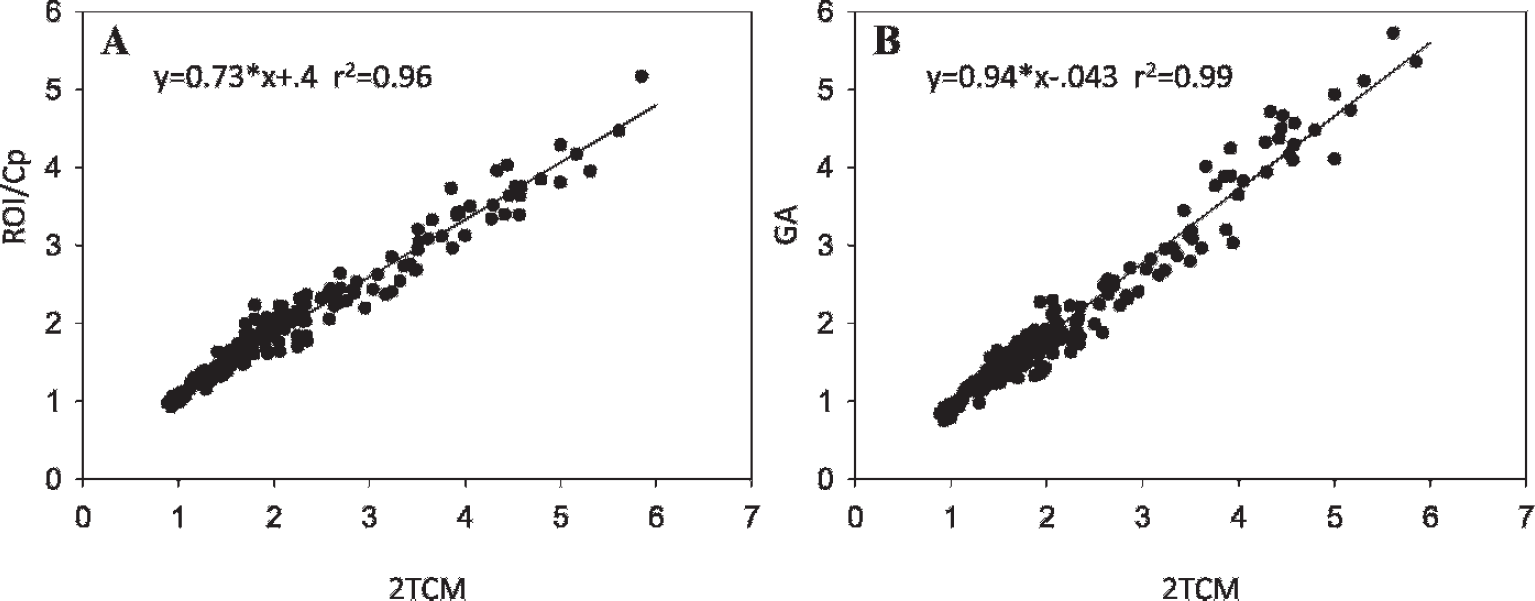
A, Correlation of ROI/Cp with VT (two–tissue compartment model [2TCM]) for all subjects, baseline and blocked conditions. B, Correlation of graphical analysis (GA) with VT (2TCM) for all subjects.
Average VT (mL/cc) Values Estimated by 2TCM, GA, and ROI/Cp for Test-Retest with the Average Fractional Change for Each Method

GA = graphical analysis; 2TCM = two–tissue compartment model.
Test–retest variabilities are given in Table 2. For the Thl and Hyp, variability for VT (2TCM) was 0.07 ± 0.15 (Thl) and 0.069 ± 0.16 (Hyp). The average fractional change (test—retest variability) for the 2TCM averaged over the Amy, Poa, and Pons was 0.029 ± 0.064. For ROI/Cp, variabilities were 0.05 ± 0.155 and 0.029 ± 0.16 for the Thl and Hyp, respectively. For the Amy, Poa, and Pons combined, the average variability of ROI/Cp was 0.037 ± 0.065. The variabilities were all positive due to two studies that were consistently lower on retest, with differences ≈ 10 to 20%.
Metabolite Model
The metabolite model (Figure 5) provided a poorer fit to the data than the 2TCM used to model [11C]VOR uptake. The number of parameters in both models is 4. The average ratio of the squared difference of the TAC and model fit of the metabolite model to the 2TCM over subjects is 5.2 ± 3.1. Furthermore, the residuals for the metabolite model display a distinct nonrandom appearance with negative values between 5 and 50 minutes and positive values for later times. These are considerably greater than the residuals observed for the 2TCM.

Simulations
The estimated VT using the 2TCM (see Figure 1A) for data generated from the three–tissue compartment model underestimated VT at the high end (k3 = 0.07) by 11% and at the low end (k3 = 0.01) by 7%. This underestimation is due to the fact that the “true” k4 (from Figure 1B) was smaller than the k4 estimated using the model of Figure 1A. The range of VTs observed for the Hyp was 3.5 to 5.9, so the upper end of the estimated VT corresponds to high value in the simulation. For smaller values of k3, the model becomes closer to the 2TCM with even less of an error. The fits to the data were comparable to what was obtained fitting the 2TCM to the experimental data. The sensitivity of VT to variations in k4 was also evaluated at the high and low ends. The normalized derivative of VT with respect to k4 was 55 and 8 for the high and low k3 simulations, respectively.
Discussion
We investigated the kinetics of [11C]VOR in the human brain. High binding as measured by VT using the 2TCM is localized to Thl, Hyp, Amy, and Poa with intermediate binding in Pons and Put. Binding is low in cortical regions and Cb. A characteristic of uptake in the high regions is that the uptake curves were increasing during the scanning period whereas the plasma levels were declining. There appear to be three components to [11C]VOR binding. There is a rapid component characterized by model parameters K1 and k2. There is also a slow ‘nonspecific’ binding component that is also observed in the baboon with the inactive enantiomer of vorozole (accepted for publication 38 ) as well as in the blocked human studies with letrozole pretreatment reported here. In both cases, a 2TCM with a fast and a slow component (determined by k2 and k4, respectively) is required to fit the data. The ‘specific’ aromatase binding is also slow, although probably somewhat slower than the nonspecific component because the k4 for high regions with greater amounts of aromatase was smaller than for the low regions with less aromatase, as we found from our simulations (see Figure 1C). It was not possible to separate these two slow components by application of a model; therefore, the two slow components are grouped together. To take into account differences due to different amounts of aromatase, a single k4 was used for the high regions and a different one for the low regions. These were determined by fitting combined high and low regions. Without this constraint, k4 for some high regions was too small to reliably estimate with 90 minutes of data. A variable k4 across regions in receptor studies has also been related to rebinding of the radiotracer to receptors in the immediate vicinity. 29 For [11C]VOR, the estimation of k4 is also made more difficult by noise in the TACs due to low injected dose and the small enzyme-containing regions, which are more susceptible to errors due to subject movement (two studies had to be eliminated due to motion artifacts). The k4 sensitivity is also seen in the simulations for which the high regions had a much higher normalized derivative with respect to k4 than the low regions. Small variations in k4 can lead to large fluctuations in VT estimates as the fit becomes more a function of noise in the data than the aromatase concentration. Furthermore, the constraint on k4 for the high and low binding regions appeared to provide good fits to the data (e.g., see Figure 2).
We investigated the possibility that the slow nonspecific component is due to the binding of labeled vorozole metabolites that cross the blood-brain barrier. We have shown that this is unlikely because the formation of metabolites is too slow to account for this nonspecific binding and does not allow for sufficient uptake to replace the slow nonspecific component in the 2TCM. The metabolite model provided a much poorer fit to the data than the 2TCM, and the residuals were considerably more biased (see Figure 5). We cannot rule out the possibility that some amount of metabolites is found in the brain, but it is unlikely to be a big effect.
By using Lassen plots, we were able to estimate the nonspecific binding component and extract estimates of the aromatase binding potential. Low levels of BPAND were found in the Cb, Cng, and Occ (average 0.27 ± 0.13), with slightly higher levels (0.47 ± 0.16) in the Inf, Sup, and Wm, but the differences between them were not significant (see Figure 3A). The level in the Put was also higher, but this was most likely due to a slightly higher nonspecific component. A common nonspecific VND was used for all regions to calculate the BPAND. The ratios of BPAND for the Hyp and Thl to the Cb are 18 and 15, respectively, although this is most likely a lower limit because the true VT (see Figure 1B) based on our simulations would most likely predict a higher estimate. The estimated fraction of VT of the Thl due to aromatase (averaged over subjects) is 0.64 ± 0.044 and of the Cb is 0.078 ± 0.055. The Cb has been used to estimate binding potentials with the simplified reference tissue method (SRTM) in the macaque monkey, but this may cause some bias due to the fact that the model is far from being a one-tissue compartment model and the reference region (Cb) contains some aromatase. 18
The simple ratio of ROI to plasma correlates well with the standard 2TCM used for modeling [11C]VOR uptake. It underestimates the VT in the high regions but has similar variability in test-retest (see Table 2). This is contrary to theoretical calculations that demonstrate that tissue to plasma ratios overestimate the distribution volume.39,40 In the Appendix, we show that when the smallest eigenvalue of the response function does not approach 0 during the scanning time, the tissue ratio can underestimate the VT. VT will be underestimated even if the plasma becomes constant.
The variability of 2TCM is lower than that of GA, most likely due to the constraint on k4, which would have the effect of reducing the influence of noise. Constraining k4 might be expected to lead to underestimates of VT; however, the VTs using the 2TCM agree well with the model independent GA method. The test–retest studies were done 2 weeks apart, and the average fractional change for all three methods was on the order of or less than 0.1. The variabilities were positive due to the dominance of two subjects with larger differences on test-retest. Had the studies been done on the same day, the differences may have been less. Also, subject movement could contribute to test–retest variability.
For clinical studies, using ROI/Cp may be a good option because it does not require arterial blood sampling (venous samples at the later time points for which the ratio was taken would be expected to be the same as arterial samples) and does not require the lengthy scanning period needed to quantitate [11C]VOR with the 2TCM method because only 30 minutes of scanning was used. However, it has been noted that for some tracers, the arterial and venous concentrations are different throughout the scanning period. 41 If one uses venous sampling consistently, this would be a constant bias. In any case, the 2TCM model used is not the “true” model because there appear to be two slow binding components, only one of which can be blocked with letrozole. Furthermore, we found it difficult to achieve accurate estimates of k4 for the Hyp or Thl in some instances within the 90-minute scanning time. To obtain better estimates would require even longer scanning times and higher injected doses to compensate for radioactive decay. A test of the feasibility of using ROI/Cp in place of the 2TCM is if the same predictions are found to hold with both methods when studying aromatase in different populations. Variability in aromatase outcome measures can be improved with better methods for movement correction. This would improve measures in the Hyp and Amy, which are small and particularly subject to movement effects. In any case, the estimates using VT contain a nonspecific component that is ≈ 30 to 40% in the Thl. To extract the aromatase binding potential requires a blocking study to estimate VND as well as λ. The kinetics and distribution of this radiotracer and the distribution of aromatase are such that [11C]VOR is not a candidate for bolus infusion or reference tissue methods.
Footnotes
Acknowledgments
We acknowledge and greatly appreciate the excellent work of Mike Schueller, Don Warner, David Alexoff, Millard Jayne, Pauline Carter, Barbara Hubbard, Payton King, Lisa Muench, Colleen Shea, and Youwen Xu.
Financial disclosure of authors: This study was supported by grant 1R21EB012707 (Anat Biegon PI).
Financial disclosure of reviewers: None reported.