
Abstract
The development of antiangiogenic therapies has stimulated interest in noninvasive imaging methods to monitor response. We investigated whether the effects of a vascular endothelial growth factor decoy receptor (VEGF Trap, Regeneron Pharmaceuticals, Tarrytown, NY) could be monitored in vivo using contrast-enhanced ultrasonography (CEUS). Twenty nude mice (in two groups) were implanted with a human melanoma cell line (DB-1). The active group received VEGF Trap (4 × 25 mg/kg over 2 weeks), whereas the control group received an inactive protein. An ultrasound contrast agent was injected followed by power Doppler imaging (PDI) and pulse inversion harmonic imaging (PIHI; regular and intermittent). Specimens were sectioned in the same planes as the images and stained for endothelial cells (CD31), cyclooxygenase-2 (COX-2), VEGF, and hypoxia (Glut1). Measures of tumor vascularity obtained with the different imaging modes were compared to immunohistochemical markers of angiogenesis. Mean tumor volume was smaller in the active group than in the control group (656 ± 225 vs 1,160 ± 605 mm3). Overall, PDI and VEGF correlated (r = .34; p = .037). Vascularity decreased from control to treated mice with intermittent PIHI, as did the expression of CD31 and COX-2 (p # .02), whereas VEGF increased (p = .05). CEUS appears to allow in vivo monitoring of the antiangiogenic effects of VEGF Trap in the DB-1 human melanoma xenograft model.
PATHOLOGIC ANGIOGENESIS, often referred to as neovascularization, is a hallmark of cancer and is defined as the development of a new vascular network out of preexisting vessels.1–3 In addition, angiogenesis is an important predictor of the biological behavior of certain cancers.3–5 Angiogenesis is a prerequisite for tumor growth greater than 2 mm3 and is also a key factor of metastasis by allowing the ingrowth of vessels into a tumor providing a pathway for systemic dissemination via the blood or lymph system.6,7
One way to inhibit angiogenesis is to interfere with the function of vascular endothelial growth factor (VEGF). This includes the use of antibodies to VEGF or VEGF receptors, which are antagonists that block VEGF interaction with its receptors, and the use of soluble VEGF receptors to scavenge the available VEGF. 8 One particular compound is the anti-VEGF agent VEGF Trap (Aflibercept or ZALTRAP, Regeneron Pharmaceuticals, Inc., Tarrytown, NY), which acts as a soluble decoy receptor, an antigen similar in likeness to that of VEGFR-1. VEGF Trap binds all isoforms of VEGF-A and VEGF-B (human as well as murine) with high affinity and blocks them from reaching their natural receptors.8–11 In preclinical models, VEGF Trap has been shown to inhibit tumor growth and reduce tumor vascularity.8,9 VEGF Trap was recently approved by the Food and Drug Administration for use in patients with age-related macular degeneration or metastatic colorectal cancers. 11
The need for clinical evaluations of antiangiogenic therapies has stimulated interest in noninvasive imaging methods to monitor response.12,13 The opportunity for noninvasive imaging of tumor angiogenesis is strengthened by the fact that vessels form a substantial portion of the mass of malignant tumors, contributing up to 10% of the total volume of the tumor. 14 Ultrasound (US) imaging offers a low-cost, noninvasive, and readily available approach, which can characterize both structural and functional features of tumor vascularity from its earliest stages, in particular when combined with intravenous injection of stabilized gas microbubbles (generally 1-8 μm in diameter) as US contrast agents (producing up to 27 dB of signal enhancement).15–17 Moreover, microbubbles not only enhance the backscattered US signals, but at higher acoustic pressures, they also produce significant nonlinear components in the received echo signals. 16 These nonlinear bubble echoes can be separated from tissue echoes and used to create contrast-specific US imaging modes (eg, harmonic imaging). Recent studies of breast tumors by our group have indicated significant correlation of direct pathologic vascularity assessments with US measurements postcontrast, particularly for vessels 20 to 39 μm in diameter. 18 This indicates the potential of contrast-enhanced ultrasonography (CEUS) to provide a noninvasive measure of tumor neovascularity, and reports on in vivo CEUS of angiogenesis in xenografts have been encouraging19–23.
Hence, this project was undertaken to establish whether the functional effects of a VEGF decoy receptor (VEGF Trap) on tumor growth and, in particular, vascularity could be monitored in vivo using CEUS. Here we show for the first time in the DB-1 human melanoma xenograft model that CEUS measures of flow decrease, whereas VEGF increases and hypoxia is unchanged (or increases slightly) following treatment with VEGF Trap, which indicates a lack of “vascular normalization.” 24 Overall, CEUS appears to allow in vivo monitoring of the antiangiogenic effects of VEGF Trap.
Materials and Methods
Animal Tumor Model
Twenty 6-week-old, female, athymic nude mice (NCR nu/nu) weighing 20 to 25 g were purchased from Taconic Inc. (Hudson, NY) and used as melanoma xenografts for the VEGF Trap and CEUS experiments. Animal studies were carried out in an ethical and humane fashion under the supervision of a veterinarian, and Thomas Jefferson University's Institutional Animal Care and Use Committee approved all protocols.
The human melanoma cell line DB-125,26 was provided by Dr. David Berd (Thomas Jefferson University Hospital, Philadelphia, PA). This cell line was maintained in logarithmic growth at 37°C as monolayers in 75 cm2 flasks with a 5% CO2 in air atmosphere. DB-1 cells were grown in modified Eagle's medium (MEM; Sigma-Aldrich, St. Louis, MO) containing 12 mM glucose, 2 mM nonessential amino acids, 2 mM glutamine, and 10% heat-inactivated fetal bovine serum (complete medium). Cells were subcultured every 7 days by trypsinization. Localized melanoma xenografts were established by injection of 2 × 10⁶ DB-1 tumor cells (a 0.2 mL tumor cell suspension) in the lower right flank of each mouse using a 27-gauge needle (Becton Dickinson, Franklin Lakes, NJ). The mice were then placed back in their cages, where they remained until the time of their study. They were observed daily for tumor growth and abnormal clinical signs.
VEGF Trap (concentration 25.0 mg/kg) and human Fc control protein (concentration 25.0 mg/kg) were supplied by Regeneron Pharmaceuticals. The reagent concentrations of VEGF Trap and the Fc control were normalized so that each mouse received 125 μL of agent. Mice were randomized into two groups of 10 animals each. One group was injected with VEGF Trap twice weekly (in accordance with the manufacturer's instructions) during weeks 4 and 5 postimplantation, whereas the control group received human Fc control protein at the same time points. These time points were selected because tumor sizes are suitable for US imaging (> 5 mm) and due to the marked increase in the expression of CD31, VEGF, and cyclooxygenase-2 (COX-2) observed in our previous study of this xenograft model. 26
CEUS Imaging
CEUS evaluations of the melanoma xenografts were performed 1 week after treatment (ie, 6 weeks after tumor implantation). The mice were anesthetized by intraperitoneal injections of a mixture of 20 μL acepromazine (Henry Schein Inc., Melville, NY) at a concentration of 10 mg/mL and 5 μL ketamine (Henry Schein Inc.) at a concentration of 100 mg/mL. A 24-gauge catheter (BD Insyte, Becton Dickinson) was inserted into a tail vein for bolus injections of Optison, a US contrast agent (GE Healthcare, Princeton, NJ). Optison is a suspension of human serum albumin-coated microbubbles with an octafluoropropane gas core, a concentration of 5.0 to 8.0 × 10⁸/mL, and mean diameters ranging from 3.0 to 4.5 μm (95% of the bubbles are less than 10 μm in diameter). 16
All mice in this study were imaged using a Sonoline Elegra scanner (Siemens Medical Solutions, Mountain View, CA) and a 7.5 MHz broad-bandwidth, linear array transducer. Three US imaging techniques were performed on each mouse: power Doppler imaging (PDI), grayscale pulse inversion harmonic imaging (PIHI), and intermittent grayscale PIHI. In pulse inversion imaging, first harmonic (and other odd) signal components are cancelled out by transmitting a pulse sequence where each pulse is an inverted copy of the previous pulse and then summing the returned echoes, which suppresses linear echoes from stationary tissue while retaining nonlinear echoes associated with contrast microbubbles (and, to a much lesser degree, with tissue nonlinearities). 16 These US imaging modes were selected for this study because PDI is the most sensitive of the noncontrast US flow modes, whereas PIHI has been developed specifically to image contrast microbubbles (ie, it should have a better contrast to tissue ratio than PDI) and is commercially available on most state-of-the-art US scanners. 16 Frame rates of 30 or 1 Hz (for intermittent imaging, where the reduced frame rates permit microbubbles to penetrate deeper into the vascular tree21,27) were used for PIHI with a 3.6/7.2 MHz transmission/reception frequency pair. All imaging parameters were kept constant before and after contrast administration (in particular, a mechanical index below 0.3 was used to limit the amount of bubble destruction). The time between each injection was at least 10 minutes to allow the contrast agent to clear the blood pool and avoid volume overload. 26
The researchers performing the US scanning were blinded to the treatment group assigned a given animal. Coupling gel was applied liberally on the site of the tumor, thereby creating a standoff pad effect, which minimized pressure on the tumor from the ensuing placement of the transducer. The volume of each melanoma was determined from height, width, and length measurements. Tumors were imaged in their longest axis for vascularity assessments. A total of three bolus injections of contrast were administered per mouse. PDI was performed first, followed by PIHI and then intermittent PIHI—with dosages of 10 μL, 15 μL, and 15 μL, respectively. These dosages were chosen based on our previous experience in the DB-1 model. 26 A medium wall filter and a pulse repetition frequency of either 868 or 1,102 Hz were employed to limit motion artifacts, and digital US clips were recorded from the time of injection until after peak enhancement had passed. On completion of the study, the mice were euthanized with an intracardiac injection of sodium pentobarbital (Euthasol, Delmarva Laboratories, Midlothian, VA) at a concentration of 20 to 30 mg/mL.
Tissue Processing and Immunohistochemistry
Tumors were surgically removed and tagged in the transaxial (imaging) plane by specimen ink marking the front, back, true right, and true left of the specimen. The dimensions of the excised tumors (height, width, and length) were measured, and volumes were calculated. Each specimen was then placed in 10% buffered formalin phosphate solution (Fisher Scientific, Houston, TX) for 24 hours. Fixed tissue was washed for 2 days in phosphate-buffered saline prior to being processed into paraffin. Tumor specimens were embedded in paraffin blocks while preserving the orientation of the CEUS scans indicated by the specimen ink.
For histologic assessment of the tumors and their vascularity, specimens were sectioned centrally in 5 μm planes corresponding to the CEUS imaging planes. Standard methods for immunohistochemistry were used. Briefly, the histologic specimens were stained for three immunohistochemical predictors of tumor blood flow and angiogenesis, specifically platelet endothelial cell adhesion molecule (PECAM-1 or CD31), COX-2, and VEGF. Immunohistochemical staining of the formalin-fixed specimens was performed using a monoclonal antibody against PECAM-1 (JC70A, Dako Corporation, Carpinteria, CA), a polyclonal antibody against COX-2 (SC-1747, Santa Cruz Biotechnology, Santa Cruz, CA), and a monoclonal antibody against VEGF (SC-7269, Santa Cruz Biotechnology). The stained sections were then mounted on standard glass slides for analysis.
Data Processing and Statistical Analysis
For each specimen, the section corresponding to the imaging plane was assessed to determine the percent area stained using an SMZ-10A microscope (Nikon, Melville, NJ) with a 4X objective and 10X ocular magnification for a total magnification of 40X. A Sony DXC-970MD color charge-coupled device camera (Sony Corporation, Tokyo, Japan) was connected to the microscope, providing a digital view of each histologic slide on a desktop computer equipped with ImagePro Plus software (Media Cybernetics, Silver Spring, MD) for image acquisition and processing.18,21,26 Moreover, data from the same animal were analyzed on separate occasions at least 6 weeks apart to eliminate or reduce operator bias.
Briefly, the tumor was manually outlined on the images and the red/green/blue (ie, RGB) color channels were used to automatically segment and count the number of stained pixels as well as the total number of pixels within 3 mm regions of interest (ROI) covering the lesion (ie, 4–5 ROI per tumor).18,21,26,28 The fractional vascularity (FVA) of each CEUS image was also calculated with this setup as the ratio of the sum of enhanced pixels (representing vascularity) to the total number of pixels within each ROI. The equation for FVA measurement is as follows18,21,26,29,30:

where Xi is the number of enhanced pixels and Ci is the number of unenhanced pixels in the tumor. Given the heterogenic nature of tumor vasculature,3,21 small 3 mm ROIs were chosen to more accurately align the CEUS and immunohistochemical results (instead of averaging over the entire tumor area).
Correlation between the CEUS measures of fractional tumor vascularity and the relative specimen area stained by the immunohistochemical markers was determined using linear regression analysis. Two-way analysis of variance (ANOVA) was performed to measure significant differences in FVA (the dependent variable) as a function of imaging technique and treatment group (the independent variables). Unpaired Student t-test was used to measure significant differences between two variables. All statistical analyses were performed using Stata Statistical Software 12.0 (Stata Corporation, College Station, TX), with p values less than .05 considered significant and p values between .05 and .10 indicating a trend toward significance.
Results
Of the 20 mice implanted with DB-1 cells, 15 (75%) exhibited tumor growth. Moreover, due to the difficulty of obtaining or maintaining venous access, a number of imaging studies failed. The final study involved nine mice distributed as six mice in the VEGF Trap-treated group and three mice in the Fc control group. The mean tumor volumes measured at 6 weeks postimplantation were 656 ± 225 mm3 for the treatment group and 1,160 ± 605 mm3 for the Fc control group. There was a trend toward significance when comparing the VEGF Trap group to the Fc control group (p = .099).
An example of PDI images acquired before administration of Optison and at peak enhancement reveals mainly posterior, peripheral tumor vascularity with a single, larger central vessel, whereas grayscale intermittent PIHI images show marked vascular enhancement of both the periphery and the center of the melanoma (Figure 1). This is most likely due to the improved sensitivity and spatial resolution of the contrast-specific grayscale PIHI mode compared to PDI.16,21,26 The sensitivity of grayscale PIHI is demonstrated in Figure 2, which shows the arrival of contrast microbubbles in the tumor neovessels with a gradual filling of the entire vasculature over a period of 10 seconds. Representative examples of the four immunohistochemical stains are presented in Figure 3.

Power Doppler images of a VEGF Trap–treated DB-1 melanoma tumor (arrows) pre- (A) and post- (B) contrast. Enhancement around the periphery of the tumor along with a larger central vessel is seen. Intermittent pulse inversion harmonic images of the same treated DB-1 melanoma xenograft pre- (C) and post- (D) contrast showing nearly complete filling of the tumor vascularity with contrast.
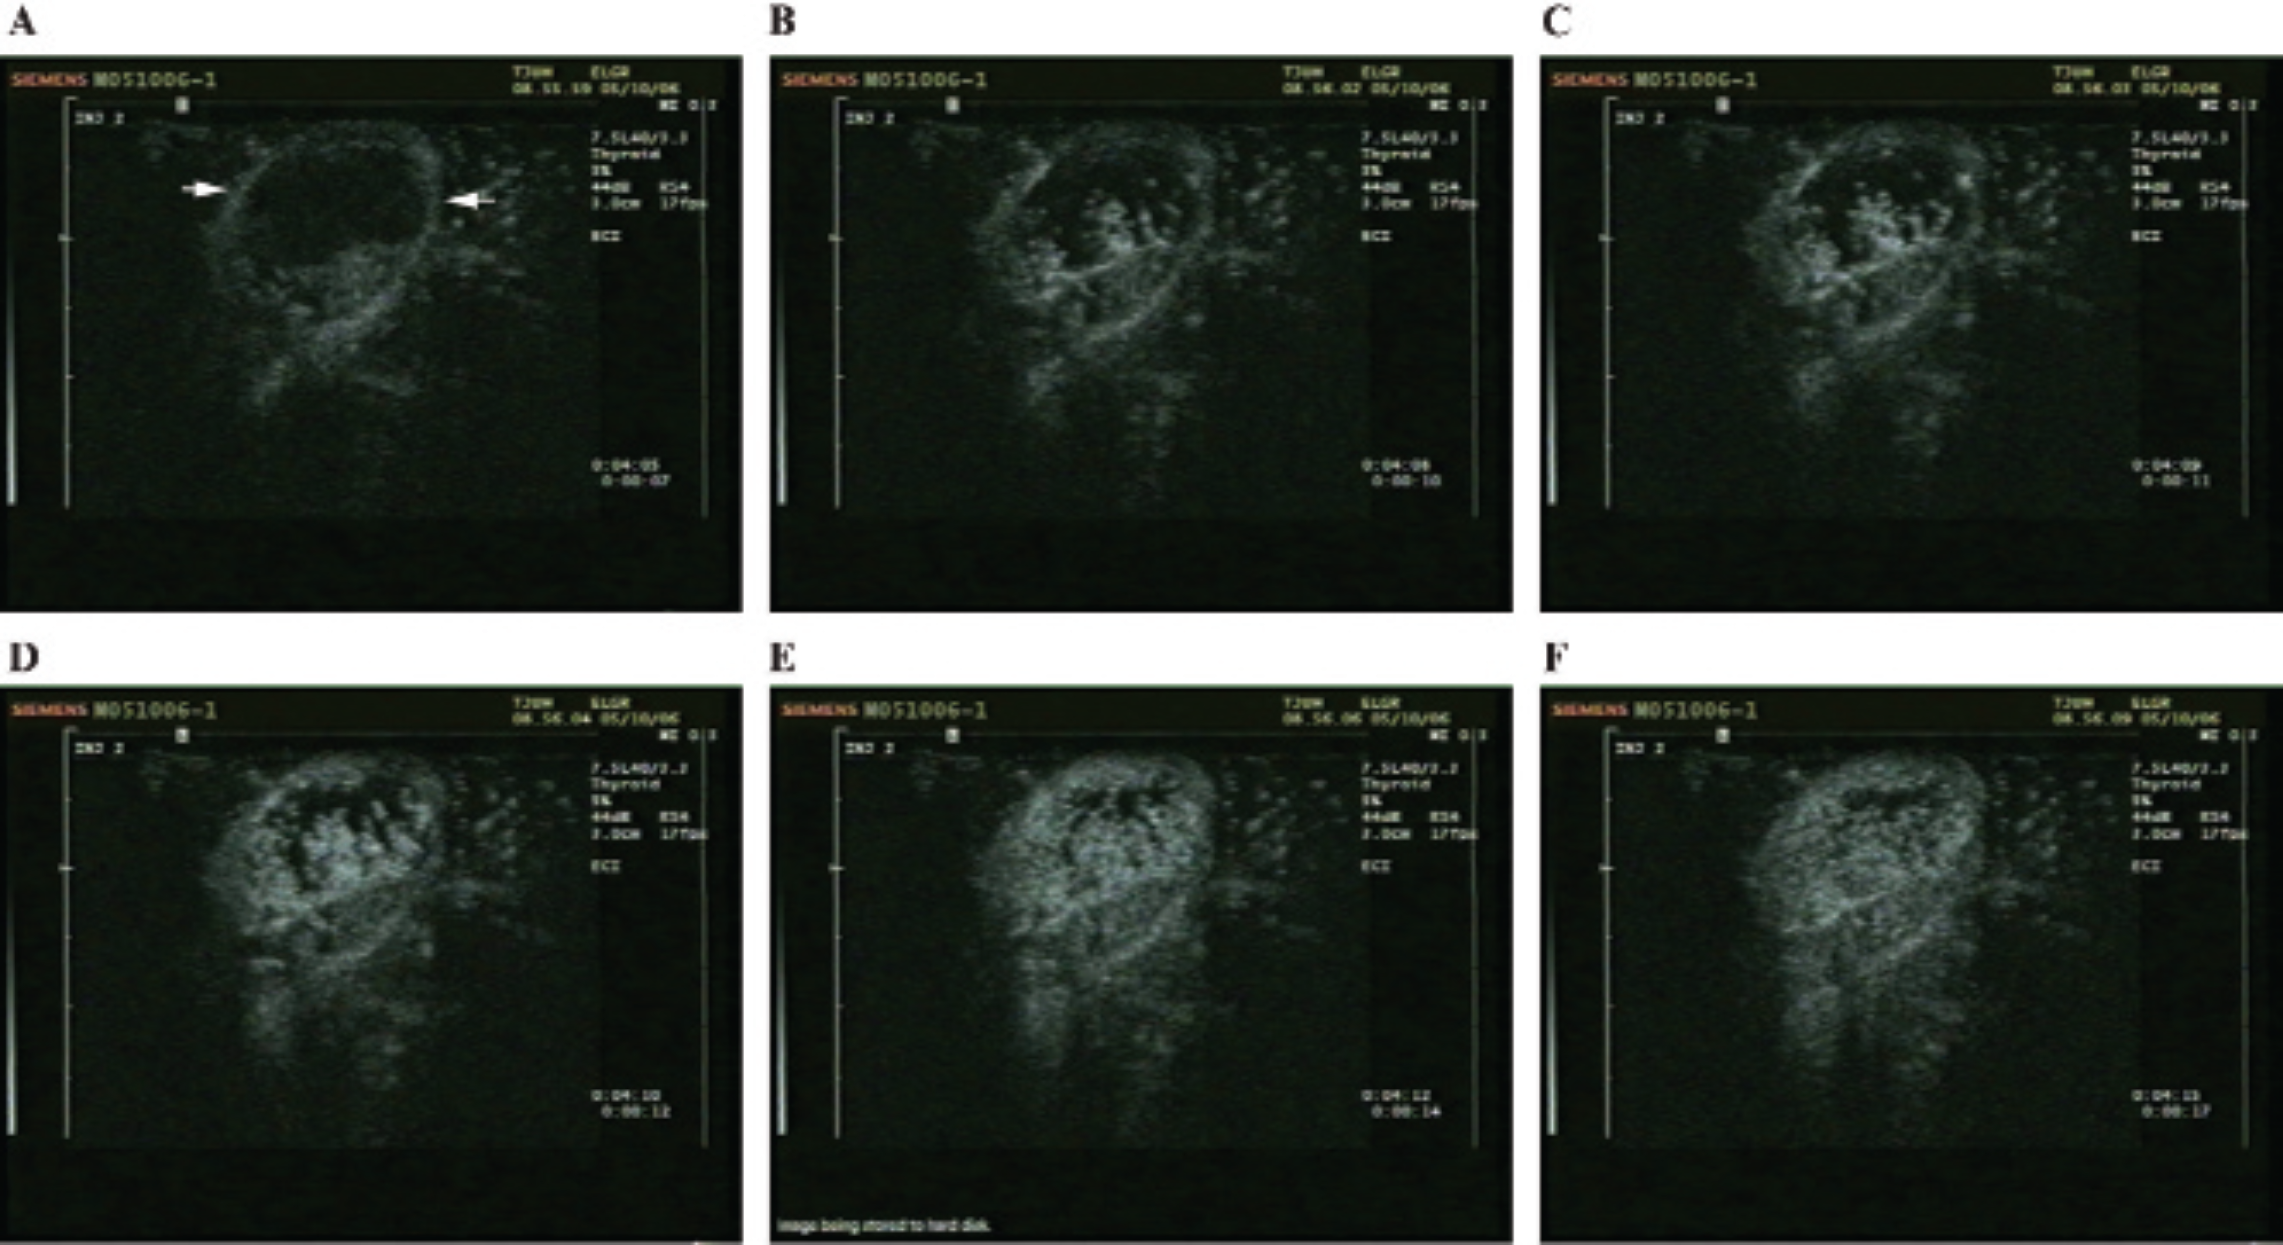
Mouse implanted with a DB-1 melanoma imaged in pulse inversion harmonic imaging mode and shown (A) 7 seconds postinjection (ie, at baseline) with the tumor marked by arrows, (B) after 10 seconds, (C) after 11 seconds, (D) after 12 seconds, (E) after 14 seconds, and (F) after 17 seconds. The gradual inflow of contrast bubbles over 10 seconds delineates the angiogenic tumor vasculature.

Representative examples of the histologic staining for control and treated groups with CD31(A, B), cyclooxygenase-2 (COX-2; C, D), vascular endothelial growth factor (VEGF; E, F), and glucose transporter 1 (Glut1) (G, H). Images are at 40X magnification.
In the VEGF Trap group, linear regression analysis yielded a strong correlation between tumor vascularity depicted with PDI and the percent area stained with CD31 and with COX-2 (r > .52; p < .007). Moreover, PDI and glucose transporter 1 (Glut1) were found to correlate (r = –.40; p = .047). Significant correlation was also found between intermittent PIHI and CD31 as well as COX-2 (r > .4; p ≤ .041) and for PIHI with COX-2 (r = .40; p = .048). In the Fc control group, VEGF was found to correlate with PDI as well as with intermittent PIHI (r ≥ .56; p < .05), whereas there was a trend toward significance between CD31 and PDI (r = .55; p = .052). No other comparisons were significant (p > .1). When the data were analyzed together (irrespective of treatment), there was a significant correlation between melanoma vascularity depicted with PDI and the percent area stained with VEGF (r = .34; p = .037; Table 1).
Regression Analysis (r Values) between CEUS (FVA) and Histology (n = 38)

CEUS = contrast-enhanced ultrasonography; COX-2 = cyclooxygenase-2; FVA = fractional vascularity; Glut1 = glucose transporter 1; PDI = power Doppler imaging; PIHI = pulse inversion harmonic imaging; VEGF = vascular endothelial growth factor.
The FVA and/or relative stained area obtained in the different groups were compared (Figure 4). A significant decrease in the expression of COX-2 (p = .017) and, in particular, CD31 (12.9 ± 13.7 % vs 0.6 ± 1.5 %; p = .0001) was found when comparing the VEGF Trap-treated group to the Fc control animals, whereas VEGF expression showed a small, but statistically significant, increase with treatment (4.4 ± 2.7% vs 6.0 ± 2.0%; p = .0493). There was also a statistically significant reduction in the FVA measured with intermittent PIHI in the VEGF Trap-treated group relative to the Fc control group (97.5 ± 0.4% vs 95.6 ± 2.6%; p = .014), whereas PIHI vascularity measurements showed a trend toward significance (93.7 ± 2.7% vs 91.1 ± 5.2%; p = .100). More flow was seen with PIHI (real time and intermittent) than with PDI (p < .0001). No other comparisons were significant (p > .68).

Fractional tumor vascularity, quantified based on contrastenhanced ultrasonography and immunohistochemical stains for Fc control and VEGF Trap-treated DB-1 tumors. COX-2 = cyclooxygenase-2; Glut1 = glucose transporter 1; PDI = power Doppler imaging; PIHI = pulse inversion harmonic imaging; PIHI int = intermittent pulse inversion harmonic imaging; VEGF = vascular endothelial growth factor.
Discussion
We have presented the first noninvasive CEUS study of the antiangiogenic VEGF decoy receptor VEGF Trap in the DB-1 melanoma model. Two new findings were established. First, CEUS measures of tumor vascularity appear to allow monitoring of the in vivo effects of VEGF Trap corresponding to the expression of CD31 and COX-2 (in this model). Second, our data provided an indication that VEGF Trap does not induce vascular normalization in DB-1 melanoma xenografts. However, these results were based on a relatively small sample size, and further studies are required to resolve these issues.
Other studies have attempted to visualize and quantify tumor angiogenesis using CEUS.19–23,26,30–36 Different antiangiogenic therapies, including recombinant interleukin-12 (BD Biosciences, San Jose, CA), 30 sunitinib (Pfizer Inc., New York, NY), 33 epirubicin (Pharmacia Co., Auyancourt, France), 32 DC101 (ImClone Systems, New York, NY), 31 and bevacizumab (Genentech Inc, San Francisco, CA),19,20,35,36 have been investigated using CEUS, but our study is the first to evaluate the antiangiogenic effects of VEGF Trap in the DB-1 melanoma model with CEUS. Recently, Eichten and colleagues reported on the only other study involving VEGF Trap treatment of murine xenografts (specifically Colo205 colorectal carcinoma, C6 glioblastoma, and HT1080 fibrosarcoma) with CEUS monitoring. 23 They found a decrease in perfusion and an increase in VEGF and hypoxia in two of the models (Colo205 and C6), which is generally in accordance with the results of the study reported here, but no effect of VEGF Trap treatment on HT1080 tumors. 23 However, the different tumor models and assessment times (up to 3 days for Eichten and colleagues versus 7 days in this study) make direct comparisons difficult. Although other groups have studied the vascular changes induced by VEGF Trap, these studies incorporated primarily invasive histologic techniques to validate their claims (and did not use a noninvasive imaging technique as in this study).37–41 The results of such histologic studies were generally in concurrence with the results of our study (eg, a reduction in tumor growth following VEGF Trap treatment).
It has been hypothesized that antiangiogenic therapies normalize structurally and functionally abnormal tumor vasculature and improve the tumor microenvironment, resulting in increased perfusion and decreased hypoxia, which in turn will allow for more efficient delivery of drugs and oxygen to the targeted cancer cells. 24 In this study, measures of tumor vascularity obtained by CEUS did not provide evidence in support of the vascular normalization hypothesis. As tumor volumes decreased in the VEGF Trap-treated group compared to controls, vascularity (as measured with PIHI) also decreased, whereas hypoxia and VEGF expression remained unchanged or increased (cf., Figure 4). These results are in agreement with the results obtained by Eichten and colleagues as well as other researchers in different preclinical xenograft models23,37 but do not match with the vascular remodeling demonstrated in OVCAR-3-inoculated mice (an ovarian cancer model) following VEGF Trap administration. 39 Moreover, vascular normalization or lack of the same could also be tumor model, drug context, and/or tumor stage dependent,23,42 and additional studies will be needed to resolve this issue.
One potential source of error in this study is the difficulty of accurately comparing histologic specimens to noninvasively obtained US images. Although great care was taken to match the stained slices to the CEUS imaging planes (such as scanning the specimens following excision), orientation can be offset during the many steps involved with processing the slide during the immunohistochemical staining procedures. One potential remedy would be to use three-dimensional CEUS instead because volume data sets will provide a more complete assessment of tumor vascularity.43,44 However, the US imaging planes still have slice thickness on the order of millimeters, whereas the pathology slides represent thickness on the micrometer scale, which may explain why one group recently reported no improvement between two- and three-dimensinal CEUS measures of tumor vascularity compared to histology. 45 Alternatively, a high-frequency small-animal imaging scanner could be used, but even systems operating at frequencies above 30 MHz have slice thickness on the order of 100 μm (ie, an order of magnitude greater than specimens). 46 Another limitation that must be considered is the small number of mice injected with the Fc control protein (three animals only). A larger sample size would provide more conclusive evidence of the viability of using CEUS as a monitoring tool for antiangiogenic therapies.
Additionally, murine xenograft tumor models do not mirror many of the events that take place in cancer patients. 2 For example, human tumors develop spontaneously based on genetic mutation and grow over the span of months to years while gradually accessing a blood supply. In contrast, xenografts grow to a large size, develop a vascular supply within weeks of injection, and do not have to contend with much of a host immune response. 2 This will not be the case when studying human tumors in vivo and may impact the translation of these results to future clinical practice. Nonetheless, initial results from human clinical trials using quantitative CEUS parameters to monitor changes in tumor vascularity following antiangiogenic therapies have been encouraging; presumably because such a study design allows patients to act as their own control over time. 47
Finally, a statistical limitation of this study is the multiple comparisons being conducted. To account for the statistically significant results in light of this, a Bonferroni correction may be applied, which assigns the traditional .05 p value divided by the number of comparisons to be the p value of significance. 48 On the other hand, there are also problems associated with Bonferroni correction. By controlling the group-wise error rate, each individual test is held to an unreasonably high standard and makes it likely that legitimately significant results will not be detected. 49 Hence, we chose not to adopt Bonferroni correction in this study.
Conclusion
CEUS has been shown to be a sensitive noninvasive method of evaluating tumor neovascularity in the DB-1 human melanoma xenograft model, as indicated by the strong correlation between CEUS and histologic measures of angiogenesis. Furthermore, the results of monitoring vascular changes in DB-1 tumors treated with VEGF Trap (compared to control groups) show that the antiangiogenic effects of VEGF Trap can be monitored in vivo using CEUS imaging.
Footnotes
Acknowledgments
We wish to thank Magdalena Potoczek of Thomas Jefferson University as well as Tony Magliocco and Alex Klimowicz of the Tom Baker Cancer Centre (Calgary, AB) for their assistance in creating the immunohistochemical stains.
Financial disclosure of authors: This research was financially supported by the RSNA Research and Education Foundation (to L.N. Nazarian) and National Institutes of Health grant R21 CA93907 (to F. Forsberg). Other support included contrast agent from GE Healthcare, and the US scanner on loan from Siemens Medical Solutions, as well as the VEGF Trap supplied by Regeneron Pharmaceuticals.
Financial disclosure of reviewers: None reported.