
Abstract

In the field of neuropsychiatry, conventional SPECT has been used in humans to perform quantitative measurement of brain neuroreceptor availability in vivo, making this technique valuable for the study of neuropsychiatric disorders such as depression, 2 schizophrenia, 3 and feeding disorders. 4 However, despite this demonstrated potential in humans, the use of SPECT in combination with animal models of neuropsychiatric diseases has barely been investigated. The rarity of efficient SPECT tracers for neuroreceptors is partly explaining this situation, and this paucity in tracers is in turn partly due to the stringency of the requirements on tracer pharmacokinetics for successful SPECT imaging.
The MDR1A transporters (also called P-glycoprotein or Pgp) are members of the ABC transporter superfamily 5 and are known to influence the kinetics of many pharmaceuticals, 6 notably by preventing them from crossing the blood-brain barrier, making them a potentially interesting target for the modulation of the pharmacokinetics of SPECT tracers. A variety of pharmacologic inhibitors have been developed to achieve the blockade of MDR1A transporters 7 ; however, in preclinical research, the use of knockout (KO) animals is also an interesting option because it offers the advantage of being a stable modification of the system, which is more convenient than a transient blockade of transporters by competitive inhibitors, when willing to study the pharmacokinetics of tracers.
Existing neuroreceptor SPECT tracers of the serotoninergic systems allow imaging in small animals with varying degrees of success (see Paterson and colleagues for a review 8 ). Our efforts have been focused on the tracers described hereafter. 123I-p-MPPI has shown some potential as a 5-hydroxytryptamine1A receptor (5-HT1AR) tracer in in vitro and ex vivo studies in rodents 9 as well as in vivo in monkeys. 10 The 5-HT1AR has, for example, been shown to participate in the regulation of feeding behavior 11 or in depression. 12 123I-R91150 is a selective 5- HT2AR ligand and has been successfully used for SPECT in the clinic. 13 The 5-HT2AR is notably thought to play a role in schizophrenia. 14 123I-SB207710 has shown some potential as a 5-HT4R tracer in vitro and ex vivo in rodents as well as in vivo in nonhuman primates. 15 The 5- HT4R has been involved, for example, in cognitive functions such as learning and memory. 16 123I-ADAM is a selective serotonin transporter (SERT) ligand 17 and has been successfully used in human SPECT studies. 2 The SERT is most notably known for its involvement in depression. 18
The main goal of this study was to compare the performances of this selection of serotoninergic radiotracers in both wild-type (WT) and Mdrla KO rats, to determine if the use of this genetically modified animal strain, with a more permissive blood-brain barrier, could result in improved SPECT imaging outcomes for certain tracers. Preliminary evaluations by ex vivo autoradiography were performed to obtain reference images for the in vivo SPECT images. The SPECT data obtained in WT and KO animals were compared by means of binding potentials. Additionally, modelization of the pharmacokinetics of 123I-R91150 using the Simplified Reference Tissue Model (SRTM) 19 was performed to provide insight into the effects of MDR1A on this tracer's kinetics.
Material and Methods
We followed the guidelines proposed by Stout and colleagues 20 to provide a detailed description of the methods used in this work.
Animals
Male Sprague Dawley Mdrla KO rats (SD-Abcba1tm1sage) 21 and WT controls of the same background weighing 300 to 350 g were obtained from Sigma Advance Genetic Engineering Labs (St. Louis, MO). Animals were housed in groups, with a 12 hours light/12 hours dark cycle, with water and food ad libitum. All animal experiments were approved by the Swiss Cantonal Veterinary Office. The size of the cohorts for the SPECT experiments can be seen in Table 1. The ex vivo autoradiographic experiments were performed on one subject per tracer. During SPECT scans, the body temperature and respiration rate were monitored. The body temperature was maintained at 37 ± 1°C with a thermostatically controlled heating blanket.
BPND at Equilibrium in Wild-Type and Knockout Animals *

BPND = nondisplaceable binding potential; KO = knockout; WT = wild type.
Determined as the ratio of mean activity in a tracer-relevant, receptor-rich region over the mean activity in the tracer-poor cerebellum region, minus 1. The target-rich regions, tracer and target wise, were 123I-p-MPPI/5-HT1AR, hippocampus; 123I-R91150/5-HT2AR, orbitofrontal cortex; 123I-SB207710/5-HT4R, olfactory tubercles; 123I-ADAM/SERT, midbrain; p value from an unpaired t-test.
Chemicals
123I radioiodide was purchased from GE Healthcare (Eindhoven, the Netherlands). SB207710 trimethyltin precursor and p-MPPI tributyltin precursor were obtained from Eras Labo (Grenoble, France). ADAM tributyltin precursor was obtained from Syntheval (Caen, France). R91150 precursor was synthesized by introducing 1-[3-(4-fluorophenoxy)propyl]-4-methylpiperidin-4-amine (0.40 g, 15 mmol), 22 dichloromethane (8 mL), 4-amino-2-methoxybenzoic acid (0.40 g, 18 mmol), 1-hydroxybenzotriazole (0.24 g, 15 mmol), and 3-(ethyliminomethyleneamino)-N,N-dimethylpropan-1-amine hydrochloride (0.34 g, 15 mmol) in a round-bottomed flask. The mixture was cooled to 0°C, and triethylamine (0.76 mL, 54 mmol) was added dropwise. The mixture was allowed to reach room temperature, stirred overnight, washed with water (3 × 20 mL), washed with brine (3 × 20 mL), dried over MgSO4, and evaporated. The crude was then purified by column chromatography using AcOEt/MeOH/NEt3 (99/1/1) as the eluant to afford 4-amino-N-{1-[3-(4-fluorophenoxy) propyl]piperidin-4-yl}-2-methoxybenzamide 22 (R91150 precursor) with 40% yield and to conform to analytical standards. All other chemicals were purchased from Sigma-Aldrich (Buchs, Switzerland), with the highest purity available, and were used without any further purification.
Radiotracer Preparation
All radiotracers were obtained by incubation of the specified reaction mixtures (see below) for 20 minutes at room temperature. Purification was conducted directly from the reaction mixture on a high-performance liquid chromatography (HPLC) system (Knauer GmbH, Berlin, Germany) with a reversed-phase column (Bondclone C18 10 μm 300 × 7.8 mm, Phenomenex, Schlieren, Switzerland) and eluted with the specified mobile phase (see below) at a flow rate of 3 mL/min. Fractions containing the radiolabeled compound of interest were collected and concentrated using a rotary evaporator, and the final product was diluted in saline prior to animal administration. During the HPLC run, ultraviolet absorbance and radioactivity were monitored, allowing for the measurement of specific activity thanks to calibration curves established with the cold reference compound. Specific activities of preparations were always above 20% of 123I carrier-free specific activity (ie, above 1,760 MBq/nmol). Radiochemical purities, assessed by HPLC, were above 98%.
123I-p-MPPI
Fifty micrograms of p-MPPI precursor in 50 μL ethanol was mixed with 50 μL of HCl 1 M, 15 μL of carrier-free 123I sodium iodide (10 mCi) in 0.05 M NaOH, and 50 μL of 3% H2O2. Purification was achieved by HPLC with a 10-minute gradient of 30 to 60% acetonitrile (ACN) in water with 7 mM H3PO4. Radiotracer retention time was 8.8 minutes.
123I-R91150
Three hundred micrograms of R91150 precursor in 3 mL ethanol was mixed with 3 mL of glacial acetic acid, 15 mL of carrier-free 123I sodium iodide (10 mCi) in 0.05 M NaOH, and 3 mL of 30% H2O2. 123I-R91150 was isolated by an isocratic HPLC run (ACN/water 50/50, 10 mM acetic acid buffer pH 5). The radiotracer retention time was 11.0 minutes.
123I-SB207710
Fifty micrograms of trimethyl stannyl precursor in 50 μL ethanol was mixed with 50 μL of 1 M HCl, 15 μL of carrier-free 123I sodium iodide (10 mCi) in 0.05 M NaOH, and 50 μL of 3% H2O2. 123I-SB207710 was isolated by isocratic HPLC (ACN/water 30/70, 7 mM H3PO4). The retention time of 123I-SB207710 was 9.3 minutes.
123I-ADAM
Fifty micrograms of ADAM precursor in 5 μL ethanol was mixed with 5 μL of 1 M HCl, 15 μL of carrier-free 123I sodium iodide (10 mCi) in 0.05 M NaOH, and 5 μL of 30% H2O2. 123I-ADAM was isolated by an isocratic HPLC run (ACN/water 60/40, 10 mM acetic acid buffer pH 5). The retention time was 12 minutes.
Dynamic SPECT Imaging
While maintained under isoflurane anesthesia (1.8-2.5%) with pure oxygen and installed in a U-SPECT-II imaging system (MILabs, Utrecht, the Netherlands), the animals received a bolus injection in the tail vein with 55 MBq of 123I-labeled radiotracer in 0.6 mL saline. The imaging system was fitted with a general purpose rat and mouse collimator (GP-RM, 75 pinholes of 1.5 mm diameter). The scan volume was kept to the minimum around the skull, and image frames of a length of 1 minute were acquired. Additionally, a phantom consisting of a 2 mL plastic tube containing a known activity concentration was scanned under the same conditions for the purpose of activity calibration. SPECT tomograms were reconstructed with a pixel ordered subsets expectation maximization algorithm 23 (P-OSEM, 0.4 mm voxels, 4 iterations, 6 subsets) using MILabs proprietary software and finally smoothed with a gaussian filter of 0.8 mm full width half maximum. SPECT data were corrected for radioactive decay; no correction of attenuation and scatter was applied.
Data Coregistration and Analysis
SPECT data were analyzed with PMOD software (PMOD Technologies, Zurich, Switzerland). SPECT data were manually coregistered to a region of interest (ROI) template for the rat brain (atlas provided in PMOD: “Px Rat (W. Schiffer)” 24 ) (Figure 1). The mean activity in each ROI was calculated for each frame to obtain time-activity curves. Left and right ROI of paired structures were considered as a whole, and the subregions of hippocampus and cerebellum were pooled: hereafter, hippocampus ROI refers to the combination of the template's anterior and posterior hippocampus ROI and cerebellum ROI refers to the combination of the gray and white matter cerebellum ROI. As a means of evaluating the imaging ability of tracers and to compare their performance in WT and KO animals, an estimate of the nondisplaceable binding potential (BPnd) 25 was obtained by calculating the value of the specific uptake ratio (SUR) during pseudoequilibrium. SUR is the ratio between the mean activity in a tracer-relevant receptor-rich region and in the tracer-poor cerebellum region, minus 1. The pseudoequilibrium interval was defined as the period during which SUR values remained stable, as described by Catafau and colleagues. 26 The target-rich regions, tracer and target wise, were 123I-p-MPPI/5- HT1AR, hippocampus; 123I-R91150/5-HT2AR, orbitofrontal cortex; 123I-SB207710/5-HT4R, olfactory tubercles; and 123I-ADAM/SERT, midbrain.

Sectional views of Schiffer and colleagues' rat brain region of interest atlas 24 with a reference MRI template.
123I-R91150 Pharmacokinetics Analysis
In the case of 123I-R91150, pharmacokinetic parameters were calculated from time-activity curves using the SRTM 19 in PMOD software, with cerebellum as a reference region. The SRTM relies on three parameters: R1 is the relative delivery to ROI compartments versus reference region (R1 = K1/K1'), k2 is the efflux constant from brain to plasma, and BPND SRTM is the nondisplaceable binding potential derived from the SRTM (BPnd SRTM = k3/k4).
Ex Vivo Autoradiography
WT rats were anesthetized with isoflurane, injected in the tail vein with ≈ 10 MBq of radiotracer and sacrificed by decapitation after 30 minutes for 123I-SB207710 and 123I-p-MPPI and after 60 minutes for 123I-R91150 and 123I-ADAM. The choice of the time points was based on preliminary experiments conducted at 30 and 60 minutes postinjection. The brains were quickly removed and frozen in precooled isopentane at –20°C. Twenty micrometer thick coronal sections were collected with a cryomicrotome (Leica) at –20°C. The sections were mounted on glass slides, air-dried at room temperature, and exposed to phosphor imaging plates overnight (Fuji Photo Film Co., Tokyo, Japan). Finally, the plates were scanned with a Fuji Bio-Imaging Analyzer BAS 1800II scanner (Fuji Photo Film Co.), at 50 μm resolution, to obtain the ex vivo autoradiograms. Image quantification was performed using ImageJ software (National Institutes of Health, Bethesda, MD) to obtain ex vivo SURs, which were calculated as the ratio between a target region and the tracer-poor cerebellum region, minus 1.
Results
When evaluated by ex vivo autoradiography in WT rats (Figure 2D), 123I-p-MPPI showed marked uptake (ex vivo SUR at 30 minutes postinjection) in hippocampus (0.43) and septum (0.37) and more modest uptake in amygdala (0.29), cortex (0.14), and hypothalamus (0.17). Meanwhile, cerebellum was showing a low level of tracer uptake. When evaluated in vivo, the time-averaged SPECT images obtained with 123I-p-MPPI showed a slightly superior imaging contrast in Mdr1a KO animals (Figure 2C) in comparison with WT animals (Figure 2B), as evidenced by the BPND calculated in hippocampus versus cerebellum (see Table 1), which was very small in WT animals (0.49 ± 0.25, mean ± SD) and was higher but not significantly different in KO animals (0.89 ± 0.52, mean ± SD, p = .224). The regional time-activity curves (Figure 2E) showed that the tracer brain uptake was approximately doubled in KO rats; however, the clearance from the brain remained fast in KO, and, as a result, activity levels in the 5-HT1AR-rich hippocampus region reached the levels observed in the 5-HT1AR-poor cerebellum region within an hour.

123I-p-MPPI brain distribution study. Anatomic atlas templates adapted from the Paxinos and Watson atlas 41 (A), time-averaged images of representative SPECT scans between 15 and 35 minutes after tracer injection in wild-type (WT) (B) and Mdrla knockout (KO) rats (C), ex vivo autoradiograms obtained 30 minutes after tracer injection in WT rats (D), and regional time-activity curves measured by SPECT after tracer injection (E). Color scales are relative and relevant to individual experiments. Acb = accumbens nucleus; Am = amgydala; BS = brainstem; Cb = cerebellum; Cx = cortex; HG = harderian gland; Hip = hippocampus; Hyp = hypothalamus; MB = midbrain; OFC = orbitofrontal cortex; Pit = pituitary gland; Spt = septum; Thal = thalamus.
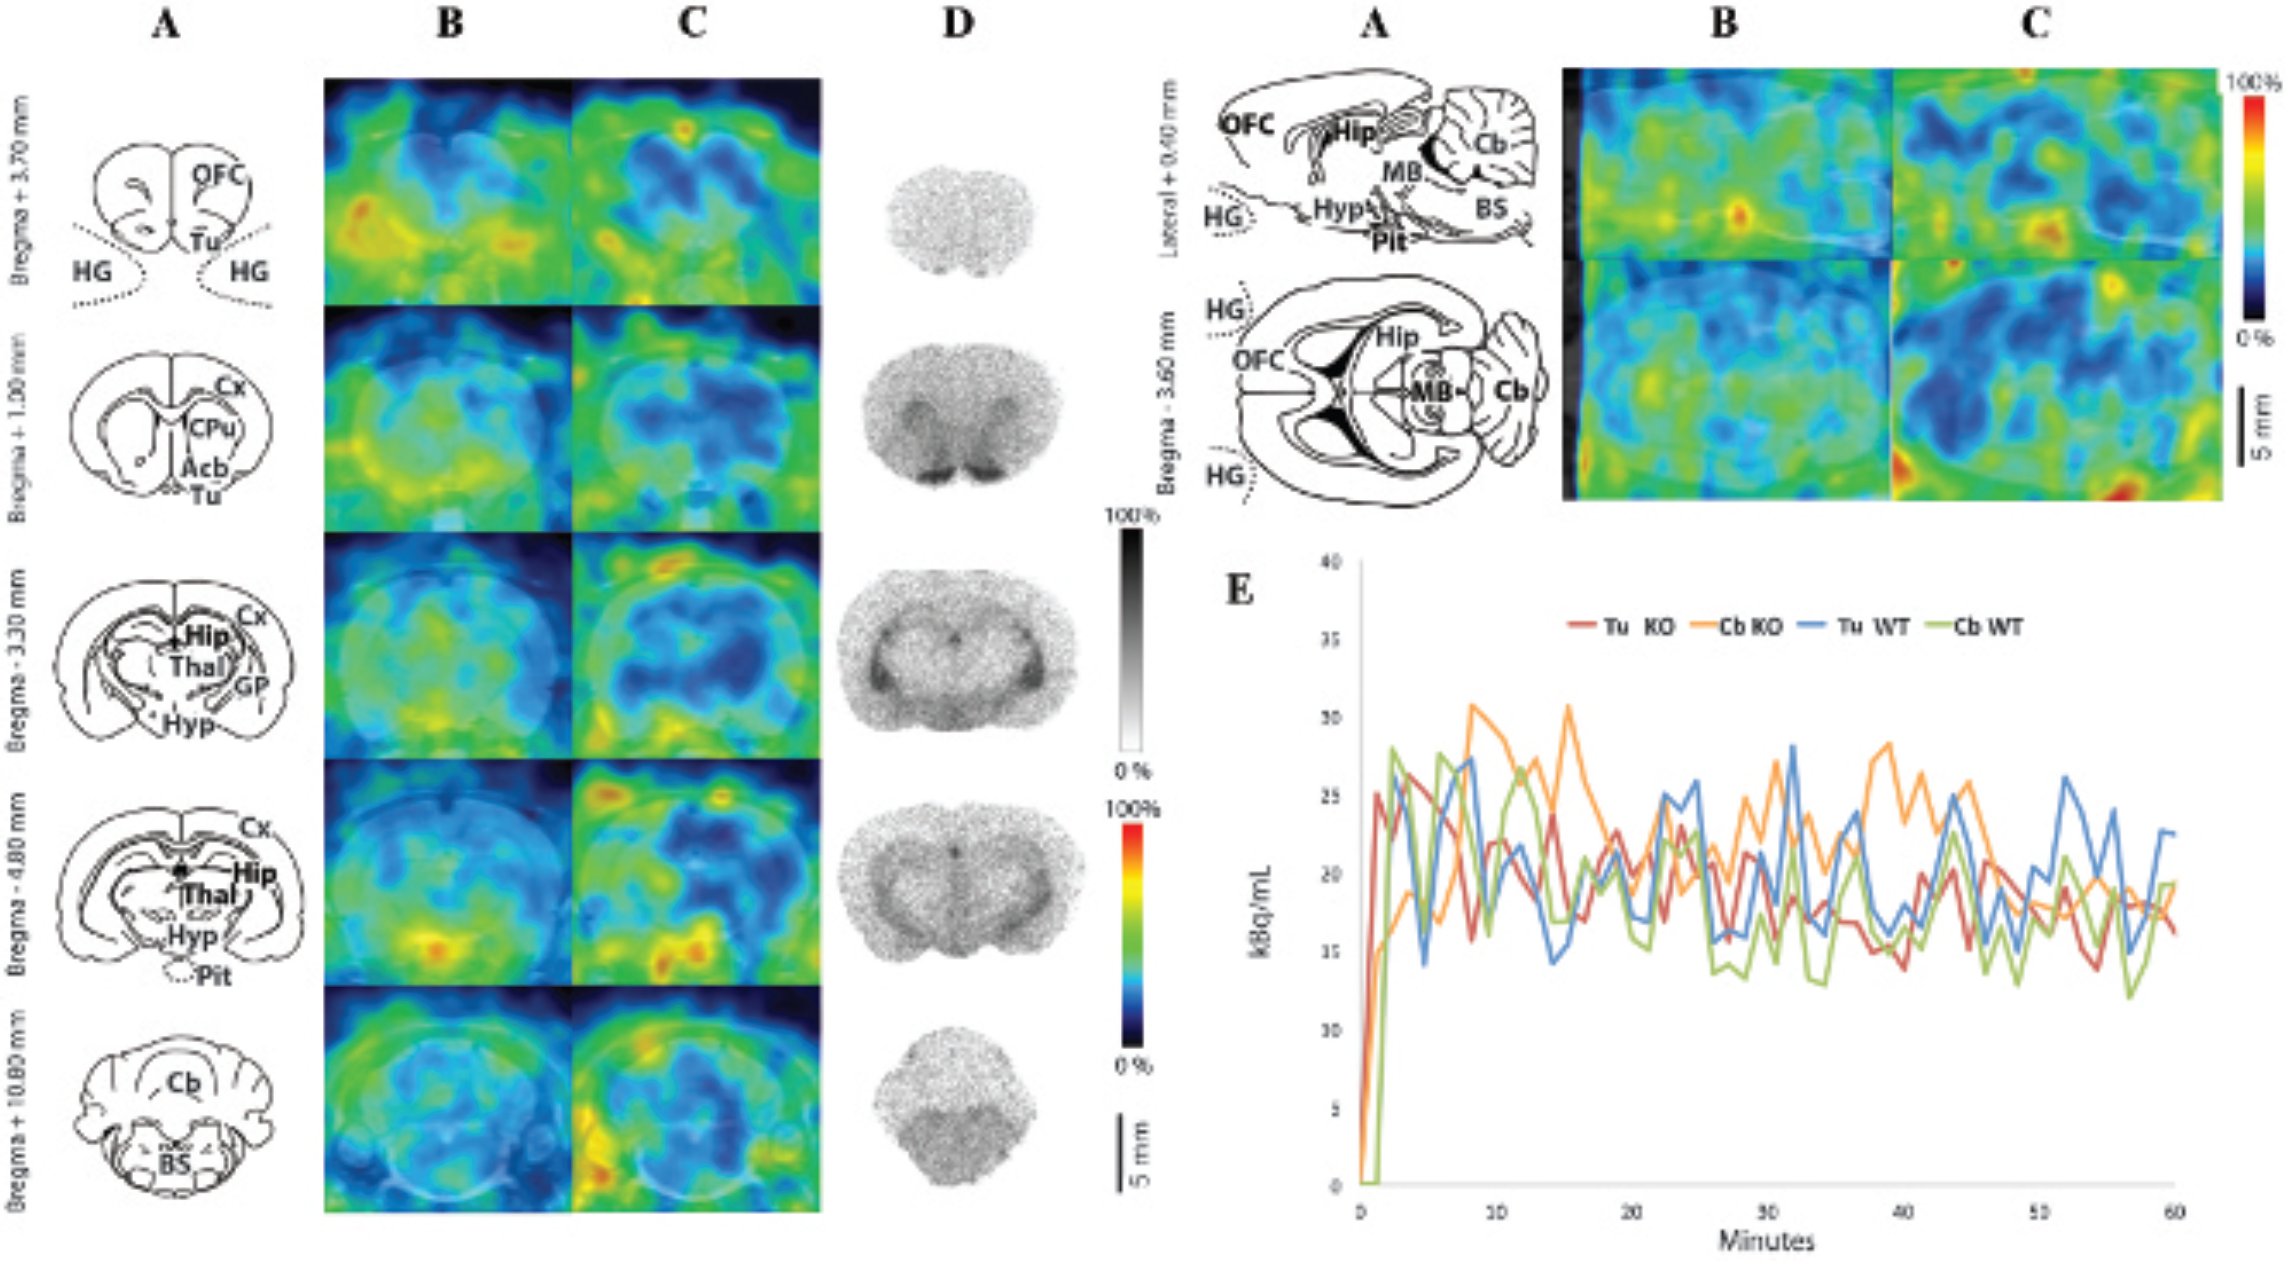
When evaluated by ex vivo autoradiography in WT rats (Figure 3D), 123I-R91150 showed highest uptake (ex vivo SUR at time 60 minutes postinjection) in frontal regions such as orbitofrontal cortex (0.70) and more moderate uptake in the rest of the cortex (0.52), midbrain (0.44), and hypothalamus (0.36). Meanwhile, cerebellum was showing a very low level of tracer uptake. When evaluated by in vivo imaging in WT rats, SPECT images showed low uptake of 123I-R91150 in brain and relatively higher uptake in the pituitary gland and harderian glands (Figure 3B). In KO animals, however, SPECT images showed a marked uptake in frontal regions and the rest of the cortex and relatively lower uptake in cerebellum (Figure 3C). The time-activity curves showed marked differences in tracer kinetics between KO and WT animals, with an approximately threefold increase in tracer uptake in the orbitofrontal cortex region of KO rats (Figure 3E). The BPND calculated for 123I-R91150 in the orbitofrontal cortex region versus cerebellum (see Table 1) was modest in WT animals (1.22 ± 0.26, mean ± SD) and was significantly higher in Mdr1a KO animals (3.98 ± 0.65, mean ± SD, p < .002) animals. The effect of MDR1A proteins on 123I- R91150 kinetics was also apparent in the variation of SRTM parameters derived for the orbitofrontal cortex region with cerebellum as reference, as Table 2 also shows an increase in BPND SRTM by a factor of around 3 in KO compared to WT animals. However, no significant variations were observed between the two animal strains in brain efflux rates (k2) or target versus reference delivery rates (R1). Fitting other ROIs using SRTM also revealed markedly higher BPND SRTM in other frontal regions of KO rats, such as medial prefrontal cortex and frontal cortex (Figure 4). However, the BPND SRTM observed in the hypothalamus and entorhinal cortex regions was higher in WT rats compared to KO animals. Overall, the in vivo 123I-R91150 SPECT data from KO rats (see Figure 3C) visually correlated well with ex vivo autoradiograms (see Figure 3D), whereas SPECT images in WT rats were dwarfed by activity accumulation in the harderian glands and in the pituitary gland (see Figure 3B).
123I-R91150 SRTM Parameters Obtained in Orbitofrontal Cortex with Cerebellum as a Reference Region

BPND = nondisplaceable binding potential; KO = knockout; SRTM = Simplified Reference Tissue Model; WT = wild type. p Value from an unpaired t-test.

123I-R91150 brain distribution study. Anatomic atlas templates adapted from the Paxinos and Watson atlas 41 (A), average SPECT images between 100 and 120 minutes after tracer injection in wild-type (WT) (B) and Mdr1a knockout (KO) rats (C), ex vivo autoradiograms obtained 60 minutes after tracer injection in WT rats (D), and regional time-activity curves measured by SPECT after tracer injection (E). Color scales are relative and relevant to individual experiments. Acb 5 accumbens nucleus; Am 5 amgydala; BS 5 brainstem; Cb 5 cerebellum; Cx 5 cortex; HG 5 harderian glands; Hip 5 hippocampus; Hyp 5 hypothalamus; MB 5 midbrain; OFC 5 orbitofrontal cortex; Pit 5 pituitary gland; Spt 5 septum; Thal 5 thalamus.
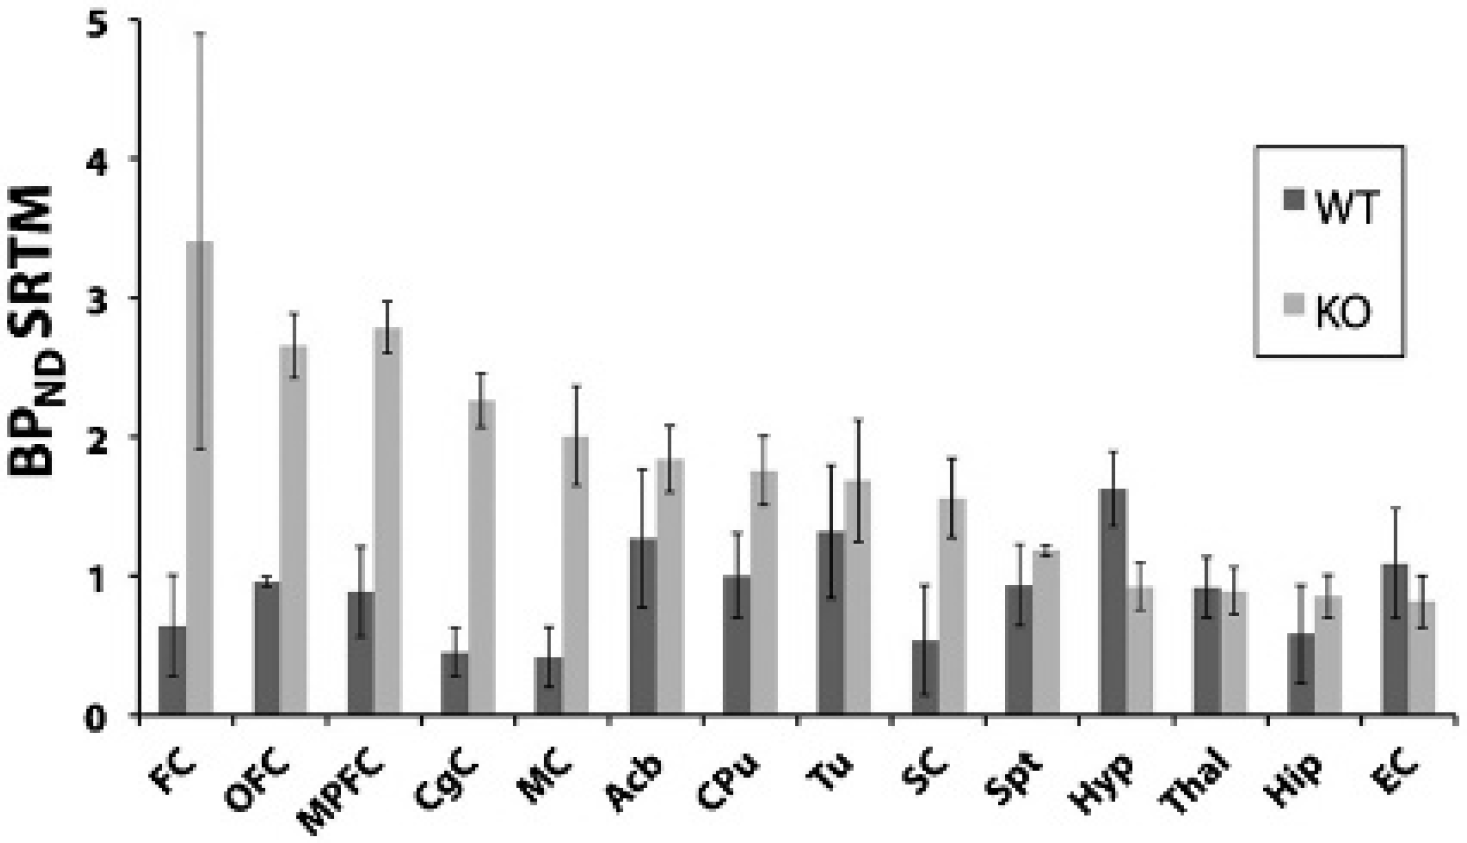
I-R91150 nondisplaceable BP (mean ± SD) observed by fitting the Simplified Reference Tissue Model (SRTM) to time-activity curves extracted from WT (n = 4) and KO (n = 4) regions of interest adapted from Schiffer and colleagues' ROI template. 24 Acb = accumbens nucleus; BPND = nondisplaceable binding potential; CgC = cingulate cortex; CPu = caudate putamen; EC = entorhinal cortex; FC = frontal cortex; Hip = hippocampus; Hyp = hypothalamus; MC = motor cortex; MPFC = medial prefrontal cortex; OFC = orbitofrontal cortex; SC = somatosensory cortex; Spt = septum; Thal = thalamus; Tu = olfactory tubercles.
When evaluated by ex vivo autoradiography in WT rats (Figure 5D), 123I-SB207710 accumulated markedly (ex vivo SUR at time 30 minutes postinjection) in the olfactory tubercles (1.48) and globus pallidus (1.13) and to a lesser extent in the hypothalamus (0.75), accumbens nucleus (1.14), caudate putamen (0.78), and hippocampus (0.58). Meanwhile, cerebellum showed a very low level of tracer uptake. After injection of 123I-SB207710, virtually no specific SPECT signal was detected in vivo in the brain of either WT (Figure 5B) or Mdr1a KO animals (Figure 5C). In Table 1, the BPND calculated from mean activity in the olfactory tubercle region versus cerebellum was negligible in WT animals (0.09 ± 0.03, mean ± SD) and not significantly different from that observed in Mdr1a KO animals (0.11 ± 0.06, mean ± SD, p = .568). Moreover, the time-activity curves of any ROI were practically indistinguishable from each other (Figure 5E).
123I-SB207710 brain distribution study. Anatomic atlas templates adapted from the Paxinos and Watson atlas 41 (A), average SPECT images between 30 and 60 minutes after tracer injection in wild-type (WT) (B) and Mdr1a knockout (KO) (C) rats, ex vivo autoradiograms obtained 30 minutes after tracer injection in WT rats (D), and regional time-activity curves measured by SPECT after tracer injection (E). Color scales are relative and relevant to individual experiments. Acb = accumbens nucleus; BS = brainstem; Cb = cerebellum; CPu = caudate putamen; Cx = cortex; GP = globus pallidus; HG = harderian gland; Hip = hippocampus; Hyp = hypothalamus; MB = midbrain; OFC = orbitofrontal cortex; Pit = pituitary gland; Thal = thalamus; Tu = olfactory tubercles.
When evaluated by ex vivo autoradiography in WT rats (Figure 6D), 123I-ADAM showed marked uptake (ex vivo SUR at 60 minutes postinjection) in hypothalamus (0.88) and midbrain (0.93) and a slightly dimmer uptake in numerous other regions, including olfactory tubercles (0.76), septum (0.78), thalamus (0.72), hippocampus (0.52), globus pallidus (0.81), and pons (0.71). Meanwhile, cerebellum was showing a very low level of tracer uptake. When evaluated by in vivo imaging, time-averaged 123I-ADAM SPECT images showed significant brain uptake with similar levels in both WT (Figure 6B) and KO animals (Figure 6C) and exhibited preferential uptakes in hypothalamus and midbrain and lower uptake in cerebellum, which is in accordance with the ex vivo autoradiograms (see Figure 6D). The BPND calculated from mean activity in the midbrain ROI versus cerebellum (see Table 1) was moderate in WT animals (1.27 ± 0.02, mean ± SD) and not significantly different from that observed in Mdrla KO animals (1.31 ± 0.09, mean ± SD, p = .393). The regional time-activity curves (Figure 6E) showed no clear difference in the kinetics of 123I-ADAM between the two animal strains.

123I-ADAM brain distribution study. Anatomic atlas templates adapted from the Paxinos and Watson atlas 41 (A), average SPECT images between 70 and 90 minutes after tracer injection in wild-type (WT) (B) and Pgp knockout (KO) rats (C), ex vivo autoradiograms obtained 60 minutes after tracer injection in WT rats (D), and regional time-activity curves measured by SPECT after tracer injection (E). Color scales are relative and relevant to individual experiments. Acb = accumbens nucleus; BS = brainstem; Cb = cerebellum; Cx = cortex; HG = harderian gland; Hip = hippocampus; Hyp = hypothalamus; MB = midbrain; OFC = orbitofrontal cortex; Pit = pituitary gland; Thal = thalamus.
Discussion
The 5-HT1AR tracer 123I-p-MPPI gave ex vivo autoradiogram results in agreement with the work of others 9 ; however, the quality of the SPECT images obtained in vivo was hampered by the tracer short residence time in target-rich regions. Overall, the use of this tracer for small-animal SPECT neuroimaging will be hindered by its fast washout from target brain regions, in both WT and Mdr1a KO rats. The short retention time of tracer in the target-rich regions could be explained by a fast dissociation rate from the target receptor. Nevertheless, the regional time-activity curves showed a pattern of distribution that coincided with the tracer distribution observed ex vivo, with higher uptake in hippocampus compared to cerebellum. The 18F-MPPF, a positron emission tomographic (PET) analogue of 123I-p-MPPI, has been successfully used for 5-HT1AR imaging in small animals, 27 and other investigators have reported a two- to threefold increase in its brain uptake, using ex vivo autoradiography, when administered to Mdr1a KO mice. 28 Our in vivo SPECT data show a similar increase in the iodinated 123I-p-MPPI ligand brain uptake in Mdr1a KO animals, indicating that this ligand is subject to efflux transport by MDR1A proteins, just like its fluoride analogue. However, this enhanced brain penetration did not significantly improve the imaging contrast observed by SPECT in KO animals.
Our data for the 5-HT2A receptor ligand 123I-R91150 show that the in vivo quantification of 5-HT2AR in WT animals is compromised by the low brain uptake of tracer and by the strong accumulation of activity that occurs in harderian glands and the pituitary gland, making neighboring brain regions prone to spillover and falsely elevated binding potentials. In contrast, SPECT data from Mdr1a KO rats corresponded remarkably well with ex vivo autoradiograms, allowing a more trustworthy quantification of 5-HT2ARs.
The ex vivo distribution was in agreement with the literature, 29 with a pronounced binding in cortex, especially in frontal cortical regions. However, the brain uptake in WT animals was relatively low compared to that in KO animals, in which the tracer kinetics was radically modified with an approximately threefold increase in brain uptake. As a result, the correlation between the tracer distributions observed by SPECT versus ex vivo autoradiography was higher in KO animals compared to WT animals (determination coefficient R2 = .9 in KO versus R2 = .2 in WT animals).
However, the comparison of pharmacokinetic parameters derived for 123I-R91150 using SRTM in both WT and Mdr1a KO rats surprisingly showed no significant variation in the tracer efflux rate from brain tissue (k2): indeed, given the function of the MDR1A proteins, consisting in transporting substrates outside from brain tissue, a decrease in k2 value in KO animals could have been expected. Other studies have suggested that MDR1A proteins have the ability to extrude substrates directly from the plasma membrane, 30 thus effectively interfering simultaneously with both tissue uptake rate (K1) and tissue efflux rate (k2). Moreover, the time scale on which the efflux transport occurs at the molecular level is much more rapid than the time resolution of the SPECT acquisition, 31 making it impossible to completely distinguish between a decrease in k2 and an increase in K1, due, for instance, to MDR1A inhibition or loss of function. Thus, it is plausible that MDR1A absence predominantly induces an increase in K1 and would explain why no significant alteration in k2 is detected when comparing KO and WT animals. However, the SRTM only allows access to the ratio of delivery rates in target ROI over reference region (R1). In our case, we observed no change in the value of R1, indicating that delivery rates in both target and reference regions were affected in a proportional way by MDR1A. This observation is in agreement with the work of Seegers and colleagues, 32 which showed that MDR1A is expressed at comparable levels in frontal cortex and cerebellum. Nevertheless, the time-activity curves clearly showed higher tracer uptake in both cerebellum and orbitofrontal cortex of KO animals, thus strongly suggesting an increased delivery rate in the KO condition. Further pharmacokinetic modeling experiments with blood sampling will be needed to precisely quantify the impact of MDR1A protein expression on tissue brain delivery (K1). Finally, the BPND SRTM values were higher in most ROI of Mdr1a KO compared to WT animals, except in ROI adjacent to the harderian glands or the pituitary gland. Indeed, in the case of WT animals, these extracerebral organs took up a significant amount of activity; thus, activity spillover from these glands could explain why superior BPND SRTM were recorded in the entorhinal cortex or hypothalamus of WT animals. Nevertheless, these regions set apart, our data clearly show that 123I-R91150 brain uptake is delivery limited: regional uptake depends mostly on the crossing of the blood-brain barrier (K1).
One other spectacular effect of the absence of MDR1A proteins is the disappearance of signal from the harderian glands in KO animal 123I-R91150 SPECT scans. These glands, however, are indeed anatomically present in the KO strain; thus, our results suggest that MDR1A proteins are expressed in the harderian glands, where they are responsible for a nonspecific accumulation of the tracer and/or its radiometabolites. The presence of MDR1A proteins in the harderian glands would not be surprising as the Mdr1a gene is known for its widespread expression, 33 and it has been reported that at least one other transporter of the same ABC superfamily is expressed in the harderian glands, 34 where it plays a role in the excretion of protoporphyrin metabolites.
The very clear difference in the distribution pattern of 123I-R91150 between Mdr1a KO and WT animals also suggests that this tracer might be an interesting tool to quantify the activity of MDR1A transporters in vivo. Indeed, 123I-R91150 has already been successfully used in humans in a number of studies, 8 and it has been reported to undergo only little metabolization in humans 26 ; moreover, we reported here a significant threefold increase in brain signal in Mdr1a KO animals, and others even reported a fivefold increase in brain uptake with the use of 50 mg/kg cyclosporine as an MDR1A proteins inhibitor. 35 According to the criteria defined by Kannan and colleagues, 30 these properties suggest that 123I-R91150 would be a suitable SPECT tracer to quantify efflux proteins function in vivo in humans. Nowadays, the assessment of efflux protein function is attracting growing attention as a means to predict the response to certain pharmacologic treatments, notably anticancer therapies, and to study the influence of blood-brain barrier integrity on brain physiology. 36 Thus, the assessment of MDR1A transporters function could one day be useful for clinical practice. Currently, such studies are usually performed with PET tracers, most frequently using [11C]-verapamil, 37 but in the future, the use of a SPECT imaging alternative might be more convenient as SPECT is a more widespread, cheaper, and slightly less cumbersome technique than PET.
The 5-HT4R tracer 123I-SB207710 gave ex vivo autoradiograms in agreement with the results found in the literature, 38 showing a marked labeling of 5-HT4R-rich regions; however, this tracer did not yield enough cerebral signal in either WT or Mdr1a KO rats to be useful for in vivo SPECT scans. Other evidence suggests that this tracer brain uptake is limited by different causes than MDR1A-mediated efflux: indeed, it has been reported by Marner and colleagues that the 123I-SB207710 PET analogue 11C-SB207145 is quickly metabolized in human plasma and that this degradation is prevented by plasmatic esterase inhibitors. 39 Both 123I-SB207710 and its PET analogue are esters, and in an ex vivo experiment, we observed a threefold increase in the rat brain uptake after pretreatment with plasmatic esterase inhibitors (data not shown). Although the SPECT data showed similar brain uptake in both animal strains, it cannot be concluded from this experiment whether this tracer is a substrate of MDR1A proteins or not as the recorded signals were not significantly above noise. Taken together, these data indicate that, whether or not 123I-SB207710 undergoes efflux by MDR1A, this is not the main reason why its use in small-animal SPECT neuroimaging is intractable. It shows, however, that 123I-SB207710 in vivo brain penetration is significantly reduced, indirectly, owing to its fast metabolism by plasmatic esterase.
The SERT tracer 123I-ADAM gave ex vivo autoradiogram results in accordance with the literature, 17 with intense binding notably in thalamus and hypothalamus among other brain areas known to be enriched in 5-HT neuronal elements. 40 The SPECT scans showed sufficient brain uptake, allowing for the recording of meaningful images in both WT and Mdr1a KO animals. No significant difference in 123I-ADAM pharmacokinetics was observed in Mdr1a KO rats, indicating that it is not a substrate for this transporter. Overall, this tracer showed favorable kinetics for SPECT neuroimaging in both WT and Mdr1a KO animals.
Conclusion
The advent of small-animal SPECT scanners has offered unprecedented opportunities for the noninvasive study of animal models of disease. However, application of this technology to the field of preclinical neuroimaging is limited by the availability of tracers with suitable pharmacokinetics. We reported here on the evaluation of a selection of serotoninergic tracers of potential interest for small-animal SPECT neuroimaging. Tracers such as 123I- SB207710 and 123I-p-MPPI are efficient tools for ex vivo or in vitro studies, but their pharmacokinetics do not make them ideal tracers for preclinical SPECT neuroimaging. The SERT tracer 123I-ADAM showed decent brain uptake regardless of Mdr1a expression and appeared suitable for preclinical SPECT neuroimaging in WT animals. Although 123I-R91150 uptake was readily detectable in SPECT scans of WT animals, tracers that are MDR1A substrates, such as 123I-R91150, might benefit from the use of Mdr1a KO animals and see a significant increase in their brain penetration, making Mdr1a KO strains an interesting option when considering SPECT neuroimaging studies in rats. This study also suggests that 123I-R91150 could be a convenient tool for assessing the function of MDR1A proteins at the blood-brain barrier.
Footnotes
Acknowledgment
Financial disclosure of the authors: This work was supported by the Swiss National Science Foundation (grant no. 310030_120369), the Geneva Neuroscience Centre, and the Ernst and Lucie Schmidheiny Foundation. The authors are grateful for the contributions of the BioPark Platform in Archamps, the Fondation Caisse d'Epargne Rhone-Alpes, the ABC laboratory of the European Scientific Institute (ESI) and the Association IFRAD Suisse, which was created in 2009 at the initiative of the Fondation pour la Recherche sur Alzheimer (formerly IFRAD France). We also thank the Conseil Regional de Basse Normandie for its financial support.
Financial disclosure of reviewers: None reported.