
Abstract
Cancer cells with a high metastatic potential will more likely escape and form distant tumors. Once the cancer has spread, a cure is rarely possible. Unfortunately, metastasis often proceeds unnoticed until a secondary tumor has formed. The culprit is that current imaging-based cancer screening and diagnosis are limited to assessing gross physical changes, not the earliest cellular changes that drive cancer progression. The purpose of this study is to develop a novel noninvasive magnetic resonance (MR) cellular imaging capability for characterizing the metastatic potential of breast cancer and enable early cancer detection. This MR method relies on imaging cell uptake of manganese, an endogenous calcium analogue and an MR contrast agent, to detect aggressive cancer cells. Studies on normal breast epithelial cells and three breast cancer cell lines, from nonmetastatic to highly metastatic, demonstrated that aggressive cancer cells appeared significantly brighter on MR as a result of altered cell uptake of manganese. In vivo results in nude rats showed that aggressive tumors that are otherwise unseen on conventional gadolinium-enhanced MR imaging are detected after manganese injection. This cellular MR imaging technology brings a critically needed, unique dimension to cancer imaging by enabling us to identify and characterize metastatic cancer cells at their earliest appearance.
To achieve early detection and characterization of breast cancer metastatic potential, we must assess activity at the cellular level. Cancer aggressiveness is known to be associated with altered control of cell proliferation, differentiation, migration, and apoptosis, which are among many processes regulated by the calcium ion.3–5 Generally, increased intracellular calcium is needed to meet higher calcium demands during cancer proliferation 3 and migration.6,7 Calcium influx has been shown to be greater in breast cancers, and some studies have traced this to higher expressions of calcium channels.8,9 The calcium-sensing receptor (CaSR), in particular, has garnered recent interest in the role of calcium as an extracellular first messenger in promoting cancer, particularly those that metastasize to bone (eg, breast, prostate). CaSR is expressed in many normal tissues, including breast 10 and bone, 11 and has been shown to drive the progression and metastasis of breast, 12 prostate, 13 and various other cancers. 14 A recent study of different breast cancer cell lines confirmed a strong correlation between CaSR expression and metastatic potential as well as migratory response. 8
Manganese (Mn) ion may be used to probe calcium activity as Mn is a calcium analogue and an essential metal that can enter cells through the same ion channels. 15 Mn is also a magnetic resonance (MR) contrast agent that generates a positive (ie, bright) signal. Application of Mn-enhanced MRI to cancer dates back to 1986, 16 and most publications are reports on the use of metalloporphyrins that are recognized for their affinity for cancer.17–20 However, the precise mechanism for its uptake is still not fully understood. The route of entry may vary depending on the porphyrin structure, but it is generally known that hydrophobic porphyrins permeate cells through passive diffusion. In contrast to porphyrins, Mn chloride, or more precisely the Mn2+ cation, is believed to enter cells through calcium channels. However, there have been far fewer applications of Mn chloride to cancer studies, with the first report in 1993. 21 Since then, there have been only a few reports, with some noting a difference in Mn uptake between malignant and normal cells.22–25 In breast cancer cells, it was shown in MCF7 and MDA-MB-231 tumor models that regions of significant Mn enhancement on MRI correlated with strong expression of CaSR 26 ; however, they did not compare enhancement between the two cell lines, nor was Mn uptake quantified. Recently, Nofiele and Cheng observed for the first time that breast cancer cells with higher metastatic potential could be distinguished on Mn-enhanced MRI. 27 However, it remains to be determined if signal enhancement is related to Mn uptake by cancer cells and what mechanisms underlie differential Mn uptake.
In this study, we explored in greater depth the observation reported in Nofiele and Cheng 27 to understand better the potential relationship between Mn-induced MRI contrast and the metastatic potential of a variety of breast cancers. Our hypothesis was that the aggressiveness of cancer cells can be assessed noninvasively on MRI through differences in cell uptake and retention of Mn. Quantitative MRI studies and absolute quantification of Mn cellular concentration were performed on nontumorigenic breast epithelial cells (MCF10A) and three different breast cancer cell lines, from nonmetastatic to highly metastatic: ZR-75-1, MCF7, and MDA-MB-231. The possible involvement of CaSR was tested as a first step toward understanding the mechanism of Mn uptake. Preliminary in vivo results in nude rats demonstrate the ability of Mn-enhanced MRI to detect MDA-MB-231 tumors even before changes appear on conventional gadolinium (Gd)-enhanced imaging. The overall goal is to confirm our proposition that Mn-enhanced MRI is a sensitive and specific high-resolution cellular imaging technique for characterizing the metastatic potential of a variety of breast cancers to achieve early cancer detection.
Materials and Methods
Cell Cultures
Three human breast cancer cell lines in order of increasing aggressiveness were studied: ZR-75-1, MCF7, and MDA-MB-231. A nontumorigenic breast epithelial cell line, MCF10A, was included as a control. All cell lines were obtained from ATCC (American Tissue Culture Collection, Manassas, VA). MDA-MB-231 is a triple negative breast cancer (ie, estrogen receptor negative [ER]/progesterone receptor negative [PR]/Her2 negative) and the most difficult to treat, whereas MCF7 and ZR-75-1 (ER positive/PR positive/Her2 negative) are amenable to hormone therapy. 28 All cells were grown at 37°C with 5% CO2 in 1640-RPMI medium (Sigma-Aldrich Canada, Oakville, ON) supplemented with 10% fetal bovine serum and 0.5% penicillin streptomycin. MCF10A cells were grown in MEGM (Lonza, Walkersville, MD) supplemented with 2 mL bovine pituitary extract (BPE), 0.5 mL human epidermal growth factor, 0.5 mL insulin, 0.5 mL hydrocortisone, and 100 ng/mL cholera toxin (Sigma-Aldrich Canada). Cells were harvested by washing 80 to 90% confluent flasks with phosphate-buffered saline (PBS) and adding 0.05% trypsin ethylenediaminetetraacetic acid (EDTA) (Gibco, Carlsbad, CA) to detach cells. Cells were centrifuged at 440g for 10 minutes to create cell pellets.
Growth curves were generated through the exponential growth phase and into the plateau growth phase for all cell lines (Figure 1). Approximately 105 adherent cells were plated on several cell culture dishes. Every day, one dish was trypsinized and a cell count was taken. The medium was changed every 4 days to simulate normal growth conditions. Note that the initial latent phase is characterized by slow growth due to recovery from trypsinization and the plateau phase from overcrowding. All cancer cell lines grew at a rate consistent with their metastatic potential. The basal cell line, MCF10A, had the second fastest growth rate as the culture medium conditions (supplemented with various growth hormones and cholera toxin) were necessarily different from those for the cancer cell lines.

Growth characteristics of breast cancer cell lines. Logarithmic growth curves of all cell lines showing the initial latent phase, the exponential phase, and the plateau phase. Arrows indicate the beginning and end of the logarithmic growth phase for each cell line. Measurements represent mean and standard deviation (n = 5).
Cell Labeling with Mn and Viability
Medium containing varying concentrations of manganese(II) chloride tetrahydrate (MnCl2) (Sigma-Aldrich Canada) was added to cells growing in the exponential growth phase for 1 hour, after which cells were rinsed with fresh medium or trypsinized as described above. To determine if labeling with MnCl2 had cytotoxic effects, cell viability was assessed using trypan blue exclusion test and cell morphology was observed on light microscopy.
Quantification of Intracellular Mn Content
To quantify the amount of Mn2+ inside cells after cell labeling, a known number of cells were centrifuged at 440g for 10 minutes, after which the supernatant was removed and replaced with 0.5 mL of 1 M nitric acid and the mixture was kept at 70°C for 30 minutes. Following dissolution of the cells, 3 mL of double distilled water was added to the vials and the solution was filtered and Mn quantified by inductively coupled plasma atomic emission spectroscopy (ICP-AES) (ANALEST Facility, University of Toronto, Toronto, ON). Measurement of intracellular Mn2+ content was made on a per-cell basis and normalized relative to unlabeled cells.
Immunohistochemistry and Colorimetry Assays
To investigate if cell uptake of Mn could be attributed to the presence of cell surface CaSR, we first assessed the expression level of CaSR qualitatively on immunohistochemistry. Cells were plated on glass coverslips (Thermo Fisher Scientific Inc, Ottawa, ON) and grown until they had entered the exponential growth phase, after which they were fixed with 4% paraformaldehyde (TAAB Laboratories Equipment Ltd, Aldermaston, England). Immunohistochemistry was then performed using anti-CaSR polyclonal rabbit antibody (AffinityBioReagents, Golden, CO).
Quantitative assessment of CaSR expression was then performed using a colorimetry protocol modified from a published method. 29 Briefly, cells were grown in 12-well multiwell plates (Corning Incorporated, New York, NY) until they had entered the exponential growth phase. Medium was removed and cells were washed with PBS, fixed for 10 minutes at room temperature with 4% paraformaldehyde, and washed again twice. After fixing and under nonpermeant conditions, cells were blocked with 3% bovine serum albumin (Sigma-Aldrich Canada) in PBS for 1 hour at room temperature. A 1:2,000 dilution of the primary anti-CaSR antibody was then added for 1 hour at room temperature, after which cells were washed twice and incubated with a 1:800 dilution of the secondary horseradish peroxidase–conjugated rabbit anti-IgG antibody (Amersham, Baie d'Urfe, QC) for 1 hour at room temperature. Cells were then treated with 1 mL volume of o-phenylenediamine (buffer) (OPD) substrate (Sigma-Aldrich Canada) for 2 minutes, the reaction was stopped with 0.2 mL of 3N HCl, and the optical density of the supernatant was read on a spectrophotometer at 492 nm. The mean value from three independent readings was then normalized to untreated cells and cell number.
In Vitro MRI and Data Analysis
In preparation for imaging, cells were centrifuged at 440g for 10 minutes in borosilicate glass tubes (Life Science Products Inc., Frederick, CO), and the tubes were placed in ultem resin (McMaster-Carr, Chicago, IL). MRI was performed immediately after on a 3.0 T MR scanner (Achieva 3.0 T TX, Philips Medical Systems, Best, the Netherlands) using a 32-channel receive-only head coil. Quantitative T1 relaxation times were measured using a two-dimensional inversion-recovery turbo spin-echo sequence: inversion times (TI) = [50, 100, 250, 500, 750, 1,000, 1,250, 1,500, 2,000, 2,500] ms, repetition time (TR) = 3,000 ms, echo time (TE) = 18.5 ms, turbo spin echo factor = 4, 60 mm field of view (FOV), 3 mm slice thickness, and 0.5 × 0.5 mm in-plane resolution. Highresolution T1-weighted images were also acquired using a two-dimensional spin-echo sequence: TR = 100 ms, TE = 14.1 ms, 60 mm FOV, 3 mm slice thickness, 0.5 × 0.5 mm in-plane resolution, and number of signal averages = 8.
MRI data were transferred to an independent workstation for quantitative data analysis using in-house software developed in Matlab (v.8.1) (MathWorks, Natick, MA). Calculations of T1 relaxations times were performed on a pixel-by-pixel basis in each cell pellet. At each pixel, the signal intensity versus TI curve was fitted to the function

where A and T1 are free parameters. Relaxation rates R1 were calculated by taking the inverse of T1 and reported as mean values and standard deviations. Two to three independent measurements were made for each cell line at different incubation concentrations.
Statistical Analysis
Differences in R1 were investigated using two-way analysis of variance (ANOVA), with the two main effects being the cell line and the contrast dose. For retention studies, cell line and time postincubation were used to evaluate differences in R1. A full model was used to take into account the main effects and interactions at all levels. Post hoc Tukey-Kramer testing for multiple comparisons was then performed at the 95% confidence level. Differences in viability and CaSR expression were also evaluated using two-way and one-way ANOVA, respectively. Where significance is reported, a p value of 5% was used.
Tumor Induction in Rats and In Vivo MRI
A pilot study was performed first to establish tumor induction in nude rats (Harlan Laboratories, Indianapolis, IN) and then to determine the feasibility of Mn-enhanced MRI for early cancer detection. Cancer cells were grown as described above until they reached 80% confluency. Cells were then harvested, counted, resuspended in PBS, and prepared in a solution containing 25% Matrigel (v/v). Fourteen female immunodeficient rats (6 weeks old) were anesthetized with 1.5% isoflurane, and approximately 10 × 106 cells were injected subcutaneously into the upper leg. Estrogen pellets for 60-day release (Innovation Research of America, Sarasota, FL) were inserted subcutaneously into the back of the neck for the estrogen-dependent cell lines. This study was approved by our institutional animal care committee, and all procedures were conducted in accordance with the Canadian Council on Animal Care.
Rats were imaged weekly on the same 3 T MR scanner used for in vitro imaging, using an eight-channel wrist coil for signal detection. Rats were induced on 2% isoflurane in pure oxygen (2 L/min flow rate) and maintained on 1.5% isoflurane during imaging. Rats were placed prone within the coil, resting on top of a water-blanket maintained at 36°C (HTP-1500, Adriot Medical Systems, Loudon, TN). A 24-gauge angiocath was inserted into the lateral tail vein for contrast injection, and this was connected through a 1 mL line tubing to a three-way stopcock through which Gd and saline could be delivered separately. Gd (Magnevist, Bayer, Montreal, QC) was injected as a bolus at a dose of 0.05 mmol/kg, followed by 2 mL of saline. In addition to localizer scans, a two-dimensional T1–weighted spin-echo sequence with fat saturation was acquired before and after contrast injection: TR = 724 ms, TE = 13.6 ms, 100 mm FOV, 1 mm slice thickness, 0.6 × 0.6 mm in-plane resolution, and number of signal averages = 3. At the end of the experiment, 0.05 mmol/kg of MnCl2 was injected subcutaneously at the back of the neck, and animals returned the next day for 24-hour post-MnCl2 MRI.
Results
Viability of Mn-Labeled Breast Cancer Cells
Cell viability was measured using the trypan blue exclusion test at 0, 24, and 72 hours following cell labeling with MnCl2 (Table 1). No significant differences in viability were observed after 72 hours for any of the cell lines.
Viability of Breast Cancer Cells Labeled with 1 mM MnCl2

Viability was measured using trypan blue exclusion test and reported as the percentage of normal cells relative to total cell count. Measurements represent the mean and standard error (n = 5).
MRI of Mn-Labeled Breast Cancer Cells of Varying Metastatic Potential
MRI was performed immediately after the 1-hour incubation and at 24 and 72 hours post-cell labeling. Figure 2 shows MRIs of cell pellets for all cell lines labeled with MnCl2 at various concentrations up to 1.0 mM. A much brighter signal due to cell uptake of MnCl2 is clearly evident in the most aggressive cell line, MDA-MB-231. To quantify the change in signal, the longitudinal relaxation rate, or R1, was measured. An increase in R1 indicates enhanced longitudinal relaxation effects from the accumulation of Mn inside cells. Figure 3 shows R1 measured immediately after cell labeling with MnCl2 at increasing incubation medium concentrations for all cell lines. The most aggressive cancer, MDA-MB-231, showed a larger change in R1 compared to the other cell lines. Two-way ANOVA analysis showed that this change was significant (p < .05) at concentrations of 0.5 and 1.0 mM, with no difference among the other three cell lines. These results suggest that a large differential uptake of Mn exists between aggressive and less aggressive breast cancer cells at higher Mn incubation levels.

T1-weighted MRIs of various breast cancer cell lines labeled with MnCl2. T1-weighted spin-echo image of cell pellets from breast cancer cell lines in order of increasing aggressiveness (ZR-75-1, MCF7, and MDA-MB-231) and nontumorigenic breast epithelial cells (MCF10A). Cells were incubated with MnCl2 for 1 hour at various concentrations. The most aggressive cell line, MDA-MB-231, gave rise to the brightest signal contrast.
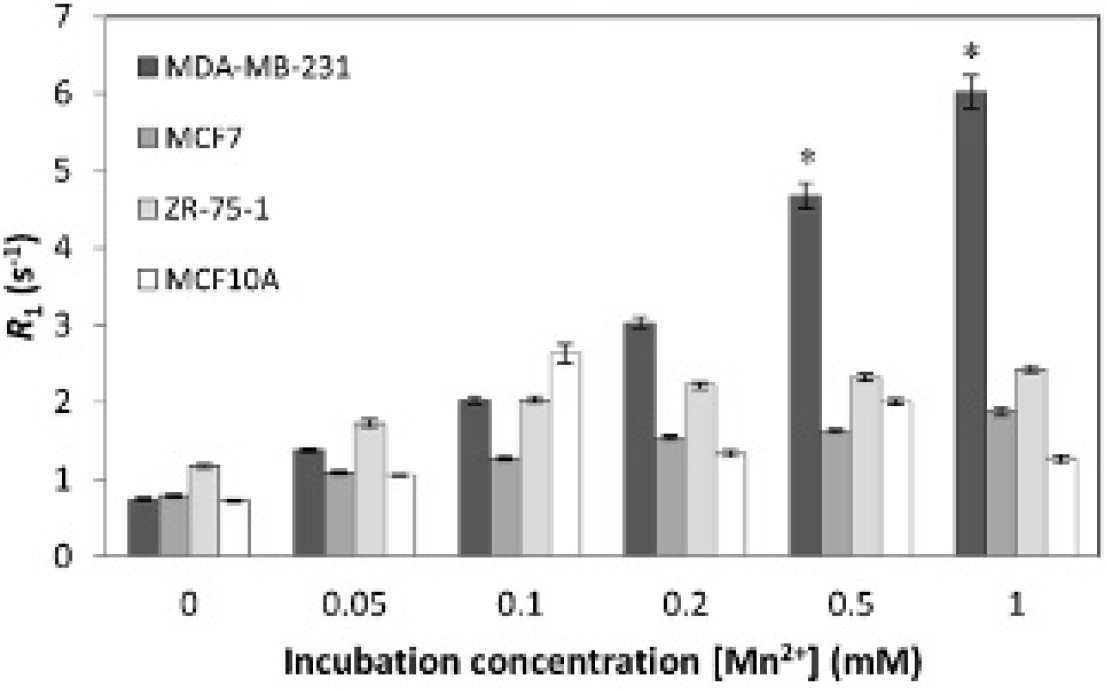
Magnetic resonance imaging of manganese uptake in breast cancers of varying metastatic potential. Longitudinal relaxation rate R1 for all cell lines was measured after incubating cells for 1 hour with MnCl2 at various concentrations up to 1.0 mM. Breast cancer cell lines in order of increasing aggressiveness are ZR-75-1, MCF7, and MDA-MB-231. MCF10A is a nontumorigenic breast epithelial cell line. Measurements represent mean and standard deviation. The asterisk indicates a significantly higher R1 for MDA-MB-231 relative to other cell lines at 0.5 and 1.0 mM (p < .05).
The high relaxation rates R1 observed immediately after cell labeling for more aggressive cells did not remain over 24 and 72 hours (Figure 4). At the 24-hour time point, R1 for MDA-MB-231 had already decreased back to baseline levels and was significantly lower (p < .05) compared to immediately postincubation. In contrast, R1 in MCF7, ZR- 75-1, and MCF10A cells remained relatively stable even at 72 hours, with no significant changes from immediately postincubation, which suggests that Mn was retained over this time interval in both less aggressive cell lines and the normal breast cell line.
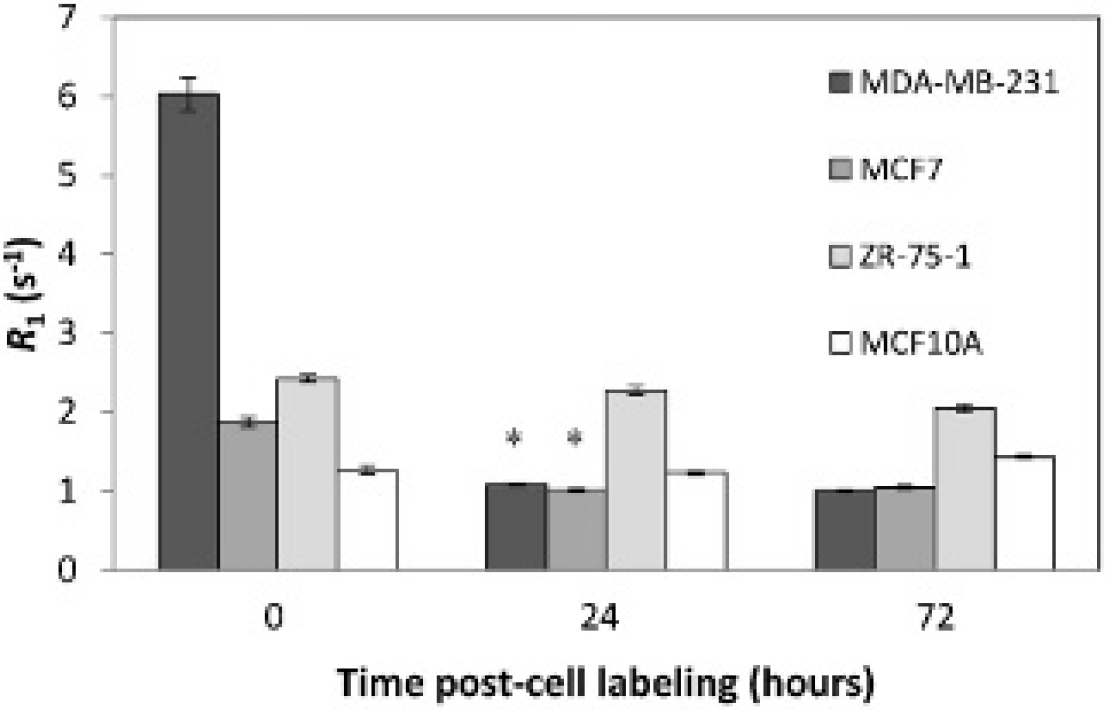
Magnetic resonance imaging of manganese retention in breast cancers of varying metastatic potential. Longitudinal relaxation rate R1 for all cell lines was measured immediately, at 24 and 72 hours after incubating cells for 1 hour with MnCl2 at 1.0 mM. Measurements represent mean and standard deviation. The asterisk indicates a significant decrease in R1 and return to baseline in the most aggressive cell line, MDA-MB-231, after 24 hours, whereas the nonaggressive and nontumorigenic cell lines, ZR-75-1 and MCF10A, respectively, maintained an elevated R1 even after 72 hours.
Quantification of Intracellular Manganese Content
The Mn2+ content per cell was measured immediately after cells were incubated for 1 hour at different concentrations of MnCl2. Table 2 summarizes measured Mn2+ content made from ICP-AES in terms of relative increase with respect to unlabeled cells. Generally, an increase in cellular Mn2+ level with increasing incubation medium concentration was observed for all the cell lines. MDA-MB-231 had the highest relative increase in Mn2+ among all cell lines: over 200-fold at 1.0 mM. Less aggressive cell lines exhibited much lower levels of Mn2+ as expected.
ICP-AES of Intracellular Manganese Content

ICP-AES = inductively coupled plasma atomic emission spectroscopy. Intracellular Mn2+ content is reported on a per-cell basis relative to control (0 mM) following incubation with MnCl2 for 1 hour at varying incubation medium concentrations.
Potential Involvement of CaSR
Cell surface CaSR was qualitatively and quantitatively assessed using immunohistochemistry and a colorimetric assay, respectively. Histology showed a low presence of surface CaSR, as indicated by brown staining, for MDA-MB-231 and MCF10A cells, whereas MCF7 had moderate staining and ZR-75-1 had a high level of staining (Figure 5). Note that brown stains for the antigen (ie, CaSR), whereas the blue color stems from a substance that was added only to help with visualization of cells. These findings are consistent with colorimetric assayresults (Table 3): ZR-75-1 cells had the highest number of surface CaSR, at 348 absorption units (a.u.), which was significantly higher (p < .05) compared to all other cell lines.

Calcium-sensing receptor (CaSR) expression on immunohistochemistry. Histology images depict qualitatively the presence of cell surface CaSR for all cell lines. Brown stains for the protein. A more intense brown stain indicates a higher level of CaSR (20X magnification).
Quantification of CaSR Expression on Colorimetry

Indicates significant difference (p < .05) from other measurements. Measurements are in absorption units and represent the mean and standard error (n = 3).
In Vivo Mn-Enhanced MRI of Tumors in Nude Rats
Tumor induction in nude rats was successful in 3 of the 14 animals, and all 3 were injected with MDA-MB-231 cells. This low take-rate is likely due to the “leakiness” of the nude rat strain, which is related to the animal acquiring immunity with age. We are currently investigating other induction methods to yield higher take-rates in rats. However, the three animals that did develop tumors showed that Mn-enhanced MRI could detect cancer cells in vivo. Furthermore, early detection was possible even before evidence appeared on conventional Gd-enhanced MRI. Figure 6 shows tumor growth over the first 3 weeks after cancer cell inoculation. On day 14, Gd enhancement gave no evidence of tumor growth; however, Mn-enhanced MRI demonstrated an enhancing mass at 24 hours postinjection, with a relative tumor to muscle signal ratio of 1.47. Imaging on day 21 confirmed that the mass seen a week earlier on Mn-enhanced MRI was, indeed, a tumor; at this later time point, tumor vasculature has developed such that the tumor can be detected on conventional Gd-enhanced MRI.

In vivo MRI of a breast tumor-bearing nude rat. T1- weighted fat-suppressed spin-echo images of a nude rat bearing an MDA-MB-231 tumor. Mn-enhanced MRI identified an enhancing mass on day 14 (arrow), but this mass was not detected on conventional Gd-enhanced MRI until 1 week later on day 21.
Discussion
Clinical screening and diagnosis of breast cancer rely on finding manifestations of obvious morphologic changes, such as formation of a sizeable tumor mass or an abnormal tumor blood supply. Unfortunately, at this stage, malignant transformation at the cell level may have progressed for some time, and the most aggressive cells may have already metastasized to distant sites. To improve cure, we need to identify and detect cancer cells at their earliest appearance and be able to determine their metastatic potential to choose the most effective treatment. Currently, the ability to characterize cancer cells is limited to biopsy, which is invasive and cannot sample the entire breast tissue. This study proposes a novel MRI-based technique to determine the metastatic potential of breast cancer cells noninvasively. Three breast cancer cell lines, from nonmetastatic to highly metastatic (ZR-75-1, MCF7, and MDA-MB-231), were investigated for their uptake of MnCl2. MRI showed that the most aggressive cancer, MDA-MB-231, appeared substantially brighter than the less aggressive ones due to a significantly larger increase in the relaxation rate R1. Quantification of intracellular Mn2+ content on ICP-AES attributed the R1 increase to a higher total accumulation of Mn. Preliminary in vivo data in rats demonstrated that Mn-enhanced MRI could detect early MDA-MB-231 tumors that would be seen on Gd-enhanced MRI only at later stages when vasculature has developed. These results support the potential of Mn-enhanced MRI for early breast cancer detection and noninvasive characterization of metastatic potential.
The observations made in this study were consistent with our hypothesis. If Mn is, indeed, an appropriate calcium analogue to assess altered calcium signaling recently identified in cancer progression and metastasis, then MRI should be capable of distinguishing cancer cells by virtue of differences in cell uptake of Mn. Cells with greater metastatic potential would accumulate more Mn, which would translate to a brighter signal on an MRI. These predictions agree with our MRI and ICP-AES results for the cell lines studied. However, it should be noted that MR and ICP-AES measurements do not correlate one to one because the latter measures total ion concentration in the cell and does not distinguish whether the ion exists freely in the cytosol or is sequestered in subcellular compartments, whereas MRI is sensitive not only to the amount of Mn but also to its subcellular distribution. A greater understanding of the distribution of Mn within a cell will certainly help us predict what level of MR signal contrast can be achieved.
To further explore how Mn accumulation and distribution could be potentially different in breast cancers with varying metastatic potential, let us refer to the MRI results in Figure 3. Note that at 0.5 and 1.0 mM, the difference between the most aggressive cell line and the less aggressive or normal cell lines is substantially larger than at lower concentrations. This observation suggests that between 0.1 and 0.2 mM, the accumulation of Mn in aggressive cells compared to that in less aggressive cells begins to diverge. One possibility is that in aggressive cells, sequestering of Mn2+ into the mitochondria is impaired, leading to accumulation of free Mn2+ in the cytosol, where it has greater access to water protons and would, therefore, yield a brighter MR signal accompanying a larger increase in R1. This is a plausible explanation because Mn2+ can use Ca2+ channels and because high intracellular levels of calcium in healthy cells are known to activate a mechanism called uniporter, 30 which initiates the transport of Ca2+ ions into the mitochondria. In other words, more aggressive cells may have a reduced ability to “protect” themselves and a lower threshold for Mn2+ accumulation, effectively reducing their ability to sequester excess Mn2+ ions into the mitochondria when less aggressive or healthy cells have the ability to do so. Incidentally, the anomalous R1 peak at 0.1 mM for MCF10A (see Figure 3) may reflect a Mn2+ threshold at which the uniporter mechanism is activated, which would explain lower R1 values at higher concentrations.
What mechanism leads to higher cell uptake of Mn remains unresolved. We tested the hypothesis that the CaSR was a potential mediator of Mn2+ ion entry into cells, based on previous evidence suggesting its role in Mn2+ uptake in breast cancer cells. 26 Our results from histology stains of surface CaSR (see Figure 5) revealed that the most aggressive cell line and the basal cell line had the lowest amount of CaSR, whereas the least aggressive cell line, ZR-75-1, had a much higher amount. Quantitative colorimetric assay results (see Table 3) supported this finding also. These results support the conclusion that a higher CaSR expression does not necessarily imply a higher ion influx. Although CaSR-overexpressing cells may be more sensitive to respond to extracellular calcium, we must recognize that CaSR itself is not a calcium channel and that it modulates calcium influx through complex mechanisms.31,32 To assess potential routes of cell entry for Mn2+, we must look specifically at calcium channels such as T-type channels 33 and non-voltage-gated calcium channels 9 among the many possibilities. A thorough understanding of the mechanisms of Mn uptake in breast cancer cells would also require consideration and systematic testing of other potential factors, including Mn-SOD expression, 34 cell cycle, 35 and cell proliferation. 36
In addition to Mn uptake, we also investigated retention up to 3 days post-cell labeling. The most aggressive cancer cell line returned to baseline Mn2+ levels by 24 hours. At the other extreme, the nonaggressive cancer ZR-75-1 and the nontumorigenic epithelial cell line MCF10A both showed sustained levels of Mn2+ even after 72 hours. This observation reveals that aggressive cancers take up Mn2+ more readily but also release it quickly. The reasons are unclear, although it is expected that if Mn2+ is found in the cytosol (as assumed to be the case in aggressive cells), then diffusion back into the extracellular environment would occur quite readily. Although we have yet to understand why differences in retention exist, this difference may serve as a potential metric to more specifically assess metastatic potential of cancer cells.
A practical consideration of the proposed technique is whether or not intracellular accumulation of Mn2+ is toxic. It is known that a high intracellular level of Mn2+ or Ca2+ can induce cell death through membrane and subsequent mitochondrial damage. 37 However, in the submillimolar concentration range used in this study, we did not observe cytoxicity up to 7 days post-cell labeling at the maximum concentration of 1.0 mM tested. The decrease in viability observed with MCF10A could be attributed to the fact that the cell line was acquired and cultured in low Ca2+ concentration medium for a long time. It is possible that after a long exposure to calcium, changes in cell morphology occurred, which may be responsible for an overall slightly lower viability even in the absence of MnCl2.
The pilot study in nude rats demonstrated a couple of important results on the in vivo feasibility of Mn-enhanced MRI. First and foremost, Mn enhancement revealed an early MDA-MB-231 tumor even before conventional Gd-enhanced MRI could detect any abnormality. Second, the dose applied (0.05 mmol/kg) was sufficient to achieve in vivo detection, although the dose remains to be optimized for even greater signal contrast. Unfortunately, we were not successful in establishing tumors other than MDA-MB-231 in the nude rat model; therefore, the in vitro observation of differences in Mn enhancement among different cell lines could not be tested. Even so, we at least answered the questions of sufficient sensitivity and early detection in vivo.
Future studies will need to first establish animal models of breast tumors for all the cell lines considered and then optimize the proposed Mn-enhanced MRI technique in vivo. Fundamentally, we want to provide further support that this method can identify and distinguish aggressive cancer cells in the early stages and that their identification accurately predicts later onset of metastasis. We also need to establish the optimal protocol for contrast administration, dosing, and imaging time points. A second endeavor is to understand how and why differential uptake of Mn2+ exists so that we can optimize MRI for more sensitive detection of breast cancer cells. To do this, we need to determine Mn2+ localization in subcellular compartments for the different cancer cell lines and test various potential points of entry into the cell. This is a considerable endeavor on its own but will provide a better understanding of the biology that MRI has indicated to be different in this study.
A final consideration is how to use MRI judiciously for cellular imaging. Because the spatial resolution of MRI does not approach the cell level, the signal we obtain would be an average over a three-dimensional voxel, however small it may be, but cannot be derived from a single cell. Therefore, it is possible for a few highly metastatic cells taking up a lot of Mn to produce similar signal contrasts as many nonmetastatic cells taking up much less Mn. If the cell phenotype is uniform throughout a tumor, we can reasonably expect cells in the same imaging voxel to have similar metastatic potentials, and there would be little ambiguity in interpreting MRI contrast changes. The real difficulty comes when there are only a few metastatic cells, in which case, signal dilution may lead to an erroneous diagnosis of low metastatic potential. To address this issue, we need to investigate in the future the sensitivity of our technique in terms of the minimum detectable cell number.
Conclusion
This article proposes a novel MRI-based capability to characterize breast cancer cell metastatic potential and achieve early breast cancer detection. It reaps the advantages of MRI (nonirradiative, deep tissue penetration, high spatial resolution) for a new cellular imaging method to detect and identify aggressive cancer cells based on altered uptake of Mn ions. It goes beyond traditional approaches, bringing a completely new perspective to cancer imaging, and would be valuable for cancer screening, diagnosis, and treatment monitoring. By enabling early noninvasive identification of breast cancer cells with high metastatic potential, the proposed MRI technique may greatly improve cancer patient management and survival as it would enable early intervention and selection of a treatment most effective for the particular cancer phenotype. This research could have a tremendous impact and broad implications, providing the basis for investigating many other cancers.
Footnotes
Acknowledgment
We thank Anoja Giles for advice on cell biology work, Azza Al-Mahrouki for help with histology, and Rafal Janik for advice on materials and setup for imaging cell pellets. Financial disclosure of the authors: This study was supported by funds to H-L Cheng from the Natural Sciences and Engineering Research Council of Canada (#355795), the Heart & Stroke Foundation of Canada (#000223), and the Garron Family Cancer Centre Grant through the SickKids Foundation.
Financial disclosure of reviewers: None reported.