
Abstract
In this study, simultaneous positron emission tomography (PET)/magnetic resonance (MR) imaging was employed to evaluate the feasibility of the PET tracers 2-deoxy-2-18F-fluoro-D-glucose (18F-FDG), 11C-choline, and 18F-fluorothymidine (18F-FLT) to detect papillomavirus-induced tumors in an established rabbit model system. The combined PET/MR allowed the analysis of tracer uptake of the tumors using the morphologic information acquired by MR. New Zealand White rabbits were infected with cottontail rabbit papillomavirus genomes and were imaged for up to 10 months with a simultaneous PET/MR system during the course of infection. The uptake characteristics of the PET tracers 11C-choline and 18F-FLT of tumors and reference tissues were examined relative to the clinical standard, 18F-FDG. Tracer biodistribution of various organs was measured by gamma-counting after the last PET scan and compared to the in vivo PET/MR 18F-FDG uptake. Increased tracer uptake was found 2 months postinfection in primary tumors with 18F-FDG and 11C-choline, whereas 18F-FLT failed to detect the tumors at all measured time points. Our data show that the PET tracer 18F-FDG is superior for imaging papillomavirus-induced tumors in rabbits compared to 11C-choline and 18F-FLT. However, 11C-choline imaging, which has previously been applied to detect various tumor entities in patients, appears to be an alternative to 18F-FDG.
Imaging methods, such as computed tomography (CT) or MR imaging, provide excellent morphologic information.9,10 One potential problem with these techniques is the lack of metabolic information, which is essential for the reliable prediction of the physiologic response of the cancer tissue to the respective treatment. Functional changes in tumor biology, such as apoptosis on treatment, occur much earlier than morphologic changes affecting the size of the tumor. 11 With this in mind, PET reveals the metabolic and functional parameters of living cells and is capable of distinguishing between normal and malignant tissues through the use of various PET tracers.
PET has previously been performed on mice with chemically induced skin tumors12,13 and in patients with sinonasal inverted papilloma,14,15 of which more than 70% are HPV negative, 16 using 2-deoxy-2-18F-fluoro-D-glucose (18F-FDG) as a PET tracer. Here we evaluate the uptake of 18F-FDG, 3′-deoxy-3′-18F-fluorothymidine (18F-FLT) and 11C-choline into papillomavirus-induced tumors to determine the most suitable PET tracer for examining physiologic skin tumor growth and progression causally induced by papillomaviruses in rabbits. In addition to the widely used PET tracer 18F-FDG for glucose metabolism, the 18F-radiolabeled thymidine derivative 18F-FLT was used. 18F-FLT is a PET marker for cell proliferation and is consumed by proliferating cells via the salvage pathway, which incorporates nucleotides into replicating deoxyribonucleic acid (DNA) during the S phase of the cell cycle. 16 using 2-deoxy-2-18F-fluoro-D-glucose (18F-FDG) as a PET tracer. Here we evaluate the uptake of 18F-FDG, 3′-deoxy-3′-18F-fluorothymidine (18F-FLT) and 11C-choline into papillomavirus-induced tumors to determine the most suitable PET tracer for examining physiologic skin tumor growth and progression causally induced by papillomaviruses in rabbits. In addition to the widely used PET tracer 18F-FDG for glucose metabolism, the 18F-radiolabeled thymidine derivative 18F-FLT was used. 18F-FLT is a PET marker for cell proliferation and is consumed by proliferating cells via the salvage pathway, which incorporates nucleotides into replicating deoxyribonucleic acid (DNA) during the S phase of the cell cycle. 17 18F-FLT is, however, rarely incorporated into the DNA 18 and has been used in preclinical and clinical studies to monitor treatment efficacy in cancers. 19 11 C-Choline is another promising PET tracer that can be used to detect membrane synthesis. It is initially phosphorylated within the tumor cell. The resulting phosphatidylcholine is then trapped in the lecithin of the cell membrane. 20 Dividing tumor cells are characterized by increased cell membrane synthesis, leading to an enhanced uptake of 11C-choline. Thus, although not directly correlated with the cellular proliferation rate, 11C- choline is an interesting candidate for cancer imaging where 18F-FDG and 18F-FLT fail. 11C-Choline was first used for imaging brain tumors 21 and is currently employed primarily for detection and staging of prostate cancer,22–25 because of its low bladder activity. Thus, for detection of gynecologic malignancies 11C-choline might be superior to 18F-FDG and 18F-FLT, which are excreted via the urinary tract, because of reduced masking of the 25,26 pelvic region.25,26
In this study, the clinical gold standard in PET oncology, 18F-FDG, showed a markedly increased uptake into the tumor tissue of rabbits, whereas 18F-FLT failed. However, 11C-choline revealed an uptake comparable to 18F-FDG, thus representing an alternative PET tracer to 18F-FDG for imaging papillomavirus-induced tumors.
Materials and Methods
Animal Model and Infection Procedure
Specific pathogen-free (SPF) female NZW rabbits were obtained from Charles River (Kisslegg, Germany) and were maintained in an SPF facility under standard environmental conditions (18 ± 2°C room temperature, 50 ± 10 % relative humidity, 12-hour light/dark cycle). The rabbits were anesthetized using 35 mg of ketamine hydrochloride and 0.25 mg of medetomidine hydrochloride per kilogram body weight. The infection sites at the flanks of the rabbits were marked, and viral DNA was injected into the skin using a Helios Gene Gun (BioRad, Munich, Germany) as described previously.27,28 Animal experiments were approved by the review board for animal experiments (permission no. H1/08).
Simultaneous PET/MR Imaging
Simultaneous PET/MR imaging was performed using the human BrainPET system (Siemens Healthcare, Knoxville, TN), which allows nearly whole-body scans of the rabbits. The BrainPET PET/MR system consists of an MR-compatible PET system inserted into a modified 3 T MR scanner (Magnetom Tim Trio, Siemens Healthcare). The technical specifications of the PET system have been described previously. 29 The PET scanner has an axial field of view (FOV) of approximately 19.1 cm and a transversal FOV of 32.0 cm. The image volume consisted of 153 transaxial images, with a matrix size of 256 × 256 and an isotropic voxel size of 1.25 mm3. All image data were acquired in list mode for retrospective data rebinning and reconstruction.
CRPV-infected NZW rabbits were imaged at 2, 4, and 10 months postinjection under anesthesia using the PET tracers 18F-FDG (50–60 MBq), 18F-FLT (50–60 MBq), and 11C-choline (100–110 MBq), which were injected via an ear vein catheter. The imaging schedule contained the consecutive measurement of one cohort of rabbits during 1 week (day 1: 18F-FLT; day 3: 11C-choline; day 5: 18F-FDG), which allowed us to significantly reduce the number of animals used in this study according to the guidelines of animal care. For all tracers, 30- or 60-minute dynamic PET scans were performed. The 30-minute scans started after an uptake time of 30 minutes and the 60-minute scan directly during tracer injection. Simultaneously to the PET acquisition, the MR examination protocol was performed, which included gradient-echo localizers, transverse T1-weighted three-dimensional spoiled gradient echo sequence (FLASH) for PET attenuation correction (repetition time [TR]/echo time [TE] 4.6 ms/2.46 ms, excitation angle 10°, matrix size 256 × 256 × 160, isotropic voxel size of 1.25 mm3, bandwidth 590 Hz/px, parallel imaging acceleration factor 2, acquisition time [TA] 3 minutes 13 seconds). For the morphologic analysis, a sagittal T1- weighted MPRAGE (TR/TE 1,900 ms/2.23 ms, excitation angle 9°, matrix size 246 × 256 × 192, isotropic voxel size of 1.25 mm3, bandwidth 190 Hz/px, TA 10 minutes 44 seconds) was used. Additionally, a two-dimensional transversal T2-weighted spoiled gradient echo sequence (TR/TE 250 ms/2.46 ms, excitation angle 70°, matrix size 160 × 256 × 40, voxel size 0.35 × 0.35 × 3 mm, bandwith 320 Hz/px, TA 1 minute 20 seconds) was acquired.
PET attenuation maps for scatter and attenuation correction were computed from the FLASH image. To remove artifacts in the MR image originating from the living animal, for example, breathing and heart motion, a combination of thresholding, morphologic operations, and connected component analysis was employed. After thresholding the MR image and shrinking connected regions to remove small artifacts, only the largest connected region was retained, discarding larger MR motion artifacts outside the rabbit. The MR image was then segmented into four classes by intensity thresholding, assigning the corresponding CT values (air, –1,000 HU; lung, –650 HU; fat, –70 HU; soft tissue, 50 HU). Image smoothing was performed using a gaussian filter (5.625 mm full width at half maximum), and the assigned CT values were converted to linear attenuation coefficients at 511 keV (yielding air 0 cm-1, lung 0.0336 cm-1, fat 0.08928 cm-1, and soft tissue 0.10065 cm-1).
PET listmode files were rebinned into multiple frames depending on the tracer. PET data were reconstructed using a three-dimensional ordered subset expectation maximization (OSEM) algorithm (6 iterations, 16 subsets) and resolution modeling using the software provided by the manufacturer. Corrections for randoms, attenuation, and scatter were applied.
PET images were analyzed using Inveon Research Workplace software (Siemens Preclinical Solutions, Knoxville, TN). Data sets from PET/MR were coregistered, and regions of interest (ROI) were drawn around the viable papilloma tissue, based on the anatomic information from the MR images and the molecular information of the PET. Volumetry of the viable tumor tissue was assessed from the PET/MR data obtained by the 18F-FDG imaging using these ROI. Absolute quantification as a percentage of the injected dose or standard uptake values (SUVs) of the PET data sets was not possible in this study because the BrainPET was not cross-calibrated. Therefore, the uptake of the tracers used is expressed as a ratio of tumor to muscle or tumor to liver uptake.
PET/CT Imaging
To enable quantification and report clinically relevant SUVS, 11C-choline-PET/CT was performed for two animals using a clinical scanner. PET data acquisition (Hi-Rez Biograph 16, Siemens Healthcare) was initiated 50 minutes after injection of 11C-choline (50–60 MBq) and lasted for 4 minutes (one bed position). For attenuation correction, a non–contrast-enhanced low-dose CT scan was acquired, and CT for the anatomic information was sequentially performed. Attenuation-corrected trans-axial slices (matrix size 256 × 256, corresponding to a FOV of 45.5 cm × 45.5 cm) were reconstructed using the standard software of the scanner (Fourier rebinning, two-dimensional OSEM with 8 iterations, 16 subsets, 5 mm gaussian filter). PET/CT images were analyzed and compared to PET/MR images.
Ex Vivo Biodistribution
Following the final 18F-FDG PET scan, the animals were euthanized by injection of T61 (Intervet, Unterschleissheim, Germany) under deep anesthesia and were subsequently dissected. Tumors and organs were removed and measured together with an aliquot of the injected radiotracer solution by gamma-counting (Wizard single-detector gamma-counter; PerkinElmer, Waltham, MA) using an energy window of 350 to 650 keV. The results are expressed as percent injected dose per gram (% ID/g) of tissue.
Statistical Analysis
Statistical analysis was performed using analysis of variance (ANOVA) with a post hoc Bonferroni test carried out with Origin 8 software (OriginLab Corporation, Northampton, MA). Data were considered statistically significant for p < .05. All quantitative results are shown as the mean ± 1 standard deviation (SD).
Results
PET/MR Imaging and Biodistribution
Tumors induced by CRPV are depicted at different time points in Figure 1. At 2 months postinfection, small papillomas are visible in the inoculated skin on the back of the rabbits (see Figure 1A), which successively progress to larger tumors (see Figure 1, B–D). To monitor tumor growth in the rabbits noninvasively, the animals were imaged using the PET tracers 18F-FDG, 11C-choline, and 18F-FLT at 1, 2, 4, and 10 months after infection by simultaneous PET/MR imaging. No tumor formation was detected in PET images from all three tracers in the first month postinjection. Tumor volumetry on the basis of the 18F-FDG PET/MR data revealed 0.0 ± 0.0 cc 2 weeks postinjection; 4.1 ± 3.5 cc 2 months postinjection; 7.6 ± 5.2 cc 4 months postinjection, and 17.4 ± 1.1 cc 10 months postinjection. Figure 2 shows a representative rabbit at 10 months postinjection. The imaging results are presented as CRPV-induced tumor to organ ratios in Figure 3.
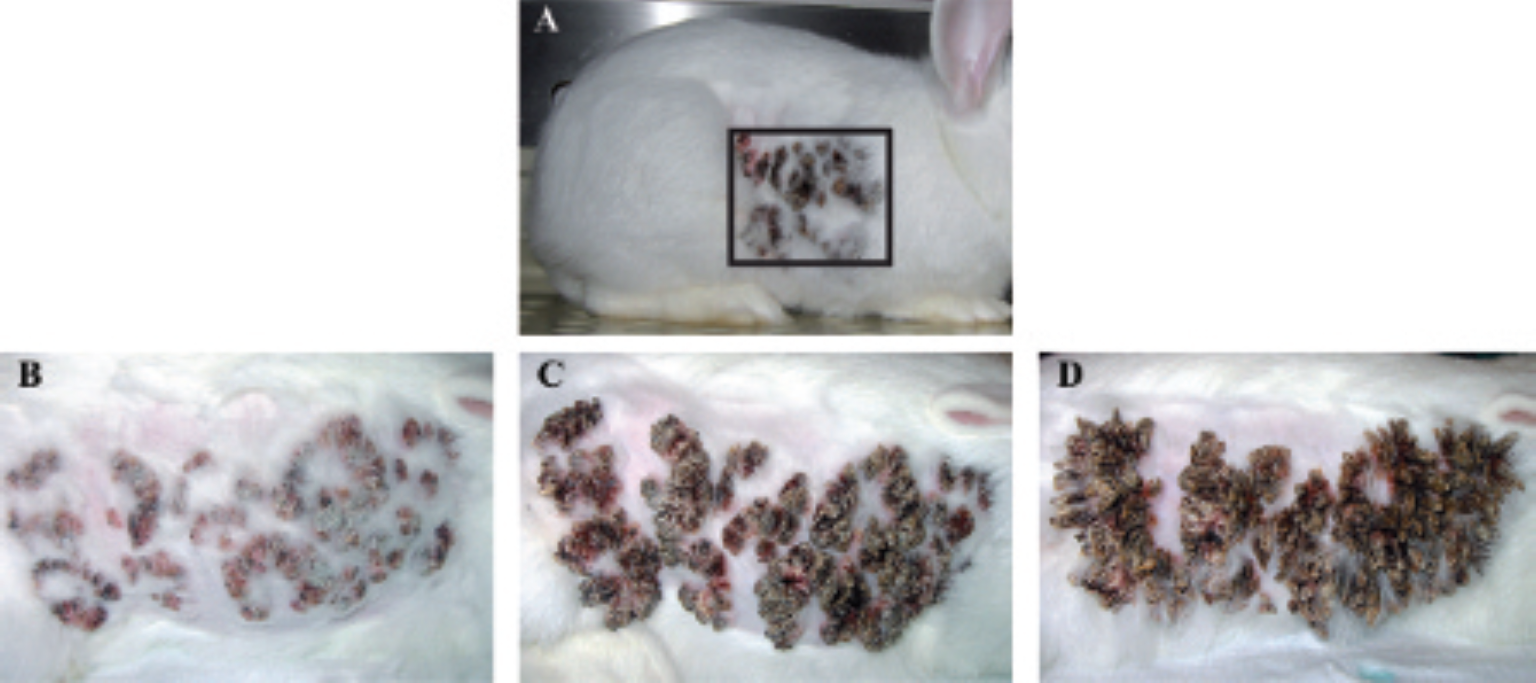
Overview photograph of a cottontail rabbit papillomavirus (CRPV)-infected New Zealand White rabbit illustrating the site of infection (A). Close-up photographs of infected sites at various time points postinjection are shown in B to D. CRPV induces tumor development in the skin of the rabbits, which becomes visible at 2 months postinjection (B) and which progresses to larger tumors at 4 months postinjection (C). Successively, highly keratinized tumors are visible (D).

Representative maximum intensity projections (MIP; left) and coronal MR (center left), fused PET/MR (center right), and correlating PET (right) images of a cottontail rabbit papillomavirus–infected rabbit imaged with the PET tracers 18F-FDG (top), 11C-choline (center), and 18F-FLT (bottom). The PET data are shown as sagittal (upper left) and coronal (lower left) MIP. 18F-FDG showed the highest uptake, but 11C-choline uptake was also increased in tumor tissue. No uptake was observed in tumors using the proliferation marker 18F-FLT. The figure depicts the precise coregistration of the molecular and anatomic information due to the simultaneous acquisition of PET and MR.

Analysis of the PET/MR images and PET quantification. Imaging with 18F-FDG revealed an increased relative tumor uptake of the PET tracer in cottontail rabbit papillomavirus–infected rabbits over time (A). Choosing the muscle (A) or the liver (B) as the reference tissue, the overall highest uptake was observed for 18F-FDG. Using 11C-choline as PET tracer, the tumor to muscle ratios were also highly increased at 4 and 10 months postinjection (p.i.) but less pronounced after 2 months postinjection. No increased uptake of 18F-FLT was observed in tumors of the infected rabbits at any imaging time point. The time-activity curves (TACs) depict the biodistribution of the tracers during acquisition time (C). The results are shown as tumor to muscle ratios (A), tumor to liver ratios (B), or arbitary units (C). Error bars represent standard deviation; the asterisk indicates significant differences (p < .05).
The glucose analogue 18F-FDG showed the highest uptake values compared to the other PET tracers tested (see Figure 3A). At 2, 4, and 10 months postinjection, we found an 18F-FDG tumor to muscle ratio of 11.22 ± 3.53 (n = 3), 13.57 ± 0.68 (n = 5), and 16.2 ± 0.91 (n = 3), respectively. Tumor to liver ratios showed lower values compared to the tumor to muscle ratios but revealed the same trend at 2, 4, and 10 months postinjection (0.76 ± 0.14, 1.11 ± 0.12, and 1.31 ± 0.35, respectively). 11C-Choline also showed high tumor to muscle ratios after 4 (6.69 ± 1.47; n = 4) and 10 months postinjection (6.34 ± 1.04; n = 3; see Figure 3B), whereas, after 2 months postinjection, the 11C-choline uptake was lower (2.73 ± 1.5, n = 2) than the uptake measured for 18F-FDG. Due to the high 11C-choline uptake in the liver of the animals, the tumor to liver ratios at 2 months postinjection (0.27 ± 0.18), 4 months postinjection (0.35 ± 0.12), and 10 months postinjection (0.34 ± 0.03) were quite low compared to the results obtained with 18F-FDG. Interestingly, no uptake of the proliferation marker 18F-FLT was observed at any time point after infection (see Figure 3C). The tumor to muscle ratios obtained using image analyses showed no differences between the three imaged infection time points (0.8 ± 0.06 [n = 2], 2 months postinjection; 0.75 ± 0.25 [n = 3], 4 months postinjection; 1.0 [n = 1], 10 months postinjection). Similar results were obtained when tumor to liver ratios were calculated (0.95 ± 0.15, 2 months postinjection; 0.71 ± 0.09, 4 months postinjection; 0.57, 10 months postinjection).
After injection of 18F-FDG, the time-activity curves (TACs) of the tumor uptake increased during the dynamic acquisition time of60 minutes (see Figure 3A, right panel). The 18F-FDG TACs of the muscle tissues remained low during the entire acquisition time, which is in agreement with previous findings, for example, in mice. 20 In contrast, the 18F-FDG TACs of the liver tissue peaked immediately after the injection due to the high blood-pool concentration of the tracer at this early time point and declined rapidly before it reached a stable plateau after about 25 minutes acquisition time. The level (arbitrary values) was similar to the one reached in the tumor tissue, thus explaining the low tumor to liver ratios at 50 to 60 minutes after 18F-FDG injection (see Figure 3A). 11C-Choline TACs showed a very low uptake into the muscle tissue, whereas values steadily increased for tumor and liver tissue. However, no plateau was reached in the TACs of the tumor or liver tissue (see Figure 3B). 18F-FLT uptake remained low for tumors and muscle for the entire 60 minutes of acquisition time. The liver 8F-FLT TAC revealed a perfusion peak in the first 5 minutes after tracer injection (see Figure 3C).
The results of the 18F-FDG biodistribution are shown in Figure 4. After 6 months postinjection, the organ to muscle ratios showed a relative 18F-FDG uptake of 10.8 ± 2.5 in tumor tissue, 3.55 ± 0.27 in uninfected skin, 2.88 ± 0.36 in blood, 7.78 ± 0.17 in the liver, 9.72 ± 0.64 in the spleen, 6.03 ± 1.33 in the kidneys, 2.7 ± 0.45 in heart muscle tissue, 6.22 ± 0.92 in lung tissue, and 1.69 ± 1.66 in fat (see Figure 4). After 10 months postinjection, the organ to muscle ratios revealed an even higher relative uptake of 18F-FDG of 15.69 ± 1.54 in tumors and of 12.93 ± 2.21 in liver tissue. Since the muscle tissue did not show an increased uptake of 18F-FDG at the tested time points (0.011 ± 0.0036 percentage of injected dose per gram in muscle tissue at 6 months postinjection and 0.018 ± 0.015 %ID/g at the late infection stage), the increase in relative 18F-FDG uptake in the tested organs is due to an increased 18F-FDG consumption, most probably because of the activated immune system at this stage of infection. 18F-FDG organ to muscle ratios at 10 months postinjection were as follows: 3.73 ± 2.23 in uninfected skin, 4.26 ± 2.5 in blood, 12.93 ± 0.74 in spleen, 8.4 ± 4.54 in kidneys, 4.17 ± 0.26 in heart muscle tissue, 5.84 ± 3.59 in lung tissue, and 0.79 ± 0.26 in fat. Similar results were obtained at 4 months postinjection.

Ex vivo 18F-FDG biodistribution of organs of infected rabbits after the final PET/MR scan at 6 or 10 months postinjection (p.i.) measured in a gamma-counter. An increased uptake of 18F-FDG was observed in tumors of infected rabbits 6 and 10 months postinjection, which confirmed the results obtained by PET/MR imaging.
PET/CT Imaging
For quantification of the 11C-choline uptake into tumors of CRPV-injected rabbits, PET/CT scans were performed at 10 months postinjection and were compared to PET/MR imaging. Two animals underwent PET/CT measurements with 11C-choline. SUVS from the 11C-choline-PET/CT were 1.46 ± 0.02 for tumor, 0.69 ± 0.02 for muscle, and 7.74 ± 0.73 for liver tissue (Figure 5).
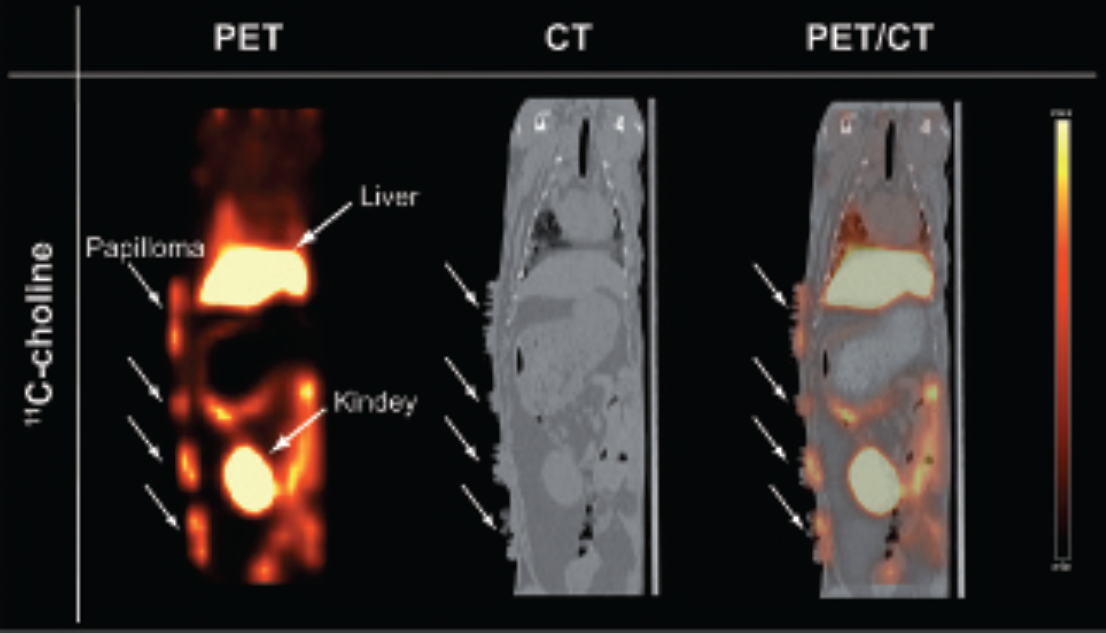
Coronal PET/CT images of a cottontail rabbit papillomavirus-infected rabbit with the PET tracer 11C-choline.
Discussion
The early assessment of applied therapeutics in cancer patients is most critical to manage efficient chemotherapy and an optimal quality of life. 30 Infection of NZW rabbits with CRPV serves as an excellent animal model system to study the role of the viral oncoproteins in tumor development. In this study, we employed the animal model system for CRPV-induced tumors to evaluate the PET tracers 18F-FDG, 18F-FLT, and 11C-choline for tumor detection using simultaneous PET/MR imaging. All primary tumors were detectable after 2 months postinjection in 18F-FDG and 11C-choline PET images, whereas 18F-FLT failed to image CRPV-induced tumors in the rabbits.
Functional changes in tumor biology, such as apoptosis or senescence on treatment, occur much earlier than morphologic changes affecting the size of the tumor. 11
Hence, treatment efficacy may be monitored by PET imaging combining morphologic and molecular information without applying additional radiation doses arising from CT measurements.
18F-FDG, which is the current gold standard for oncologic PET imaging, has been shown to accumulate in normal tissue, such as the liver, due to physiologic glucose uptake and in sites of inflammation due to increased glucose metabolism. 31 We used the glucose analogue 18F-FDG to determine whether an increased glucose uptake into the papillomavirus-induced tumors can be detected by PET imaging of CRPV-infected NZW rabbits and were able to detect tumors ever since the 2 months postinjection examined time points. However, a major drawback for the clinical application of 18F-FDG PET is the hampered detection of HPV-associated tumors in the pelvic region due to the excretion of radioactivity into the bladder complicating the interpretation of acquired images in this area.32,33
Use of the tracer 11C-choline has the advantage of not complicating imaging of pelvic tumors as it is not excreted via the bladder. Choline is incorporated into cells via phosphorylcholine synthesis and integrates into the phospholipids of cell membranes. 34 Various cancers have elevated levels of phosphorylcholine compared to the low or even undetectable levels in normal tissues.35,36 Indeed 11C-choline has been used successfully in PET imaging of tumors in the pelvic region, including cervical cancer.22–24,26,37,38 Therefore, the simultaneous use of noninvasive, high–tissue contrast MR imaging in combination with 11C-choline PET has the potential to improve diagnosis and support future clinical staging of cancers. In addition, we confirmed reports from previous studies demonstrating that the uptake of 11C-choline into tumors was lower than the uptake of 18F-FDG.37,39
Interestingly, the proliferation marker 18F-FLT failed to detect the CRPV-induced tumors in rabbits. However, we cannot rule out that this might be due to the slow proliferation rate of the tumors, which is implicated by the low relative uptake values in the TACs over the acquisition time of 60 minutes (see Figure 3). To our knowledge, no commercial Ki-67 marker is available for staining rabbit tissues preventing us to proof this hypothesis by histology. Fuchs and colleagues showed recently that ketamine/xylazine reduces 18F-FLT uptake in carcinomas in mice. 40 Since imaging was here performed under ketamine/medetomidine anesthesia, this could have an impact on 18F-FLT uptake. However, the TAC indicates a rapid washout of FLT and nearly no specific binding, whereas Fuchs and colleagues found a decent uptake under ketamine/xylazine anesthesia, which was reduced (4.3 ± 0.9 %ID/cc) compared to animals scanned under isoflurane anesthesia (6.4 ± 1.5 %ID/cc). Therefore, the use of ketamine anesthesia might influence 18F-FLT uptake.
In future studies, we also plan to compare the functional parameter obtained from extended MR measurements such as diffusion-weighted magnetic resonance imaging (DW-MRI) while acquiring the PET data simultaneously. This approach will allow multiparametric data analysis comparing the DW-MRI quantification via the apparent diffusion coefficient with the PET data. In this study, the aim was to evaluate clinically used tracers in the animal model of papillomavirus-induced tumors. However, future PET/MR experiments using a papillomavirus-specific antibody against a putative tumor antigen would be advantageous to distinguish between secondary inflammation reactions and tumor tissue.31,41 At present, we cannot ensure that the enhanced 18F-FDG uptake in tumor tissue is solely based on the increased glycolysis in papillomavirus-induced malignant cells.
In summary, our data show that papillomavirus-induced tumors in rabbits can be visualized by both 18F-FDG and 11C-choline.
Conclusion
This study shows the feasibility of 18F-FDG but also of 11C- choline PET imaging to detect papillomavirus-induced tumors in the rabbit animal model system. It therefore provides a basis for future studies to investigate the applicability of simultaneous PET/MR imaging using the tracers 18F-FDG or 11C-choline in preclinical settings for tumor characterization, staging, and treatment monitoring of papillomavirus-induced cancers.
Footnotes
Acknowledgments
We are grateful to Denis Lamparter and Walter Ehrlichmann for producing the PET tracers, Henriette Heners for expert technical assistance with the PET/CT scans, and Juliane Haedicke for critical revision of the manuscript.
Financial disclosure of authors: This research was supported by the Deutsche Forschungsgemeinschaft SFB 773. Financial support from the Deutsche Forschungsgemeinschaft was also provided through grants PI771/1-1 and PI771/5-1.
Financial disclosure of reviewers: None reported.