
Abstract
The aim of this study was to evaluate a robust magnetic resonance (MR) vessel size imaging (VSI) method for the noninvasive assessment of mean vessel size in solid tumors in a clinical dose range of ultrasmall superparamagnetic particles of iron oxide (USPIO). Therefore, USPIO-enhanced MR-VSI was performed on DU-4475, MDA-MB-435, and EOMA tumor–bearing mice xenografts with known differences in angiogenic activity and vessel morphology. MR results were compared to vessel sizes determined by immunohistochemistry (anti-CD31) and by intravital microscopy (IVM). MR-VSI revealed significantly different mean vessel sizes between the xenograft models at both USPIO doses (DU-4475: 20.6 ± 4.9 mm; MDA-MB-435: 37.4 ± 8.8 μm; and EOMA: 60.3 ± 9.6 μm at 80 μmol/kg; p < .05). Immunohistochemistry revealed lower values for all tumor entities, whereas the size distribution was in line with MR-measurements. IVM corroborated the MR results for DU-4475 and MDA-MB435, but showed similar vessel sizes for MDA-MB-435 and EOMA. Our MR-VSI method allowed a noninvasive estimation of the mean vessel size in mice xenograft solid tumors with variable vascularity using a clinically relevant USPIO dose range.
SINCE JUDAH FOLKMAN proposed that the growth and metastasis of solid tumor depend on angiogenesis, the knowledge of angiogenic pathways has increased dramatically.1–3 The related tumor vasculature is structurally and functionally abnormal, whereas the newly recruited blood vessels are more leaky, tortuous, and dilated. 4 It is well known that the microvessel density widely correlates with cancer aggressiveness and patient outcome, but the clinical assessment with biopsy samples is limited by regional tumor heterogeneity and invasiveness. 5 Over the last several decades, a wide range of new target-specific antiangiogenic substances (eg, monoclonal antibodies or tyrosine kinase inhibitors), hormone antagonists (eg, antiestrogen), and immunomodulating agents (eg, interferon-α) have been used in first- and second-line systemic therapy protocols for various solid tumors.4,6–8 These molecular therapies predominantly induce changes in tumor vascularity and/or physiology. Thus, the treatment effectiveness of these target-specific agents will not necessarily be reflected by classic measurements of tumor size changes, and classic response evaluation criteria in solid tumors (such as Response Evaluation Criteria in Solid Tumors [RECIST]) may fail in these circumstances. Furthermore, these molecular targeting drugs are expensive both in the preclinical development stages and for daily clinical use, and as such, reliable noninvasive biomarkers are strongly needed for early assessment of treatment response for drug discovery, patient care, and economic reasons.
Vessel size imaging (VSI) allows for the noninvasive estimation of the mean vessel size within a given voxel. MR-VSI is based on the static changes in the reversible (ΔR2*) and irreversible (ΔR2) transversal relaxation rate after injection of a (super)paramagnetic contrast agent, ideally with long-circulating blood-pool characteristics, such as ultrasmall superparamagnetic particles of iron oxide (USPIO). Dennie and colleagues used Monte Carlo simulations in a rat brain model to demonstrate that, under certain conditions, the ratio of ΔR2*/ΔR2 correlates with the mean (micro)vessel diameter. 9 Troprès and colleagues and Kiselev and colleagues refined this initial MR-VSI model by including determination of the regional blood volume (rBV) and measurements of the regional diffusion coefficient to take into account the more complex in vivo vascular situation.10,11
In the past, several MR-VSI studies were carried out in orthotopic brain tumor models to validate differing VSI methods.9,12–14 Recently, first studies demonstrated the feasibility of quantitative VSI for longitudinal and response monitoring in brain gliomas, solid tumors, and bone metastasis.13,15–20 However, the majority of these preclinical MR-VSI studies were carried out at experimental high-field MR systems up to 9.4 T12 and/or relative high concentrations of USPIO above the expected clinical dose range.10,12–19 Bolus injection of high USPIO concentrations can cause systemic side effects (eg, back pain or cardiovascular adverse events) and local susceptibility artifacts with signal voids due to extremely short echo times.21,22 Furthermore, absolute quantification of the mean VS and the rBV could be hampered by the influence of B0 and B1 imperfections on ΔR2* and ΔR2.
The aim of this study was to evaluate a robust MR-VSI method for noninvasive quantification of the mean vessel size in solid tumors by using clinically relevant USPIO concentrations at a clinical 3.0 T MR scanner. MR-VSI results were correlated with ex vivo immunohistology (anti-CD31) and intravital microscopy (IVM). Moreover, to assess the potential of this MR-VSI method for antiangiogentic response evaluation, an initial treatment study was performed.
Materials and Methods
Cell Culture and Tumor Models
All experiments were approved by an institutional animal care committee. DU-4475, MDA-MB-435, and EOMA tumor cell lines were chosen due to their known differences in angiogenic activity and vessel morphology. The human breast cancer cells DU-4475 (ATCC: HTB-123), the genetically melanoma cells MDA-MB-435 (ATCC: HTB-129, initially classified as human breast cancer), and the murine hemangioendothelioma cells EOMA (ATCC: CRL-2568) were grown under established conditions.22,23 For each tumor model, 2 × 10⁶ cells were inoculated subcutaneously in the flank of athymic female nude mice (CD-1NU/NU, Charles River, Sulzfeld, Germany). DU-4475 (n = 7), MDA-MB-435 (n = 16), and EOMA (n = 7) xenografts were allowed to grow for 1 to 3 weeks until the tumors reached a total volume of approximately 500 to 1,000 μL.
Antiangiogenic Tumor Treatment
For antiangiogenic treatment studies, additional MDA-MB-435 xenografted mice were randomly assigned to either the treatment (n = 5) or the control (n = 5) group. Tumors were allowed to grow for 5 to 10 days with similar mean tumor volumes for the therapy group of 388 ± 110 μL and the control group of 338 ± 125 μL. A single dose of 60 mg/kg sunitinib (Sutent, Pfizer, New York, NY) was injected intraperitoneally every day over 1 week, or for controls, NaCl 0.9% (Braun, Melsungen, Germany). Sunitinib represents a Food and Drug Administration (FDA)-approved multi-targeted receptor tyrosine kinase inhibitor. 24
MR Vessel Size Imaging
MR imaging was carried out on a clinical 3.0 T MR system (Achieva, Philips, Best, the Netherlands) using a small solenoid coil (40 mm diameter, Philips Research Europe, Hamburg, Germany) with an implemented heating system to keep the mouse temperature constant during MR examination. All tumor-bearing animals were anesthetized by intraperitoneal injection of ketamine (125 mg/kg body weight) and xylazine (12.5 mg/kg body weight). For USPIO application, a custom-made 26-gauge intravenous catheter was inserted into the tail vein of the animals.
For MR-VSI of the mean vessel radius per voxel (R), the changes in the reversible R2* and the irreversible R2 relaxation rates were measured based on the equation from Kiselev and colleagues, 11 where ζ is the blood volume fraction and D is the diffusion coefficient:

ΔR2* was quantified using a multiple gradient echo (MGE) sequence with the first echo time (TE) at 3.1 ms; ΔTE, 4.0 ms; repetition time (TR), 261 ms; turbo spin echo (TSE) factor, 13; flip angle, 35°; matrix, 124 × 124; field of view (FOV), 50 × 50 mm; reconstructed voxel size, 0.19 × 0.19 mm; slice thickness, 1 mm; and acquisition time for four transversal slices, 00:34 minutes. ΔR2 was quantified using a multiple spin echo (MSE) sequence with the first TE at 6.6 ms; ΔTE, 7.0 ms; TR, 1,988 ms; TSE factor, 21; flip angle, 90°; matrix, 124 × 124; FOV, 50 × 50 mm; reconstructed voxel size, 0.19 × 0.19 mm; slice thickness, 1 mm; and acquisition time for four transversal slices, 06:01 minutes.
Both sequences were run once before and after intravenous injection of 40 μmol Fe/kg body weight of the long-circulating USPIO SH U 555 C (Bayer HealthCare, Berlin, Germany) and after a following second contrast injection, resulting in a total dose of 80 μmol Fe/kg body weight. For sunitinib treatment studies, a single dose of 80 μmol Fe/kg body weight was used. After each injection, the scan was performed with a delay of 3 to 5 minutes to allow for steady-state distribution of the particles in blood.
In our study, ΔR2* and ΔR2 were obtained from the ratio of the exponential multiple echo signal decays before and after contrast injection. The division of before and after signals Spre and Spost cancels out the multiplicative effects of large-scale field inhomogeneities in case of ΔR2* (

Any USPIO-related shortening of T1 will increase the overall amplitude M0 of the exponential decay (ie, signal at TE = 0). Therefore, the correction of this effect, especially when using short TR (TR < T1), is important. The effect is accounted for by estimation of the M0 increase (fast two-parameter fit of the exponential signal decay) and correction of the echo-wise signal ratio Spost/Spre, as described in more detail by Remmele and colleagues. 25 ΔR2* and ΔR2 were then obtained by weighted averaging of these estimates according to the following equation (given for ΔR2*):

The weighting factor δMGE is the expected standard deviation of ΔR2*, which is estimated by means of the error propagation function of equation 2. The above equations likewise hold for the calculation of ΔR2 from the multiple spin echo signals pre- and postinjection.
In this study, the blood volume fraction (ζ) was determined by the rBV based on the equation given by Zhu and colleagues 26 with a known reference blood volume fraction of muscle tissue in mice of 1.89%:

For the diffusion coefficient (D), we used known global apparent diffusion coefficient (ADC) values given by diffusion-weighted images (DWIs) at different b values (b = 0, 100, 500, 900), with D = 0.67 × 10⁻³ mm2/s for DU-4475, D = 0.77 × 10⁻³ mm2/s for MDA-MB-435, D = 0.84 × 10⁻³ mm2/s for EOMA, and D = 1.23 × 10⁻³ mm2/s for muscle tissue as given in Heemskerk and colleagues. 27
ΔR2, ΔR2*, rBV, and VSI maps were computed using a custom-built IDL-based research software tool (Philips Research Europe). ΔR2 and ΔR2* values ≤ 0, rBV values higher than 30%, and vessel size at magnetic resonance imaging (VSMRI) values larger than 200 μm were defined as invalid and were thus eliminated from the statistical analysis. First, a region of interest (ROI) was drawn in muscle tissue as identified on a T2-weighted image (sum of all echoes of the MSE sequence). The mean ΔR2* value in this ROI was used as ΔR2*Muscle for calibration of rBV of the tumor, as in equation 4. Then ROI covering the whole tumor tissue were drawn slice-wise on the same T2-weighted images and automatically copied to the corresponding parametric vessel size and rBV maps. Mean VSMRI and rBV values of each entire tumor were calculated. For VSMRI, the “fraction of valid voxels” (in percent) was obtained from the same ROI. Moreover, for internal validation, the mean VSMRI of the muscle tissue was measured.
Histologic Vessel Size
After MR imaging, xenografted tumors (n = 6 each) were explanted, snap frozen, and cut into sections of 5 μm thickness. These sections were incubated with a primary anti-CD31 antibody (BD Pharmingen, Heidelberg, Germany) and an alkaline phosphate–labeled secondary antibody (Dianova, Hamburg, Germany). The specific alkaline phosphatase activity was visualized with nitro blue tetrazolium/5-bromo-4-chloro-3'indolyl-phosphate (NBT/BCIP) substrate (Roche, Grenzach-Wyhlen, Germany) and costained with hematoxylin-eosin (Roth, Karlsruhe, Germany).
To obtain the immunohistologic vessel size (VSHISTO), the maximum vessel diameter of every visible vessel per microscope field (up to three FOV per slice at five sections of differing tumor regions; objective magnification X10) was measured using a light microscope (Eclipse TE 2000-U, Nikon, Japan), and the mean vessel radius (VSHISTO) of the entire tumor was calculated.
Vessel Size by IVM
For tumor tissue characterization, IVM of a xenograft subpopulation (n = 2 each) was performed under constant conditions of nitrous oxide/isoflurane anesthesia (N2O/O2 = 2:1 + 1.5% isoflurane). For IVM, a fluorescence microscope, integrated in a multipurpose microscope system (Zeiss Axioscope, Jena, Germany), with a zoom lens of 0.5 to 2.0 and a filter combination of 450 to 490/515 to 565 nm (excitation/emission) for sodium fluorescein, was used, which enabled an optical tissue penetration and vessel visualization of about 200 to 300 μm depth. 28
For each xenograft, 10 different areas of the tumor surface were randomly selected and video recorded. The intravital vessel size (VSIVM) was quantified offline by a frame-to-frame analysis of video-recorded microscopic images via a computer-assisted image analysis system (AnalySIS, SIS, Muenster, Germany). At each investigated area, the maximum vessel diameter of every visible vessel was measured and the mean vessel size radius (VSIVM) of the entire tumor was calculated.
Statistical Analysis
All data are presented as mean ± standard deviation (SD) over all animals of one tumor entity derived from the mean of each tumor. Statistical differences between the different tumor models were tested using one-way analysis of variance (ANOVA) with a Bonferroni posttest. Linear regression analysis was performed to calculate correlation coefficients between the MR vessel size distribution at the differing USPIO concentrations. Differences of one tumor type at different contrast concentrations were analyzed with a paired, two-tailed Student t-test, and p values < .05 were considered to be significant (InStat GraphPad, SanDiego, CA).
Results
MR Vessel Size Imaging
MR-VSI for In Vivo Tumor Tissue Characterization
MR-VSI allowed a clear pixel-by-pixel visualization of the mean vessel size distribution at the DU-4475 and MDA-MB-435 tumors, whereas in large areas of the highly vascularized EOMA xenografts, the MR-VSI analysis failed (Figure 1, A–C). However, quantitative measurements revealed significantly different VSMRI values between all three tumor models following injection of 40 and 80 μmol Fe/kg SH U 555 C (eg, 80 μmol Fe/kg: DU-4475, 20.6 ± 4.9 μm; MDA-MB-435, 37.4 ± 8.8 μm; and EOMA, 60.3 ± 9.6 μm; p, .05; Table 1 and Figure 2A). VSMRI values were slightly higher at the lower USPIO dose (eg, for DU-4475 with 23.8 ± 6.4 μm at 40 μmol vs 20.6 ± 4.9 μm at 80 μmol) but showed overall a good correlation with r2 = .75. Whereas the low and intermediated vascularized DU-4475 and MTA-MB-435 demonstrated high correlation coefficients (r2 = .84 and r2 = .77), the highly vascularized EOMA showed only a weak correlation between the two USPIO doses (r2 = .23; Figure 3). The absolute VSMRI values of all tumors were about 2.1- to 2.9-fold higher compared to histology. This overestimation was even slightly higher at the lower USPIO dosage (DU-4475, MTA-MB-435, and EOMA: 2.5-fold, 2.9-fold, and 2.1-fold at 40 μmol Fe/kg vs 2.1-fold, 2.7-fold, and 2.1-fold at 80 μmol Fe/kg). MR-VSI of muscle tissue for internal validation revealed similar VSMRI values over all xenografted mice, with also slightly higher VSMRI values at 40 μmol Fe/kg (see Table 1 and Figure 2C). Most valid voxels were obtained at the intermediate vascularized MDA-MB-435 with up to 83%, followed by the low vascularized DU-4475 with up to 70% after application of 80 μmol Fe/kg (Figure 2D). Slightly lower fractions of valid voxel were displayed at the lower USPIO concentration (eg, MDA-MB-435 78% at 40 μmol Fe/kg vs 83% at 80 μmol Fe/kg; Figure 4). In contrast, the highly vascularized EOMA showed a significantly lower amount of valid voxels of only about 17 to 18% (p < .001).
Overview of the Quantitative Results of MR-VSI, Histology, and IVM

IVM = intravital microscopy; MRI = magnetic resonance imaging; MR-VSI = magnetic resonance vessel size imaging; rBV = relative blood volume; VSHISTO = vessel size at anti-CD31 immunohistochemistry; VSIVM = vessel size at intravital microscopy; VSMRI = vessel size at magnetic resonance imaging. Data are presented as mean ± standard deviation, with ns (not significant),
p < .05,
p < .01, and
indicating too few values.

Magnetic resonance vessel size imaging (MR-VSI), histology, and intravital microscopy (IVM) images of DU-4475, MDA-MB-435, and EOMA xenografts. MR-VSI (A–C) showed clearly and with high-resolution parametric vessel size (VS)- maps of the DU-4475 (A, D, G), MDA-MB-435 (B, E, H), and EOMA (C, F, I) xenografts with increasing vascularity after application of 40 μmol Fe/kg body weight SH U 555 C (C: note the more pronounced areas of invalid black pixel at the highly angiogenic hemangioendothelioma EOMA). Anti-CD31 immunohistology (D–F) and IVM (G–I) corroborated the MR-VSI.
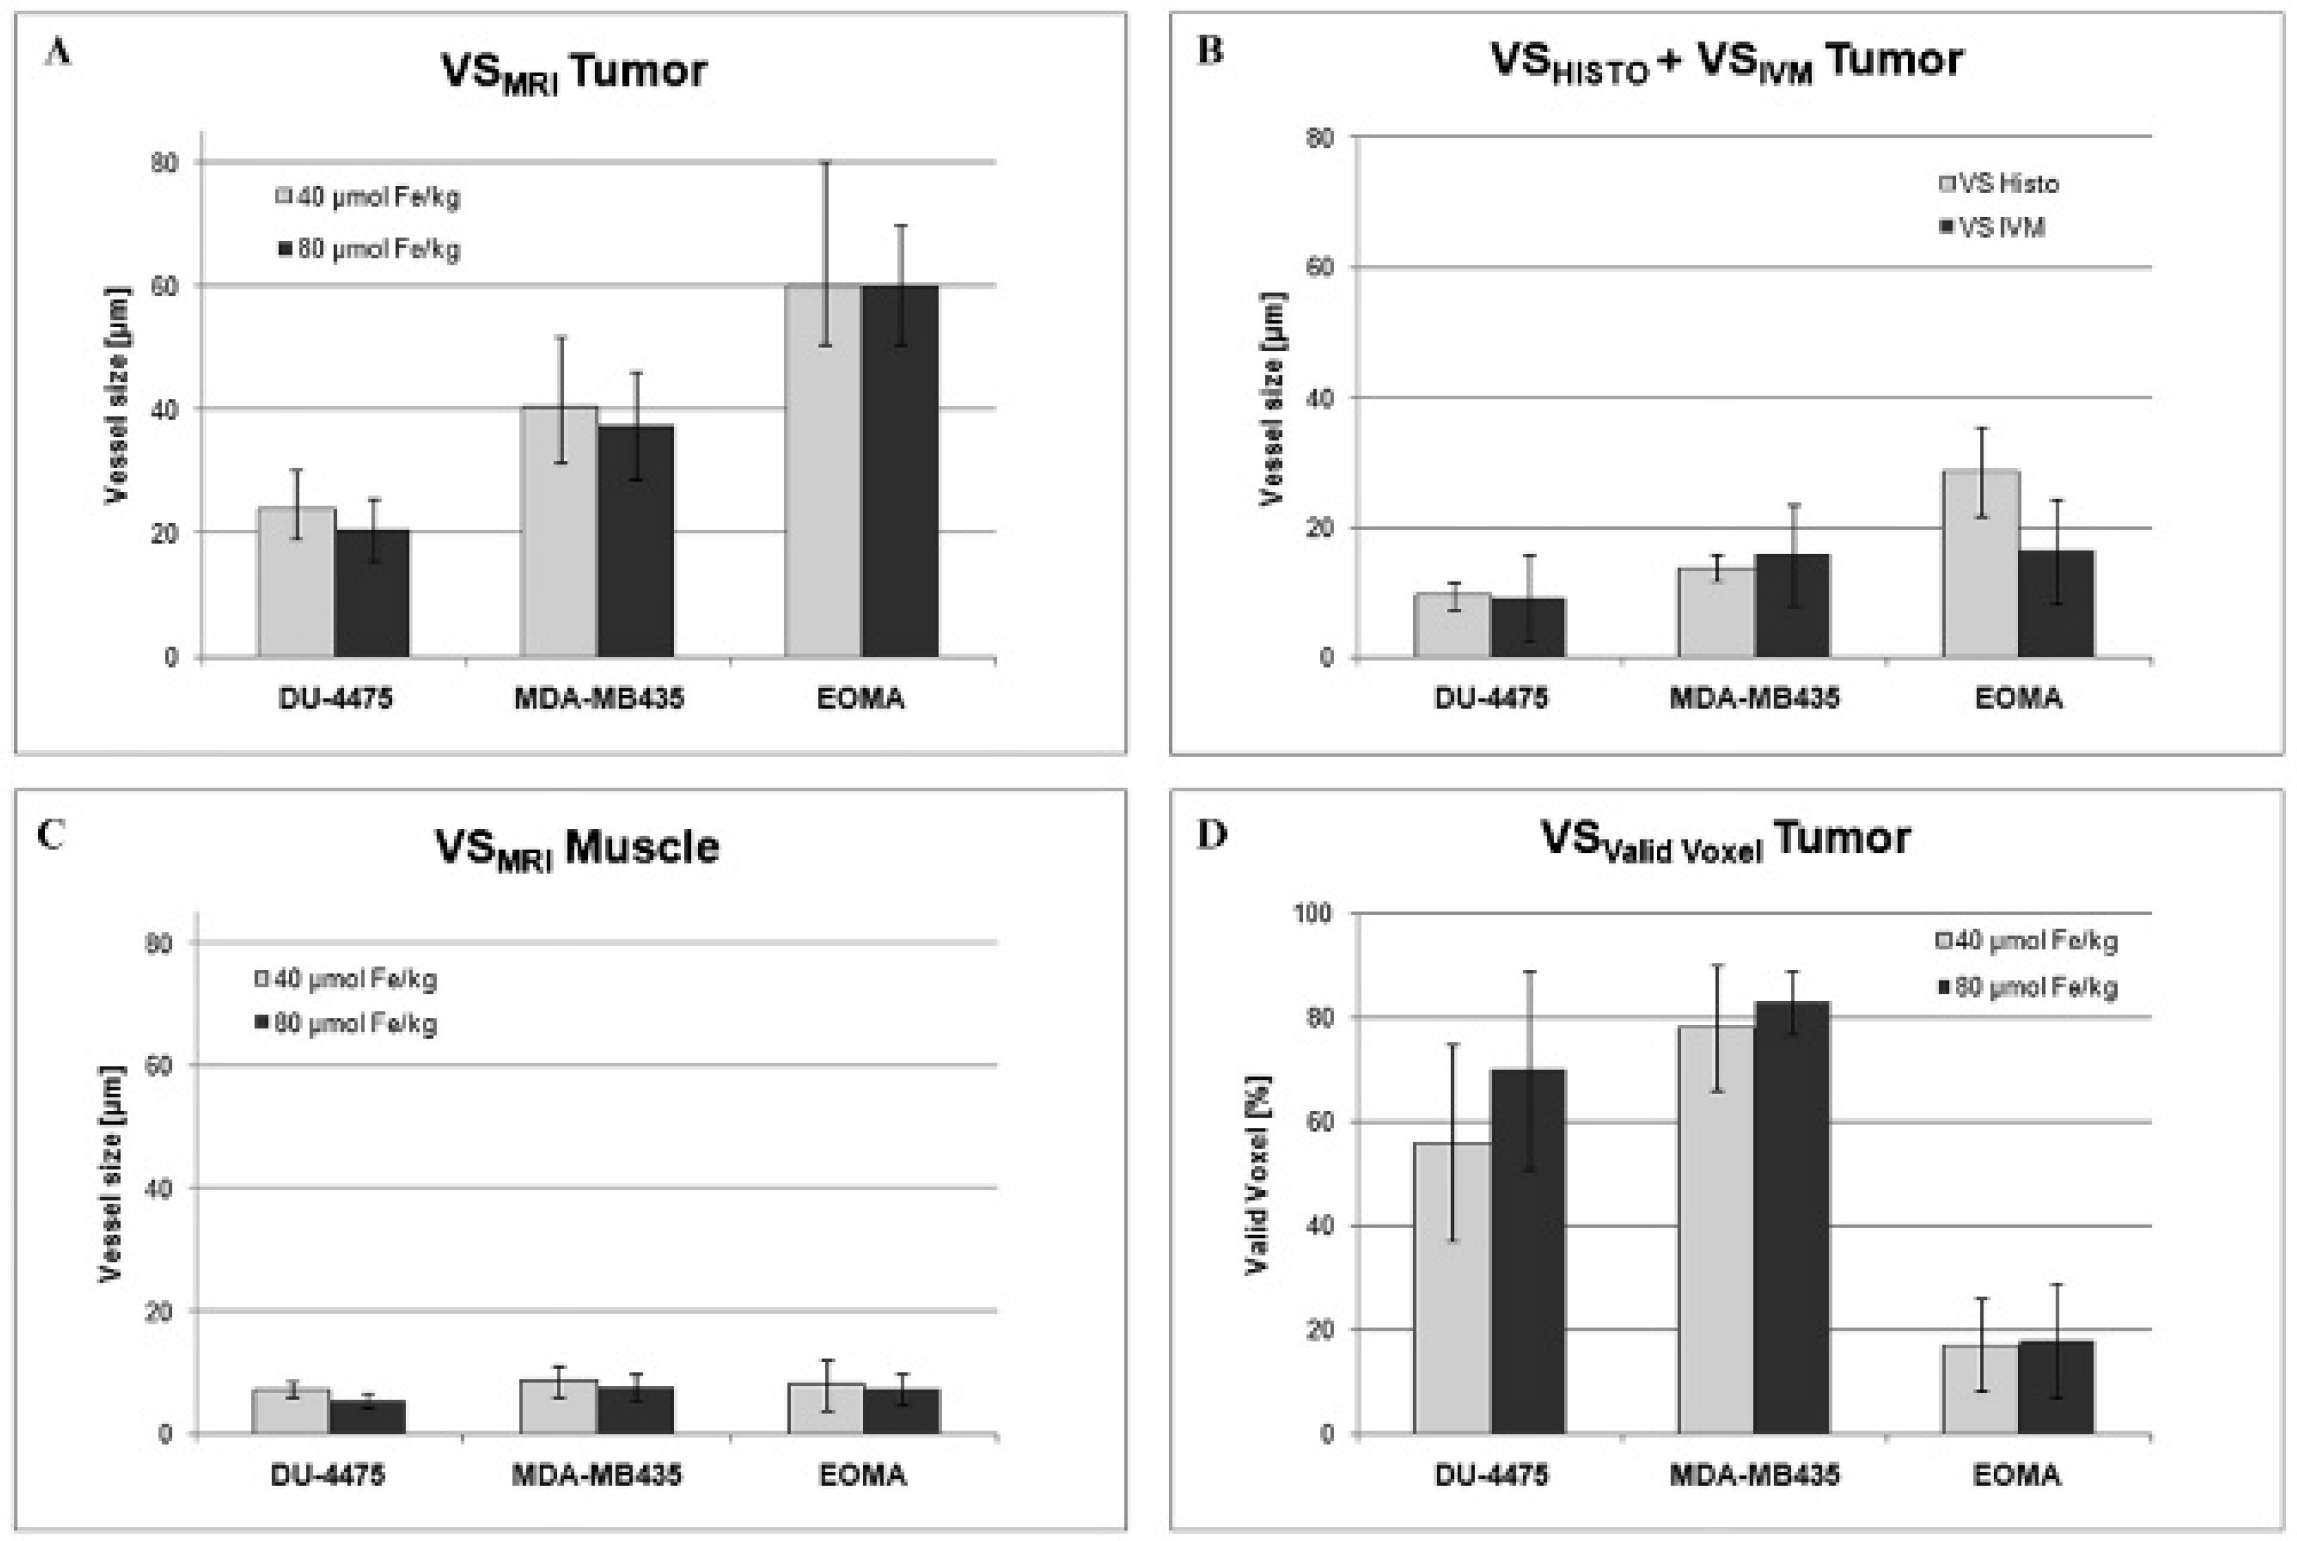
Quantitative results for magnetic resonance vessel size imaging (MR-VSI) (tumor and muscle tissue), histology, and intravital microscopy (IVM). MR-VSI revealed significantly increasing vessel size at magnetic resonance imaging (VSMRI) values of the different xenografts after injection of 40 and 80 μmol Fe/kg body weight SH U 555 C (A). MR-VSI results correlated well with the morphometrically measured vessel size at histology (VSHISTO) distribution, whereas the vessel size at magnetic resonance imaging (VSMRI) values was about two- to threefold higher (B). However, this systematic MR-VSI overestimation showed similar relative differences between the different xenograft tumors (A) and similar VSMRI values for muscle blood vessels (C). Intravital microscopy (IVM) corroborated the VSMRI and VSHISTO results for the DU-4475 and MDA-MB-435 but showed similar vessel size values at the superficial MDA-MB-435 and EOMA (D).

Correlation for magnetic resonance vessel size imaging results at 40 and 80 μmol Fe/kg. Values were slightly higher at the lower USPIO dose of 40 μmol Fe/kg, showing a good correlation at the low and intermediated vascularized DU-4475 and MDA-MB-435 with r2 = .84 and r2 = .77 but a weak correlation at the highly vascularized EOMA with r2 = .23.

Parametric magnetic resonance vessel size imaging (VSI) and relative blood volume (rBV) maps of a representative MDA-MB-435 xenograft tumor. Robust magnetic resonance relaxometry provided a pixel-wise visualization of the complementary mean vessel size (VSI; A, B) and rBV (C, D) after application of 40 μmol (A, C) and 80 μmol (B, D) Fe/kg SH U 555 C. Note the minimal higher fraction of valid voxels at the higher USPIO concentration (arrows).
Analysis of the rBV revealed significant different values between all three tumor models at both USPIO concentrations (eg, DU-4475: 1.5 ± 0.3%, MDA-MB-435: 3.2 ± 1.2%, and EOMA: 9.0 ± 2.9% at 40 μmol Fe/kg, p < .05; see Table 1). Only the highly vascularized EOMA showed a lower rBV value at the higher USPIO dose compared to the lower USPIO dose (6.8 ± 2.5 at 80 μmol Fe/kg, p =. 15), although the difference was not significant.
MR-VSI for Antiangiogenic Treatment Response Evaluation
Sunitinib-treated tumors demonstrated tumor shrinkage with significantly lower tumor volumes compared to the control group after 7 days (sunitinib 198 ± 34 mm3 versus controls 2,001 ± 223 μL, p = .008). MR-VSI revealed significant lower vessel sizes after sunitinib therapy compared to controls (VSMRI: sunitinib 44.8 ± 6.5 μm versus controls 68.7 ± 7.9 μm, p = .03; Table 2 and Figure 5). Likewise, the rBV was significantly reduced after sunitinib treatment (rBV: sunitinib 2.2 ± 0.3% versus controls 3.2 ± 0.3%, p = .04). After sunitinib therapy, a slightly lower fraction of valid voxel was acquired (sunitinib 62 ± 10% vs controls 79 ± 11%, p = .09).
Antiangiogenic Sunitinib Therapy of MDA-MB-435 Xenografts

MRI = magnetic resonance imaging; rBV = relative blood volume; VSHISTO = vessel size at histology; VSMRI = vessel size at magnetic resonance imaging.
Sunitinib-treated tumors showed a significantly lower vessel size (VSMRI) and rBV compared to controls. VSMRI demonstrated a twofold overestimation compared to VSHISTO. After sunitinib therapy, a slightly lower fraction of valid voxels was acquired.
Data are presented as mean ± standard deviation, with ns (not significant),
p < .05, and
p < .01.
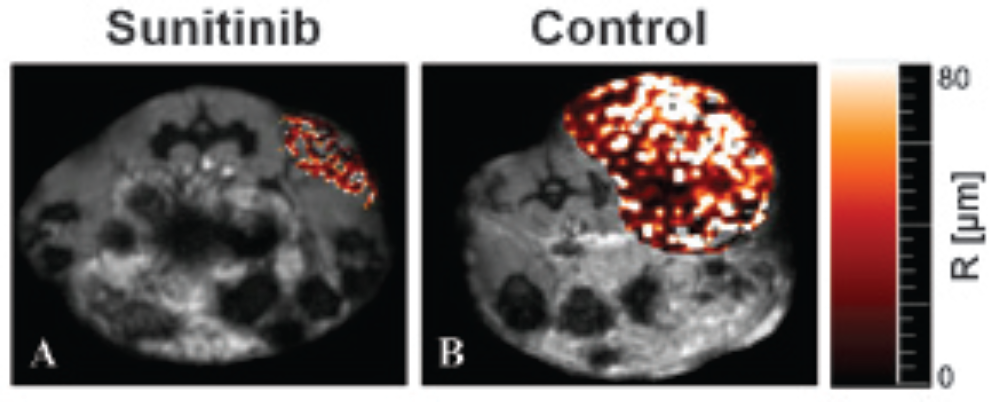
Magnetic resonance vessel size imaging (MR-VSI) of sunitinib-treated and control MDA-MB-435 xenografts. Parametric MR-VSI maps of an exemplary MDA-MB-435 xenograft tumor 7 days after sunitinib therapy (A; 60 mg/kg sunitinib per day) and control specimen (B). Quantitative MR-VSI measurements revealed significant lower VSMRI values after sunitinib therapy (p = .03), in line with shrinkage of the tumor volume (p = .008) and lower vessel size at the anti-CD31 immunohistology compared to controls (p = .001).
Vessel Size at Immunohistochemistry
On anti-CD31–stained tissue sections of DU-4475 and MDA-MB-435 tumors, the blood vessels could be clearly delineated (Figure 1, D–F). EOMA tumors showed “normal” tumor blood vessels at the tumor periphery, whereas at the center, areas of enlarged “cavernous” blood vessels were detected (Figure 6). Quantitative analysis showed increasing mean vessel sizes between all three tumor models, with VSHISTO values of 9.6 ± 2.1 μm for DU-4475, 13.8 ± 2.0 μm for MDA-MB-435, and 28.7 ± 6.9 μm for EOMA, whereas the difference between DU-4475 and MDA-MB-435 was not statistically significant (p > .05; see Table 1). Sunitinib-treated MDA-MB-435 tumors demonstrated significant lower VSHISTO values compared to controls (sunitinib 18.2 ± 0.9 μm versus controls 30.8 ± 0.8 μm; p = .001).
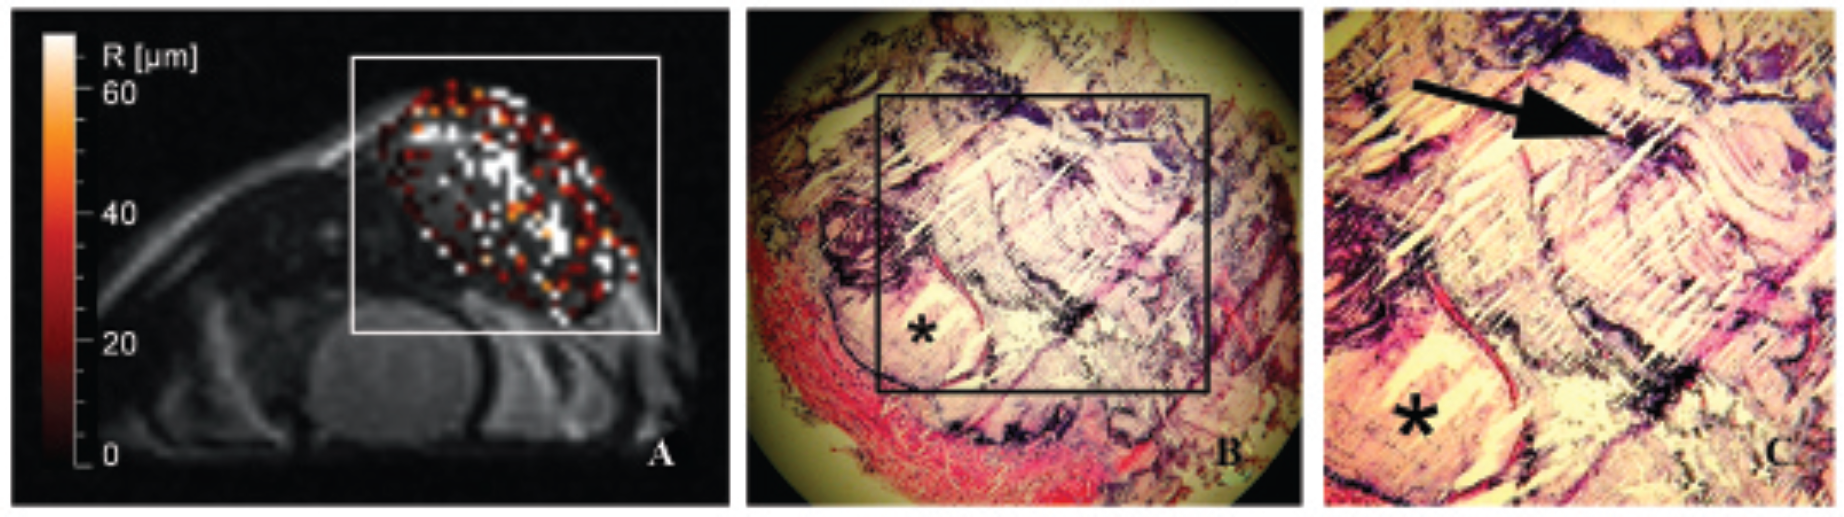
Magnetic resonance vessel size imaging (MR-VSI) and corresponding histology of a representative hemangioendothelioma (EOMA). MR-VSI of a EOMA xenograft with large areas of invalid voxel after injection of 80 μmol Fe/kg body weight SH U 555 C (A). These areas of invalid voxel correlated well with areas of enlarged “cavernous” blood vessel (star) in the tumor center at anti-CD31–stained histologic section (5×), whereas at the superficial tumor, smaller “normal” tumor vessels (arrow) are detectable (B, C).
Vessel Size at Intravital Microscopy
IVM allowed for in vivo evaluation of superficial blood vessels at all three tumor models (Figure 1, G–I). Quantitative IVM measurements demonstrated a lower mean vessel size for DU-4475 with 9.1 ± 6.7 μm compared to MDA-MB-435 with 15.8 ± 7.6 μm but showed similar VSIVM values for MDA-MB-435 and EOMA with 16.4.8 ± 8.1 μm (see Table 1).
Discussion
With the increasing knowledge of cancerogenesis, the clinical practice of oncology has become increasingly personalized. 29 Hence, there is a major interest in the development and clinical implementation of modern quantitative imaging methods for in vivo tumor tissue characterization and early assessment of treatment effects in patients. Especially with the introduction of new molecular targeting drugs in first- and second-line cancer therapies, there is a strong clinical need for a reliable prognostic, predictive, and treatment response biomarker for medical and economic reasons.
VSI allows noninvasive assessment of the mean vessel size, potentially serving as a novel imaging biomarker. In this study, we evaluated the feasibility of quantifying the mean vessel size in solid tumors using a robust MR-VSI technique by using a clinically applicable USPIO dose range at a clinical 3.0 T MR scanner. Our MR-VSI method is based on the change in R2* and R2 induced by the injection of USPIO9,10 using the VSI equation from Kiselev and colleagues. 11 ΔR2* and ΔR2 were estimated from the ratio of the exponential multiple gradient and multiple spin echo signals before and after contrast agent injection to increase the dynamic range and the robustness of the quantification.22,25 The assumption underlying this approach is that the division of signals before and after injection eliminates the multiplicative and nonexponential effect of static B0 field inhomogeneities (MGE) as well as B1 and slice imperfections (MSE), as described in detail by Remmele and colleagues. 25 Since in our method the VSI and rBV values are both related to changes in the transverse relaxation rates after USPIO injection, the proposed method allows for the concurrent estimation of two physiologic measures in one study.
Kiselev and colleagues used a single-shot gradient echo spin echo (GESE) sequence with only two fixed echo planar readouts at TEGE = 23 ms and TESE = 95 ms to measure contrast agent–induced susceptibility effects at the first pass after injection of a paramagnetic gadolinium-based contrast agent (Gd-DTPA). 11 Since Gd-DTPA (Magnevist) is clinically approved, they were able to demonstrate the translation of the MR-VSI technique into humans for the first time in a human brain tumor study. However, the use of paramagnetic gadolinium chelates, and thus the need for very fast single-shot techniques, has three main disadvantages. First, the (single) echo times can be optimized only for a specific ΔR2* and ΔR2, whereas at these fixed echo times, only a small range of ΔR2* and ΔR2 values can be accurately measured. But ΔR2* and ΔR2 could extremely vary within the concentration of the contrast agent (at the first pass) and may further differ significantly between different tumor entities and during anticancer treatment. Second, the exact time point of the first pass is highly dependent on the individual arterial input function (eg, cardiac function and tumor location). 30 Third, the accuracy of the measurement could also be limited by strong first-pass extravasation of extracellular low-molecular-weight gadolinium chelates (such as Gd-DTPA), which might be overcome by long-circulating gadolinium chelates with protein binding characteristics (eg, gadofosveset trisodium) 31 or a “preload” of extracellular gadolinium chelates. 32 However, the higher R2 relaxivities of (ultrasmall) superparamagnetic particles of iron oxide (SPIO) compared to gadolinium-based contrast agents and their “pure” steady-state blood-pool characteristics emerge to be beneficial for MR-VSI. The majority of the existing preclinical MR-VSI studies used long-circulating USPIO but at relatively high concentrations of about 200 μmol Fe/kg10,17–19,33 and even higher. 16 These USPIO doses appear above the clinically relevant contrast concentration. Recently, Remmele and colleagues presented a simultaneous ΔR2 and ΔR2* MR technique, which allowed for concurrent mapping of the vessel size and the rBV by using the clinically approved SPIO SH U 555 A (Resovist) in a patient with a pleomorphic sarcoma. 25 Nevertheless, absence of commercially marketed SPIOs and absent clinical approval of USPIOs is a disadvantage. Nevertheless, currently there are clinical MR studies (eg, National Institutes of Health NCT 00103038) using ferumoxytol (Feraheme), an FDA-approved USPIO for iron replacement therapy, in an off-label use fashion. 34 Moreover, there are also new long-circulating blood-pool agents consisting of very small SPIO under preclinical investigation.35,36
In this study, our robust MR-VSI method provided a pixel-wise visualization of the complementary mean vessel size (VSMRI) and rBV over the whole tumor after application of 40 and 80 μmol Fe/kg of the USPIO SH U 555 C. SH U 555 C consists of a subfraction of the clinically approved SH U 555 A (Resovist). 37 In the poorly vascularized DU-4475 and intermediately vascularized MDA-MB-435, clear mapping of the VSMRI and rBV was feasible, whereas at the highly vascularized hemangioendothelioma EOMA, larger areas of invalid voxels were detected. In a direct comparison of one EOMA tumor, central areas of invalid voxel at MR-VSI correlated well with areas of enlarged “cavernous” blood vessels in the tumor center on anti-CD31–stained histologic sections. Thus, this finding might be explained by physical limitations with R2* signal voids at MGE due to high local USPIO concentrations at extremely large blood vessels and tumor blood volume, and even division by low ΔR2 values at larger vessel sizes due to complete rephasing at MSE. However, quantitative MR-VSI analysis over the whole entire tumor revealed significantly different VSMRI values between all three mice xenograft models with known differing angiogenic activity at both USPIO concentrations. Our MR-VSI results correlated well with the morphometrically measured VSHISTO distribution, whereas the absolute VSMRI values were about two- to threefold higher than the histologic results. This overestimation of the vessel size by MRI, as seen here, is in good agreement with previous results among others from Troprès and colleagues, which revealed overestimation of 1.9- to 2.7-fold at low USPIO doses of 30 μmol Fe/kg and showed good agreement with histology at higher concentration of about 205 μmol Fe/kg. 38 Assuming a threefold overestimation at the lower USPIO concentration, our VSMRI results of the muscle tissue were in good agreement with previously reported blood vessel sizes in the muscle tissue of about 2.2 μm determined by ex vivo three-dimensional two-photon laser scanning microscopy. 39 Troprès and colleagues and Kiselev and colleagues explored the methodical reasons of this systematic overestimation by MR-VSI in detail.10,11,40 The reason for this systematic overestimation has been pointed out to be mainly caused by a number of simplified assumptions behind the basic MRI-VSI equation (equation 1). This MRI-VSI equation neglects the intravascular signal, the native blood paramagnetism, a departure from the static regimen of spin dephasing around capillaries, and the echo time dependence of the relaxation rates.
Using our MR-VSI method, we revealed significant lower VSMRI and rBV values after antiangiogenic sunitnib therapy compared to controls. The lower VSMRI of about −34% was in good agreement with the histology, which demonstrated a lower VSHISTO of about −40%. Recently, Merz and colleagues demonstrated in a breast cancer bone metastasis model an increase in the mean vessel size of about 60% after sorafenib tosylate therapy, whereas paclitaxel therapy resulted in a decrease of about −26%. 18 The reason for this discrepancy might be differences in the tumor's microenvironment (eg, fraction of smaller immature and larger mature vessels) and mechanism of action of antiangiogenic tumor therapy (eg, destruction of smaller immature vessels by persistence of mature vessels, resulting in an overall increase in the mean vessel size or preferred targeting of larger preexisting mature tumor vessels). On the other hand, the mean vessel size could change during maturation of the tumor's vasculature with an increase in the mean vessel size at early tumor stages after the angiogenic switch. 41 These data demonstrate the complex and sometimes differing molecular effects of antiangiogenic agents to the tumor's microenvironment and modification during cancerogenesis. Thus, MR-VSI might be helpful to elucidate and understand therapy-related changes at the vascular microstructure in vivo. Therefore, systematic overestimation of true vessel size by lower USPIO doses may well be irrelevant because differences in tumor histology can still be depicted, and, finally, the change in mean vessel size under tumor growth or tumor therapy is probably most important. Thus, the robustness, as opposed to the accuracy, of the method represents the major clinical challenge.
On the other hand, using histology for determination of the “true” mean vessel size might be somewhat limited by systematic biases (eg, evaluation of limited tumor areas, inclusion of perfused and nonperfused tumor vessels, and/or transformation at the immunohistochemistry staining process). To minimize this bias, we measured the maximum vessel diameter of all visible blood vessels at different tumor areas in a randomized fashion and performed additional in vivo measurements by IVM. Merz and colleagues calculated the mean histologic vessel size by measuring only diameters of orthogonally cut vessels. 18 This approach was impractical in our study because we intended to compare the mean vessel size between ex vivo histologically tissue section and in vivo IVM and MRI. In our study, IVM corroborated the VSHISTO results for DU-4475 and MDA-MB-435 but showed similar VSIVM values between MDA-MB-435 and EOMA. This might be caused by the limited IVM tissue penetration of up to 200 to 300 μm in depth and predominantly enlarged cavernous blood vessels in the center of the EOMA tumors, as demonstrated by histology and MR-VSI.
Generally, quantification of the VSMRI requires knowledge of the diffusion constant and should be optimally measured and registered on a pixel-by-pixel basis. In accordance with other studies, we used fixed mean ADCs for each tumor model to avoid the influence of artifacts derived by DWI.11,42,43 However, this might be a limitation, especially in longitudinal treatment studies with associated changes in the tumor cellularity and measured ADC, but this was beyond the purpose of this study, which focused on the evaluation of a robust MR-VSI method with correction of local and global B0 and B1 imperfections at two clinically relevant USPIO concentrations.
We set up thresholds for invalid MR-VSI voxels of rBV values higher than 30% and vessel size values larger than 200 μm. In a rat glioma study with very small vessel sizes (up to 5.8 ± 4.1 μm), Troprès and colleagues used a threshold of 17% for the rBV. 42 In this study, a peritumoral rBV dropoff was discussed to be caused by the underestimation due to the exclusion of pixels with a higher rBV. In our study, with respect to the highly vascularized hemangioendothelioma (EOMA), an upper rBV limit of 30% was chosen. We also set an upper VS limit of 200 μm, which was in line with a colorectal xenograft study from Ungersma and colleagues 44 and reported vessel diameters of up to 250 μm in glioma brain tumors measured by scanning electron microscopy. 45 However, there are physical limitations for higher vessel size and rBV thresholds (as discussed above). In our study, a further increase in the used vessel size or rBV limit allowed no detection of higher mean vessel sizes even at the extreme angiogenic EOMA (data not shown).
In a clinical phase I MR angiography trial, SH U 555 C was safely injected in concentrations of 20, 40, 60, and 80 μmol Fe/kg and showed a constant intravascular enhancement in the aorta after bolus injection and during equilibrium phase over an observation period of 45 minutes. 46 Furthermore, there are several clinical studies using USPIO at a concentration of 40 μmol (or 2.6 mg) Fe/kg for, for example, myocardial perfusion, imaging of lymph node metastasis, arteriosclerotic plaques, and inflammatory brain lesions.47–50 In this study, SH U 555 C was injected at concentrations of 40 and 80 μmol Fe/kg body weight, which allowed a clear vessel size and rBV mapping at the low and moderately vascularized xenograft tumor model as examples of common solid cancer. At the extremely highly vascularized hemangioendothelioma, representing a rare and atypical clinical cancer, larger areas of invalid voxel occurred. However, our robust MR-VSI method still allowed a quantitative differentiation of all three xenograft tumors. From our point of view, SH U 555 C at a dose of 40 to 80 μmol Fe/kg seems to be adequate enough for MR-VSI. For bolus applications of higher USPIO concentrations, side effects (eg, back pain and cardiovascular adverse events) have been reported, 21 and lower concentrations less than 40 μmol Fe/kg might be problematic for concurrent rBV mapping, as reported by Persigehl and colleagues. 22
Conclusion
Robust MR-VSI allows the in vivo visualization and quantification of the mean vessel size in xenografted solid tumors of varying vascularity and after antiangiogenic therapy by using a clinically relevant USPIO dose range at a clinical 3.0 T MR scanner. Further studies are warranted to evaluate the benefit of this MR-VSI technique for noninvasive angiogenesis observation, tumor characterization, guidance of biopsies, and early treatment monitoring in oncology.
Footnotes
Acknowledgment
Financial disclosure of authors: This work was partly supported by the German Research Foundation (DFG; SFB656 C8), CoreUnit Opti of the University of Muenster, and the German Ministry of Education and Research (BMBF; OTHENA 13N10291).
Financial disclosure of reviewers: None reported.