
Abstract
Monitoring of radiochemotherapy (RCX) in patients with glioblastoma is difficult because unspecific alterations in magnetic resonance imaging with contrast enhancement can mimic tumor progression. Changes in tumor to brain ratios (TBRs) in positron emission tomography (PET) using O-(2-[18F]fluoroethyl)-L-tyrosine (18F-FET) after RCX with temozolomide of patients with glioblastoma have been shown to be valuable parameters to predict survival. The kinetic behavior of 18F-FET in the tumors is another promising parameter to analyze tumor metabolism. In this study, we investigated the predictive value of dynamic 18F-FET PET during RCX of glioblastoma. Time-activity curves (TACs) of 18F-FET uptake of 25 patients with glioblastoma were evaluated after surgery (FET-1), early (7–10 days) after completion of RCX (FET-2), and 6 to 8 weeks later (FET-3). Changes in the time to peak (TTP) and the slope of the TAC (10–50 minutes postinjection) were analyzed and related to survival. Changes in kinetic parameters of 18F-FET uptake after RCX showed no relationship with survival time. In contrast, the high predictive value of changes of TBR to predict survival was confirmed. We conclude that dynamic 18F-FET PET does not provide additional prognostic information during RCX. Static 18F-FET PET imaging (20–40 minutes postinjection) appears to be sufficient for this purpose and reduces costs.
STANDARD TREATMENT OF PATIENTS with glioblastoma includes surgery followed by radiotherapy with concomitant and adjuvant temozolomide chemotherapy (RCX). 1 To date, contrast-enhanced magnetic resonance imaging (MRI) is the method of choice to monitor treatment response, but the reliability in distinguishing recurrent or progressive tumor from unspecific contrast enhancement due to treatment effects is limited. 2 Positron emission tomography (PET) using radiolabeled amino acids provides important information in brain tumor diagnostics in addition to conventional MRI. 3 O-(2-[18F]Fluoroethyl)-L-tyrosine (18F-FET) is a well-established amino acid tracer, and a number of studies have proven the clinical value of 18F-FET PET to determine the extent of cerebral gliomas, to guide biopsies, to plan treatment, and to detect tumor recurrences.4–9 In a previous study, we observed that a decrease in the maximum and mean tumor to brain ratio (TBRmean and TBRmax) of 18F-FET uptake in postoperative residual tumor tissue 7 to 10 days after completion of RCX predicts survival more reliably than contrast enhancement in MRI.10,11
A number of studies have indicated that the evaluation of 18F-FET kinetics may provide additional diagnostic information for tumor grading and for the differentiation of recurrent high-grade glioma or brain metastases from radiation-induced changes.12–15 Thus, the time-activity curves (TACs) of high-grade gliomas of World Health Organization (WHO) grade III or IV predominantly showed an early peak of 18F-FET uptake around 10 to 15 minutes after injection followed by a decreasing curve, whereas in low-grade gliomas of WHO grade I or II, a steadily increasing TAC without an identifiable peak of the tracer uptake seems to be typical. 15
Dynamic 18F-FET imaging, however, requires longer acquisition times (50 minutes vs 20 minutes), which reduces the number of patients who can be investigated with one synthesis of 18F-FET and thus increases the costs of the investigation in routine clinical practice. Therefore, it is important to clarify whether dynamic 18F-FET imaging provides essential diagnostic information regarding treatment response, especially during standard treatment of patients with glioblastoma. In this study, we analyzed dynamic 18F-FET PET data of 25 patients with glioblastoma who were investigated in a previous prospective study before and after RCX for the assessment of treatment response with respect to survival time.10,11,16
Methods and Materials
Patients
Within a time period from January 2007 to June 2010, 25 consecutive patients with glioblastoma were included in this prospective study. There were 15 male and 10 female patients. The mean age was 54 years (range 36–73 years). The tumor was located in the frontal, temporal, parietal, or occipital lobe in 9, 7, 8, or 1 patient, respectively. All patients were treated with cytoreductive surgery. According to neurosurgical reports, 13 surgical interventions were rated as partial resections and 12 as gross total resections, although considerable tumor remnants were detected on 18F-FET PET in the majority of these patients (Table 1). Surgery was followed by an external fractionated radiotherapy with concomitant temozolomide (RCX; 75 mg temozolomide per square meter of body surface area per day, 7 days per week from the first to the last day of radiotherapy) and after a 4-week break adjuvant temozolomide chemotherapy (150–200 mg temozolomide per square meter of body surface area over 5 days, repeated every 23 days, six cycles) according to European Organisation for Research and Treatment of Cancer (EORTC) trial 22981/26981. 1 Further details on the general prognosis of the patients as classified by recursive partitioning analysis (RPA) scores and the O 6 -methylguanine-DNA methyltransferase status (MGMT) and the implementation of radiotherapy have been described previously.10,11,16 The university ethics committee and federal authorities approved this study. All subjects gave written informed consent prior to their participation in the study.
Patient Characteristics, TBRmax, TBRmean, TTP, SoD, and Slope in relation to Progression-Free and Overall Survival
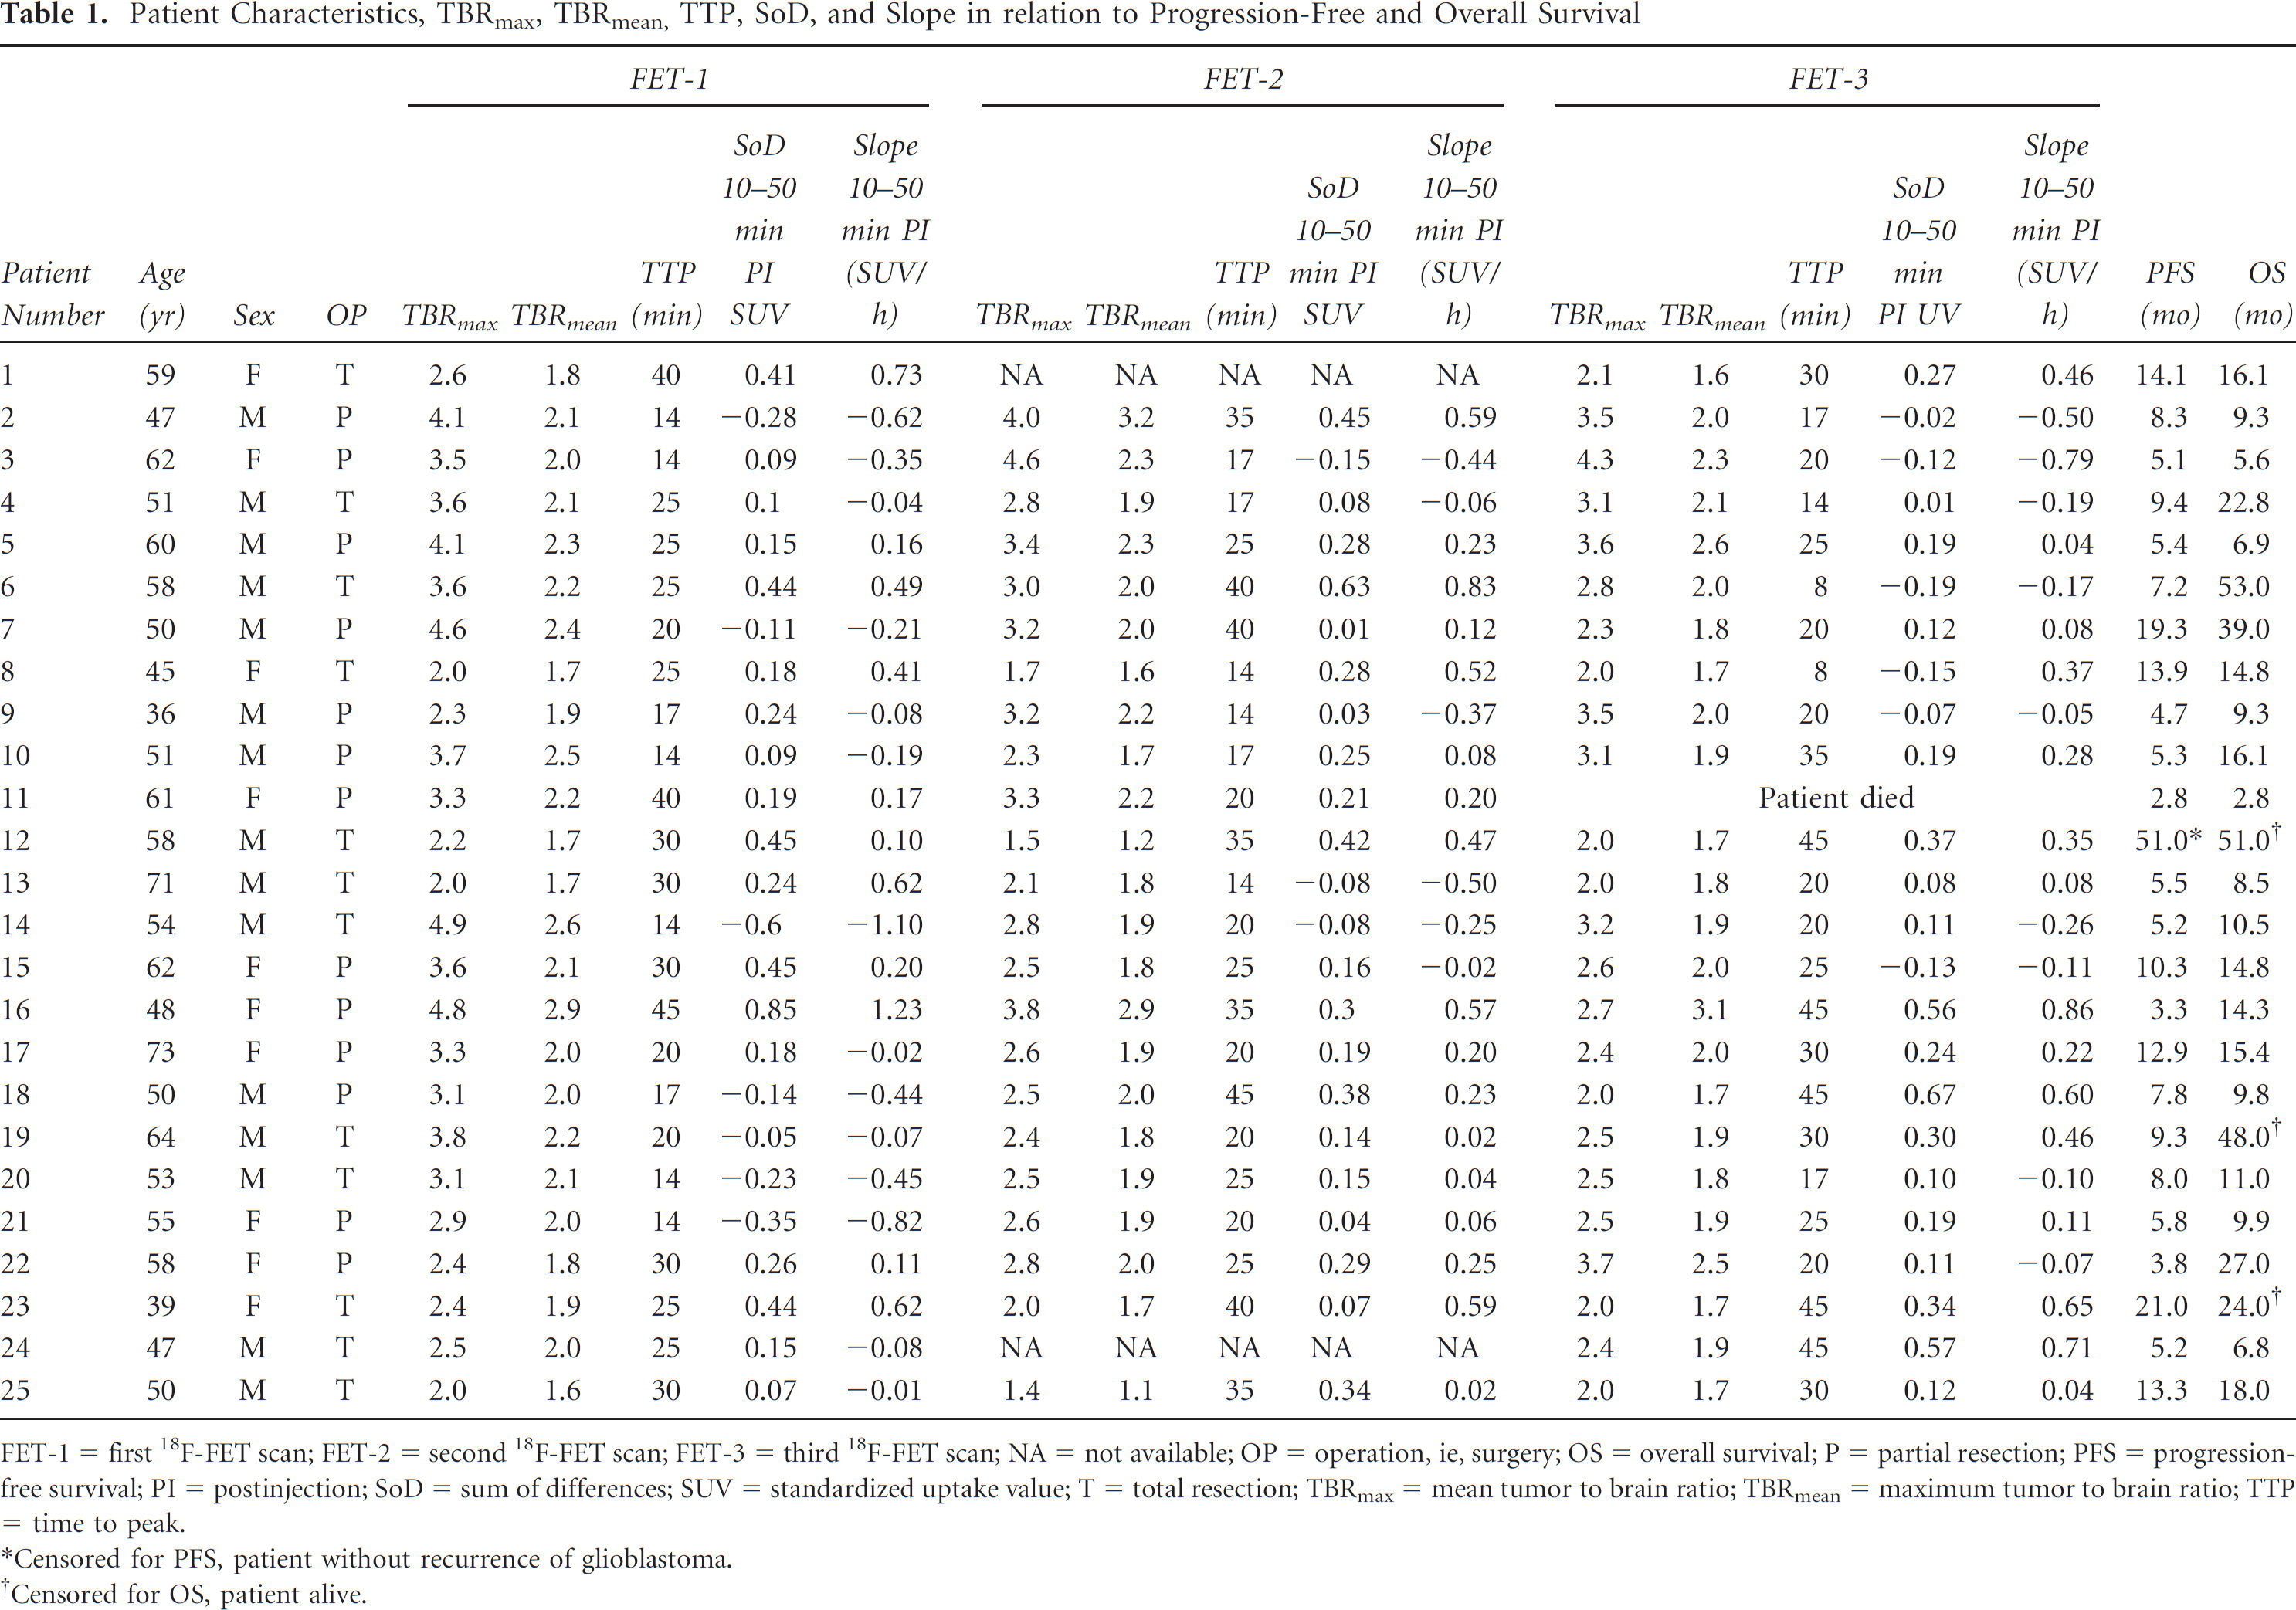
FET-1 = first 18F-FET scan; FET-2 = second 18F-FET scan; FET-3 = third 18F-FET scan; NA = not available; OP = operation, ie, surgery; OS = overall survival; P = partial resection; PFS = progression-free survival; PI = postinjection; SoD = sum of differences; SUV = standardized uptake value; T = total resection; TBRmax = mean tumor to brain ratio; TBRmean = maximum tumor to brain ratio; TTP = time to peak.
Censored for PFS, patient without recurrence of glioblastoma.
Censored for OS, patient alive.
PET Imaging and Analysis
The amino acid 18F-FET was produced via nucleophilic 18F-fluorination with a specific radioactivity of > 200 GBq/μmol as described previously. 17 All patients remained fasted for at least 12 hours before the PET studies. The first PET scan (FET-1) was performed in all 25 patients before RCX, a second PET scan (FET-2) 7 to 10 days after, and a third PET scan (FET-3) 6 to 8 weeks after completion of RCX.
Dynamic PET studies were acquired up to 50 minutes after intravenous injection of 200 MBq 18F-FET on an ECAT EXACT HR+ scanner (Siemens Medical Systems, Inc., Knoxville, TN) in three-dimensional mode (32 rings; axial field of view 15.5 cm). Attenuation correction and data reconstruction were done as described previously. 7 All patients had routine MRI using a 1.5 T MRI scanner with a standard head coil before and after administration of gadolinium–diethylenetriaminepentaacetic acid (Gd-DTPA) (T1, T2, and fluid-attenuated inversion recovery [FLAIR] sequence, slice thickness 1 mm). Summed 18F-FET PET images (20–40 minutes postinjection) and MRI were automatically coregistered using the VINCI tool (Max Planck Institute, Cologne, Germany). 18 18F-FET uptake in the unaffected brain tissue was determined by a larger region of interest (ROI) placed on the contralateral hemisphere in an area of normal-appearing brain tissue including white and gray matter (mean area 2,082 ± 3,69 mm2). The tumor area on 18F-FET PET scans was determined by a three-dimensional autocontouring process using a cutoff for the tumor to brain ratio (TBR) of 18F-FET uptake of ≥ 1.6. This cutoff was based on a previous biopsy-controlled study in which a lesion to brain ratio of 1.6 had separated best tumor from nontumor tissue. 7 Manual corrections of the tumor ROI were applied if radioactivity in blood vessels or tracer uptake in postoperative extracerebral soft tissue exceeded the cutoff value. Maximum and mean tumor to brain ratios (TBRmax and TBRmean) were calculated by dividing the mean and maximum ROI value (Bq/mL) of the tumor lesion by the mean ROI value of normal brain tissue in the 18F-FET PET scans. The 18F-FET-positive tumor volume at a cutoff of the TBR ≥ 1.6 (Tvol 1.6) was determined.
18 F-FET uptake kinetics was assessed in the tumor ROI in FET-1 (mean standardized uptake value [SUV] 20–40 minutes postinjection), which corresponded to the planning target volume of radiotherapy. 16 To analyze the changes in 18F-FET uptake kinetics in that area during RCX, these ROI were transferred to the corresponding slices in FET-2 and FET-3 after coregistration as described above. The position of the transferred ROI was inspected and, if necessary, adapted to the tumor maximum when an anatomic shift was observed due to the shrinkage of the resection cavity. TACs were generated by application of the ROI of the lesions (20–40 minutes) to the entire dynamic data set. To quantify the slope of the curve in the late phase of 18F-FET uptake, a linear regression line was fitted to the late phase of the curve (10 and 50 minutes postinjection). Furthermore, the TAC was characterized by the time to peak (TTP; time in minutes from the beginning of the dynamic acquisition up to the maximum SUV of the lesion) 12 and by the sum of differences (SoD) from 10 to 50 min postinjection according to Pöpperl and colleagues. 14
Definition of Survival Times
Overall survival time (OS) was defined as the interval from the date of surgery to the date of death or, if the patients were still alive, as the interval from the date of surgery to the date of last contact. Progression-free survival (PFS) was defined as the time interval from the date of surgery to the date of first documented evidence of disease progression, based on MRI and/or neurologic deterioration. Progressive disease on MRI was defined according to the Macdonald criteria. 19
Relation of PET Parameters and Prognosis
The relative and absolute changes in TBRmax, TBRmean, Tvol 1.6, TTP, SoD, and the slope of the regression line (SUV/min) at the second (FET-2) and third (FET-3) diagnostic imaging after completion of RCX were determined in relation to baseline imaging (FET-1). To analyze the prognostic value of changes in TBRmax, TBRmean, and metabolically active tumor volumes (Tvol 1.6) in serial 18F-FET PET and MRI on OS and PFS, patients were subdivided into responders and nonresponders in 18F-FET PET according to changes in the different imaging parameters. For TBRmax, TBRmean, and Tvol 1.6, we used an approximation process using different cutpoints of the various parameters to determine the value best separating the patients into two prognostic groups as described previously. 10 To analyze the prognostic value of changes in TTP, SoD, and slope of the TAC, patients were subdivided into two groups with either increasing or decreasing parameters after therapy. The diagnostic value of the various parameters for the prediction of treatment success was also tested using a receiver operating characteristic (ROC) analysis. Therefore, the patient population was divided into a partition with longer survival (PFS/OS > median) and with a shorter survival (PFS/OS < median). The ROC analysis was used to evaluate to what extent the individual parameters identified patients with shorter survival.
Furthermore, the prognostic value of TTP, SoD, and the slope of the regression line in the first PET study after surgery (FET-1) was analyzed. To analyze the prognostic value of TTP, patients were subdivided into two groups with either SUV of the tumor at FET-1 peaking early (TTP ≤ 20 minutes) or late (TTP 20–45 minutes). 12 For slope and SoD data, patients were subdivided into two groups with either positive or negative values before RCX. 14
Statistics
Survival analysis was performed using Kaplan-Meier estimates for PFS and OS (data presented as median values). The log-rank test was used for global comparison of PFS and OS curves between the subgroups. As general prognostic factors, RPA score, extent of resection, MGMT status, and Tvol 1.6 in FET-1 at a cutoff of 25 mL were considered.10,11,16 To evaluate the prognostic impact of treatment-related variations in PET, the changes in TBRmax, TBRmean, Tvol 1.6, TTP, SoD, and slope of the regression line in 18F-FET PET were tested. A p value of ≤ .05 was considered statistically significant. ROC curves were generated for the changes in TBRmax, TBRmean, Tvol 1.6, TTP, SoD, and slope of the TAC in 18F-FET PET, and the areas under the curves (AUC) were calculated. For a specific parameter, the cutoff level that resulted in the highest product of sensitivity and specificity was considered the optimal cutoff for prognostication. Statistical analysis was performed using SigmaStat software (SigmaPlot for Windows version 11.0, Systat Software Inc., Chicago, IL).
Results
Patient Data
The median follow-up was 14.8 months (range 3–53 months). The clinical data of the patients and the results of TBRmax, TBRmean, TTP, SoD, and slope in 18F-FET PET are presented in Table 1. The influence of general prognostic factors (ie, RPA score, extent of tumor resection, MGMT status, and radiation technique) in the present cohort has been reported previously.10,11 Well-established prognostic factors such as the RPA score and extent of tumor resection showed a trend toward significance on PFS and OS, respectively. For the MGMT status and postoperative 18F-FET tumor volume, a significant influence on PFS and OS could be observed. 10 Radiation technique (three-dimensional conformal radiotherapy vs intensity-modulated radiation therapy) and prescribed radiation dose had no significant influence on prognosis. 10
Survival according to Changes in the TBRmax and TBRmean of 18F-FET Uptake
On the basis of the extended follow-up period, the key results of the previous evaluation of this prospective study were confirmed. Thus, patients with a decrease in the TBRmax between FET-1 and FET-2 (cutoff −10%) had a significantly longer median PFS (9.3 vs 4.7 months; p = .002) and OS (18.0 vs 8.5 months; p < .01) than patients with an increase in TBRmax. The results for TBRmean (cutoff −5%) were similar: median PFS (10.3 vs 5.1 months) and OS (22.8 vs 9.3 months) (p < .001 for both PFS and OS). The prognostic value of changes in the tumor volume on 18F-FET PET as reported in our previous evaluation, however, could not be confirmed using the extended follow-up period.
Survival according to Changes in the Kinetic Parameters of 18F-FET Uptake
The evaluation of the TAC of 18F-FET PET in the patient group yielded a significant correlation between the different kinetic parameters in FET-1 (correlation between slope in FET-1 and TTP, r = .81, p < .0001; correlation between slope in FET-1 and SoD, r = .92, p < .0001; correlation between SoD in FET-1 and TTP, r = .75, p < .0001). This confirmed our expectation that the different parameters describe basically the same property of the 18F-FET uptake curve in the tumor, namely the behavior of 18F-FET in the late phase after injection (10–50 minutes).
In contrast, univariate survival analyses of PFS and OS in relation to the changes in TTP, SoD, or slope of 18F-FET uptake after RCX showed no relationship with survival time (Table 2). Furthermore, in no case did the changes in the different dynamic parameters show significant differences in ROC analysis in patients with longer survival (PFS/OS > median) and with a shorter survival (PFS/OS < median). Furthermore, there was no prognostic value of the kinetic parameters at the first PET study after surgery (FET-1) (data not shown).
Prognostic Impact of Changes in Kinetic Parameters of 18F-FET Uptake

18F-FET = O-(2-[18F]fluoroethyl)-L-tyrosine; FET-1 = first 18F-FET scan; FET-2 = second 18F-FET scan; FET-3 = third 18F-FET scan; OS = overall survival; PFS = progression-free survival; TAC = time-activity curve.
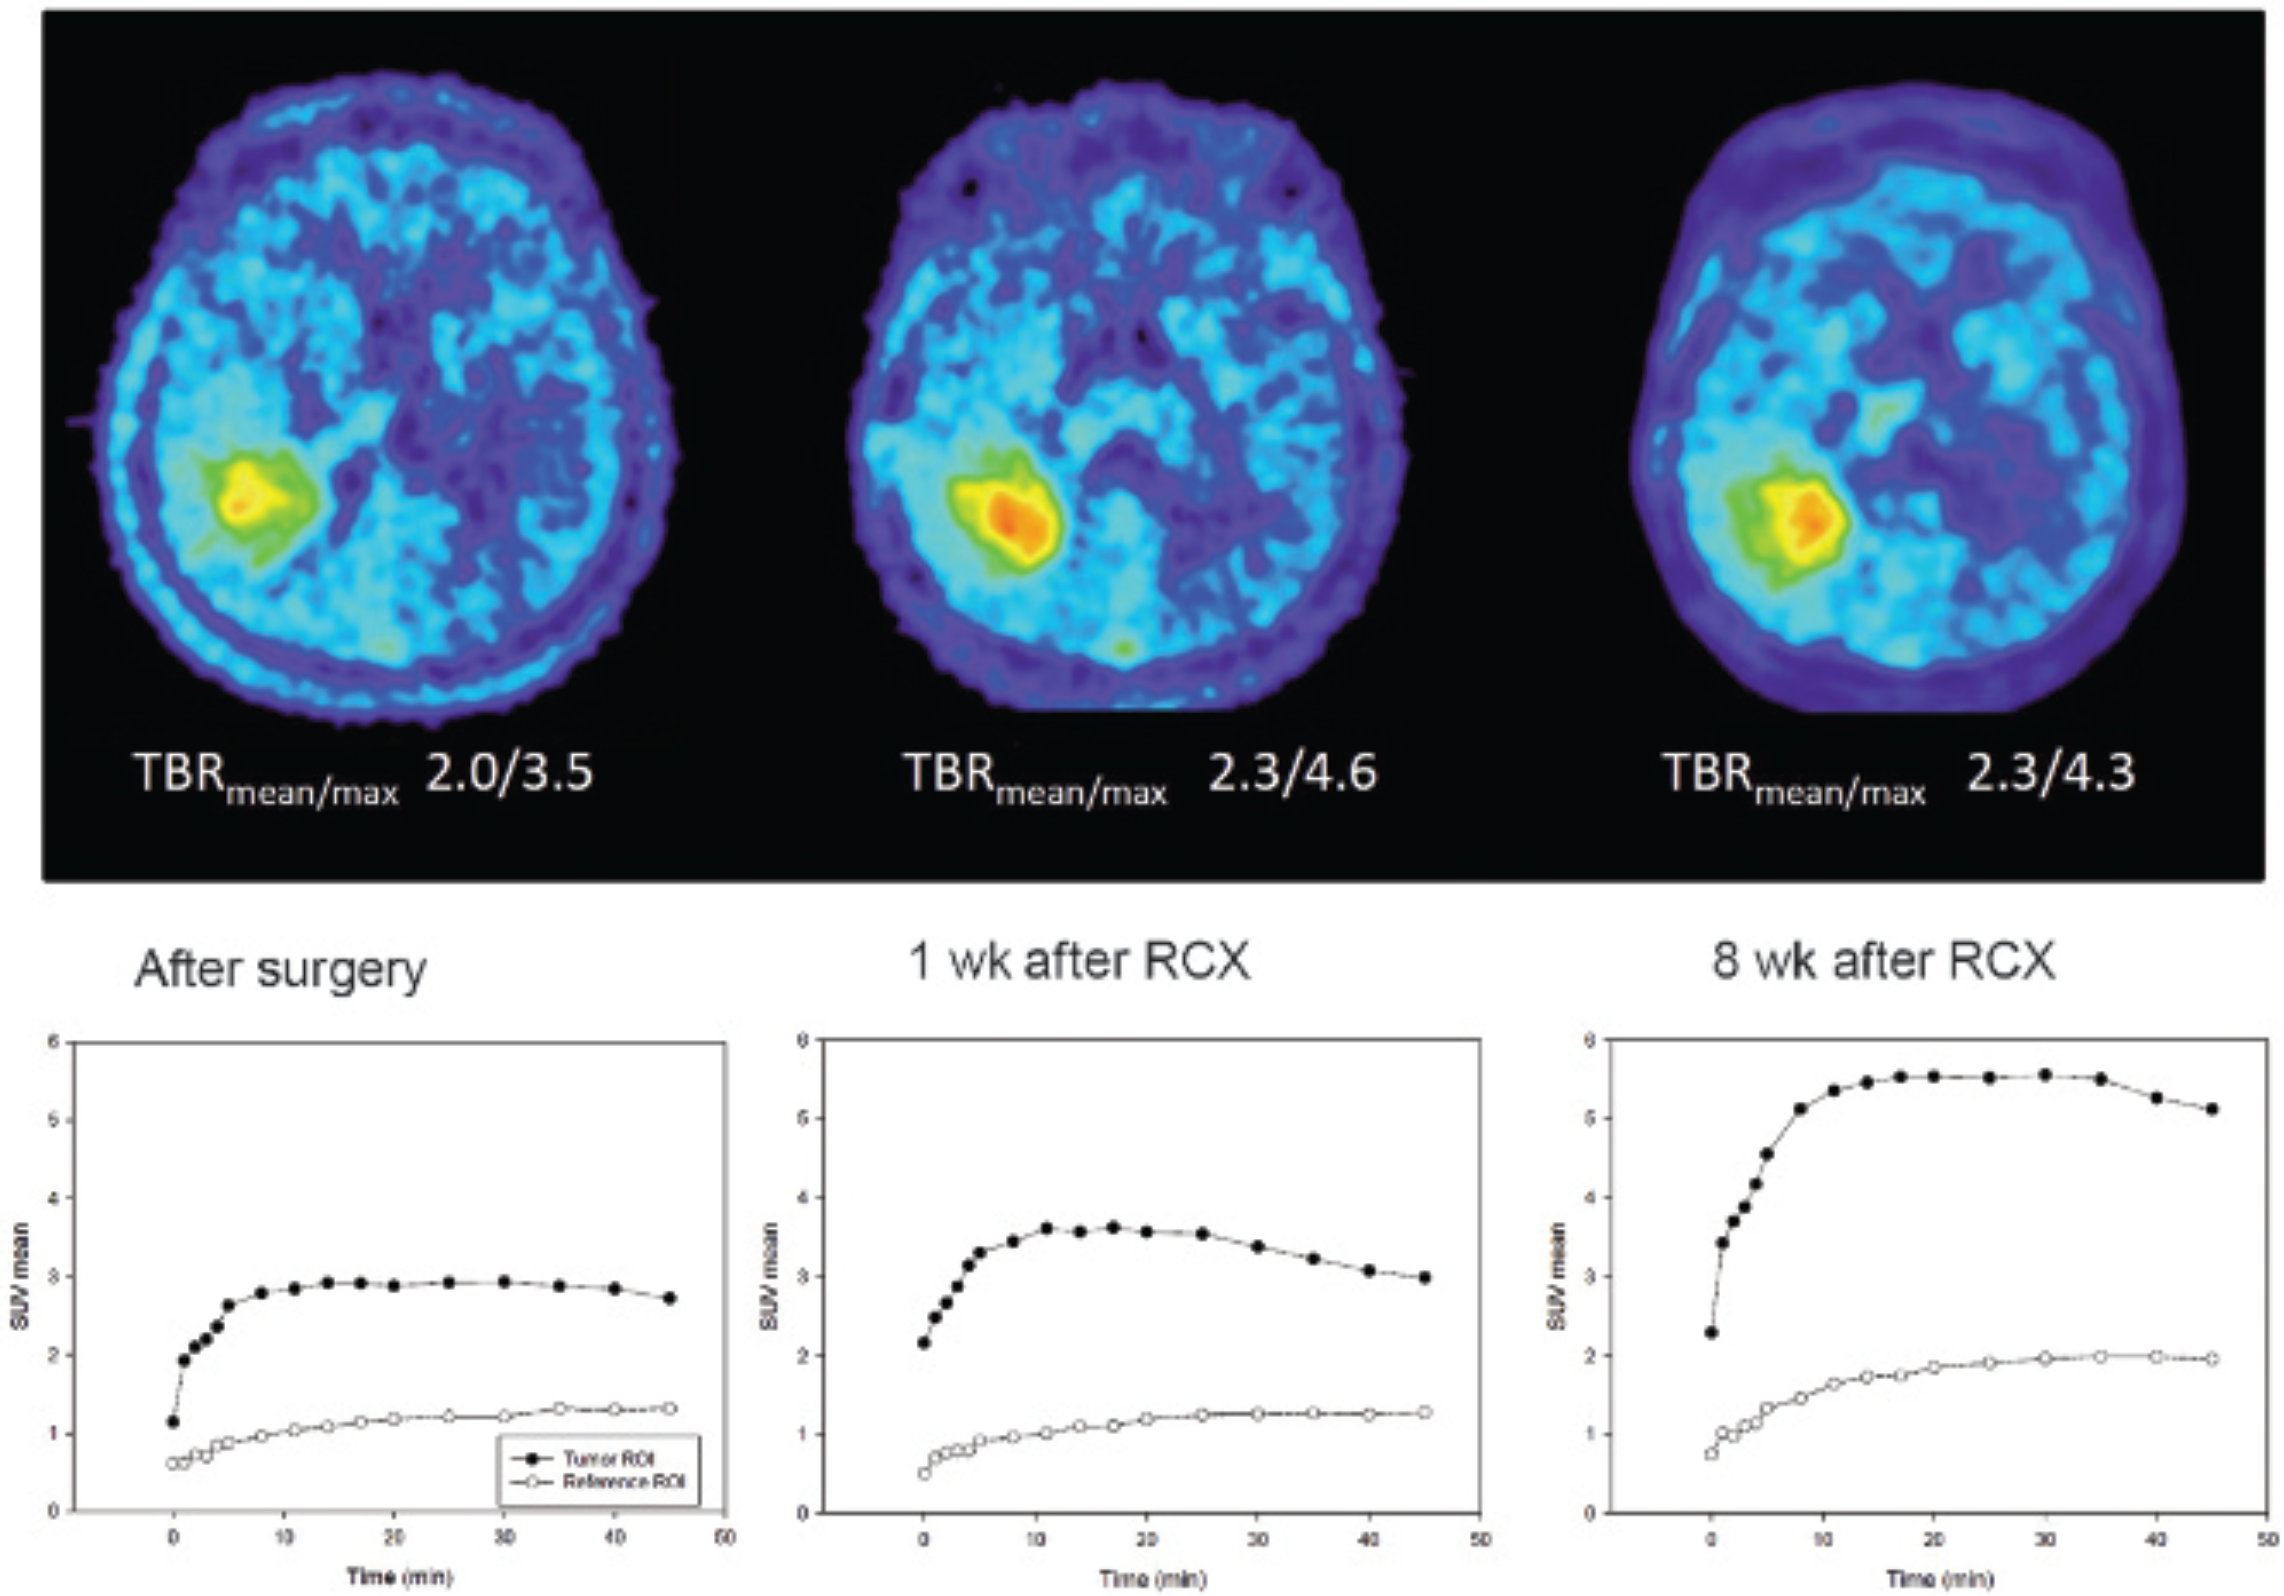
Typical examples of 18F-FET scans and TACs of a patient with a decrease in TBRmean 18F-FET uptake and favorable outcome and of a patient with an increase in TBRmean 18F-FET uptake and poor outcome are shown in Figure 1 and Figure 2. In both patients, no remarkable changes in the pattern of the TAC of 18F-FET uptake were observed. The Kaplan-Meier plots of OS according to the changes in TBRmean of 18F-FET uptake and changes in slope at FET-2 versus FET-1 are shown in Figure 3.

Example of a patient with a favorable outcome (patient 7; progression-free survival 19 months; overall survival 39 months). 18F-FET uptake (TBRmean/max) decreases after radiochemotherapy (RCX), whereas there is no major change in the shape of the uptake curve.
Example of a patient with a poor outcome (patient 3; progression-free survival 5.1 months; overall survival 5.6 months). 18F-FET uptake (TBRmean/max) increases after radiochemotherapy (RCX), wherease there is no major change in the shape of the uptake curve.

Kaplan-Meier plots of overall survival (OS) of patients with glioblastoma according to changes in TBRmean in 18F-FET PET early after completion of radiochemotherapy (FET-2 vs FET-1) (left) and changes in the slope of the time-activity curve at 10 to 50 min postinjection (right). OS is associated with changes in the TBRmean but not with changes in the slope. Censored observations are marked with dots.
Discussion
The results of this study suggest that evaluation of the TAC of 18F-FET uptake is of limited value for the assessment of treatment response during standard RCX of patients with glioblastoma. In our study, there is no evidence that the pattern of the TAC changes significantly during therapy. Furthermore, analyses of the absolute values of the different kinetic parameters in the residual tumor before RCX showed no relationship to the survival time of the patients, which is in line with the results of a previous study in a smaller group of patients with glioblastoma. 20 In contrast, the high prognostic value of changes in the TBRmean and TBRmax 1 week after completion of RCX was confirmed in this reevaluation with a much longer follow-up period.
The pathophysiologic background for these observations remains unclear. It is tempting to speculate that the ratio of amino acid transporters in the residual tumor mass, which regulate the influx into the tumor cells or the efflux from the tumor cells, is not significantly altered by RCX up to 2 months after completion of the treatment. In contrast, changes in the TBR may reflect either the number of viable tumor cells or the metabolic activity of the tumor cells and appear to more sensitive to predict the response to RCX at an early stage after completion of treatment. Similarly, the change in the TBR appears to be a more robust parameter to predict outcome at an early stage than the change in the tumor volume, which is obviously a more delayed effect. Although this parameter was predictive for PFS in our previous evaluation, this could not be confirmed in the actual study. Changes in the statistical results may occur after a longer observation time, especially in studies with a limited sample size.
The observation that dynamic 18F-FET PET is of limited value for treatment monitoring of RCX during standard treatment of patients with glioblastoma is relevant for the clinical use of 18F-FET PET. Dynamic 18F-FET imaging requires longer acquisition times (50 minutes vs 20 minutes), which reduces the number of patients who can be investigated with one synthesis or delivery of 18F-FET. This increases the costs of the investigation in routine clinical practice. Furthermore, the shorter acquisition time is more comfortable for patients and reduces motion artifacts.
It must be considered, however, that the results of this additional evaluation may be representative only for RCX during standard treatment of patients with glioblastoma. A recent study indicated that the kinetic pattern of 18F-FET PET uptake in patients with recurrent high-grade glioma before initiation of treatment with bevacizumab may be a valuable parameter to predict outcome. 21 Furthermore, the patient number in this prospective study is small, and the results need to be confirmed in a larger series of patients.
Conclusion
Dynamic 18F-FET PET appears to provide no additional prognostic information on RCX during standard treatment of patients with glioblastoma. Static 18F-FET PET imaging (20–40 minutes postinjection) may be sufficient for this purpose. The shorter acquisition time can help reduce the costs of the investigation in routine clinical practice and increase the comfort of the patient.
Footnotes
Acknowledgments
We wish to thank Suzanne Schaden, Elisabeth Theelen, and Kornelia Frey for assistance in the patient studies as well as Johannes Ermert, Silke Grafmüller, Erika Wabbals, and Sascha Rehbein for radiosynthesis of 18F-FET.
Financial disclosure of authors and reviewers: None reported.