
Abstract
Differentiating high-grade gliomas from solitary brain metastases is often difficult by conventional magnetic resonance imaging (MRI); molecular imaging may facilitate such discrimination. We tested the accuracy of α[11C]methyl-L-tryptophan (AMT)–positron emission tomography (PET) to differentiate newly diagnosed glioblastomas from brain metastases. AMT-PET was performed in 36 adults with suspected brain malignancy. Tumoral AMT accumulation was measured by standardized uptake values (SUVs). Tracer kinetic analysis was also performed to separate tumoral net tryptophan transport (by AMT volume of distribution [VD]) from unidirectional uptake rates using dynamic PET and blood input function. Differentiating the accuracy of these PET variables was evaluated and compared to conventional MRI. For glioblastoma/metastasis differentiation, tumoral AMT SUV showed the highest accuracy (74%) and the tumor/cortex VD ratio had the highest positive predictive value (82%). The combined accuracy of MRI (size of contrast-enhancing lesion) and AMT-PET reached up to 93%. For ring-enhancing lesions, tumor/cortex SUV ratios were higher in glioblastomas than in metastatic tumors and could differentiate these two tumor types with > 90% accuracy. These results demonstrate that evaluation of tryptophan accumulation by PET can enhance pretreatment differentiation of glioblastomas and metastatic brain tumors. This approach may be particularly useful in patients with a newly diagnosed solitary ring-enhancing mass.
IN ADULTS, metastatic tumors (eg, from primary lung cancer, breast cancer, and malignant melanoma) and glioblastoma multiforme (GBM) are the most common malignancies in the brain.1,2 Despite the poor outcomes of both primary and metastatic brain tumors,1,3 their distinction is important because of their substantially different clinical management. Although the standard treatment of GBM involves intracranial microsurgery with adjuvant radiation with concomitant chemotherapy,4,5 metastatic brain disease is commonly treated with upfront stereotactic radiosurgery and/or whole-brain radiation. 1 Conventional magnetic resonance imaging (MRI) is highly sensitive for detection of these tumors, but the specificity of the MRI findings remains limited. All of these tumors can show enhancement on T1-weighted images with gadolinium (T1-Gad) and hyperintensity on T2 and fluid-attenuated inversion recovery (FLAIR) images.6,7 The limited specificity of MRI for the differentiation of GBMs from brain metastases poses a particularly difficult clinical dilemma when a single brain lesion, suspicious for a high-grade neoplasm, is found in a patient without a history of a known primary tumor. 6 There are general characteristic imaging patterns of brain metastases, such as the invasion of the cortical gray-white matter junction and the presence of multiple nodular enhancing lesions,6,8 whereas GBM most commonly presents as a larger solitary ring-enhancing lesion within the deep white matter. However, differentiation of metastases from high-grade gliomas can be problematic if the primary tumor is unknown, which occurs in up to 15% of patients with suspected brain metastasis. 1 Additionally, large solitary metastases within the deep brain with ring enhancement are not uncommon.
Positron emission tomography (PET) may offer useful complementary information in diagnosis and differentiation of some malignant brain tumors because PET provides signals based on tissue metabolic activity, which may differ among various tumor grades and types. Clinical PET with 2-deoxy-2[18F]fluoro-D-glucose (FDG) is often used to differentiate low-grade from high-grade brain tumors 9 but provides limited accuracy in differentiating among the various high-grade tumor types, which show high glucose uptake. 10 Amino acid PET tracers have been shown to be useful in glioma treatment planning and follow-up.11–13 A limited amount of data is also available on uses of such tracers in metastatic brain disease.14,15 However, we are not aware of any PET studies successfully attempting to differentiate glial and metastatic brain tumors.
In the present study, we used α[11C]-methyl-L-tryptophan (AMT)-PET to study primary and metastatic brain tumors. AMT is an amino acid PET tracer not incorporated into proteins16,17; instead, tryptophan (and also AMT) is transported in brain tumor tissue via the large neutral amino acid transporter (LAT1)18–20 and can be metabolized via the immunomodulatory kynurenine pathway, which plays a key role in tumoral escape from the host immune response.21–27 Recent studies also suggest that this pathway plays a prominent role in brain tumor pathogenesis. 28 In our previous studies, we have shown that AMT tracer uptake is increased in most low-grade gliomas and in all high-grade gliomas, and kinetic analysis of AMT transport and metabolism on dynamic PET images was able to differentiate among various glioma types and predict proliferative activity.23,29–31 AMT tracer kinetic analysis can also facilitate accurate differentiation between glioma recurrence and radiation injury after initial treatment. 32 In addition, we have found differential AMT kinetics on PET imaging in primary lung and breast cancers (two common cancer types that often metastasize to the brain), likely owing to their differences in tumoral blood flow, tryptophan transporter activity, and mode of intratumoral tryptophan metabolism (eg, via the kynurenine and/or serotonin pathways), as well as other, yet to be clarified mechanisms.19,33 Therefore, in the present study, we hypothesized that quantitative analysis of AMT uptake and kinetics may be able to differentiate GBMs from common metastatic brain tumors and, thus, supplement conventional diagnostic neuroimaging. Such differentiation may be of significant clinical value in selected patients to guide further diagnostic and therapeutic steps.
Methods
Subjects
We studied 43 brain tumors in 36 adults (Table 1) based on the following inclusion criteria: (1) at least one lesion suggesting a brain tumor on MRI; (2) for GBMs, no previous treatment; for metastases, no previous treatment targeting the current (new) metastatic brain lesion and its vicinity and/or no whole-brain radiation performed in at least 12 months prior to the PET imaging; and (3) subsequent craniotomy with microsurgical resection and the histopathologic diagnosis of GBM or metastasis or histopathologic evidence from the site of the primary extracranial tumor (patients 20, 27, and 36). The mean time interval between the AMT-PET and MRI was 5 days (range 0–13 days) for the metastasis group and 4 days (range 0–17 days) for the GBM group. The study was approved by the Institutional Review Board of Wayne State University, and written informed consent was obtained from all participants.
Clinical and Imaging Data of the 36 Patients (total of 43 tumors)

C = cerebellar; F = frontal; MRI = magnetic resonance imaging; O = occipital; P = parietal; SUV = standardized uptake value; T = temporal; VD = volume of distribution.
AMT-PET Scanning Protocol
PET studies were performed using a Siemens EXACT/HR whole-body positron emission tomograph (Siemens Medical Systems, Knoxville, TN). The PET image in-plane resolution was 7.5 ± 0.4 mm at full-width half-maximum (FWHM) and 7.0 ± 0.5 mm FWHM in the axial direction. The AMT tracer was synthesized by using a high-yield procedure as outlined previously. 34 The procedure for AMT-PET scanning has been described previously.29,32 In brief, after 6 hours of fasting, a slow bolus of AMT (37 MBq/kg) was injected over 2 minutes via a venous line. A second venous line was established for collection of timed blood samples (0.5 mL/sample, collected at 20, 30, 40, 50, and 60minutes after AMT injection). Initially, coinciding with tracer injection, a 20-minute dynamic PET scan of the heart was performed to obtain the blood input function from the left cardiac ventricle. The blood input function was continued beyond this initial 20 minutes by using venous blood samples as described previously. 35 At 25 minutes after tracer injection, a dynamic emission scan of the brain (7 × 5 minutes) was acquired. Measured attenuation correction, scatter, and decay correction were applied to all PET images. For visualization of AMT uptake, averaged activity images 30 to 55 minutes postinjection were created and converted to an AMT standardized uptake value (SUV) image. For quantification of the AMT net transport and metabolism, Patlak graphical analysis36,37 was performed, which yielded AMT volume of distribution (VD) and AMT K values, as described previously.29,32 VD is an estimate of the volume of distribution of the tracer in the free precursor pool. We have previously shown that tumoral VD is increased when the blood-brain barrier is compromised, 29 and tumoral VD was also a good estimate of tumor proliferative activity in newly diagnosed gliomas. 31 The AMT K value reflects the unidirectional uptake of tracer into tissue,21,38 which is thought to be proportional to the metabolism of tryptophan via the serotonin (in normal brain) and/or the kynurenine pathway. 22
MRI Protocol
Pretreatment diagnostic MRI scans acquired nearest in time to the AMT-PET scan were used in this study. MRI was performed on either a Siemens MAGNETOM Trio TIM 3.0 Tesla scanner (Siemens Medical Solutions, Malvern, PA), a GE Signa HDxt 3.0 Tesla scanner (GE Medical Systems, Milwaukee, WI), or a Philips Achieva TX 3.0 Tesla scanner (Philips Medical Systems Inc., Da Best, the Netherlands). Postcontrast T1-weighted (T1-Gad) images used in this study were acquired using similar parameters on all scanners. The pattern of gadolinium enhancement was categorized as (1) ring enhancement; (2) nodular enhancement; (3) other pattern of enhancement if it did not fit into either of the above categories; or (4) no enhancement.
Image Analysis
The 3D Slicer software version 3.6.3 (http://www.slicer.org) was used for threshold-based region of interest (ROI) analysis. 39 First, a transformation matrix was created by coregistration of the summed AMT-PET images to the T1-Gad image volumes using the Fast Rigid Registration module. 40 This transformation matrix was then applied to the summed AMT-PET image and to the dynamic AMT-PET images loaded via the 4D Image module of 3D Slicer. Following fusion of the summed AMT-PET with T1-Gad images, all lesions showing a clear increase in AMT uptake in locations corresponding to abnormal gadolinium enhancement were identified visually. The largest enhancing diameter on T1-Gad was measured. Lesions smaller than 3.5 mm on MRI (present in patient 33 with multiple melanoma metastases) did not show increased AMT uptake and were not analyzed further. Lesions larger than 7 mm (ie, a size consistent with the FWHM for AMT-PET scans) in the largest diameter were quantitatively analyzed using 3D Slicer's edit module in the following manner: tumoral ROIs were drawn on the AMT-PET/MRI fusion image (axial planes) on regions showing abnormal gadolinium enhancement and/or abnormal AMT increase and on the contralateral homotopic cortical region. If AMT increase extended beyond a T1-Gad-positive lesion, the entire region showing increased AMT uptake was included in the ROI. If multiple tumors were present, the contralateral reference cortical region for the largest lesion was used as the reference region for the smaller cerebral lesions as well, whereas cerebellar lesions had a reference region obtained from the homotopic cortex of the contralateral cerebellar hemisphere. T1-Gad negative lesions were identified on AMT-PET images by having an SUV higher than the reference cortical region and were further confirmed by newly developed abnormalities in these locations on subsequent follow-up MRI. Subsequently, the mean AMT SUV and kinetic parameters were quantified from each ROI, and tumoral SUV, K, and VD values, as well as SUV, K, and VD tumor/cortex ratios, were calculated for each lesion as the average of up to three ROI (depending on lesion size) with the highest mean SUV.
Study Design and Statistical Analysis
Most variables showed a nonnormal distribution; therefore, nonparametric tests were used. The Mann-Whitney U test was used for group comparison (GBMs vs metastases; GBMs vs carcinomas; GBMs vs lung metastases; GBMs vs breast metastases; lung vs breast metastases; ring-enhancing metastases vs ring-enhancing GBMs; ring-enhancing vs nodular-enhancing metastases). The following PET parameters of the lesions were compared: tumor SUV, K, and VD, as well as tumor/cortex SUV, K, and VD ratios. In case of a significant difference in any of these parameters between the tumor groups, receiver operating characteristic (ROC) analyses were performed to determine the optimal threshold for the distinction of tumor types. Accuracy and positive predictive values (PPVs) were calculated by using these thresholds. In the comparison of GBMs and metastases, concurrent diagnoses suggested by AMT-PET versus clinical diagnoses were classified as follows: true positive (TP) = AMT and clinical diagnosis of GBM; true negative (TN) = AMT and clinical diagnosis of metastasis; false positive (FP) = AMT diagnosis of GBM with clinical diagnosis of metastasis; false negative (FN) = AMT diagnosis of metastasis with clinical diagnosis of GBM; and PPV referring to the correct prediction of GBM. In the comparison of lung versus breast metastases, concurrent AMT and clinical diagnoses of lung metastasis were considered TP, and so on; in this comparison, PPV referred to the prediction of lung metastasis. Accuracy was calculated as TP/(TN + TP + FN + FP), whereas PPV was determined as TP/(TP + FP); both were indicated as percentages. Statistical analysis was carried out using SPSS Statistics 19 software (SPSS Inc., Somers, NY); p values < .05 were considered statistically significant.
Results
Imaging Characteristics of the Brain Tumors
On the scans of the 17 patients with metastases, 31 lesions were identified by T1-Gad and/or AMT-PET. Gadolinium enhancement was seen in 30 lesions, and increased AMT uptake was detected in 28 lesions by visual assessment; all 28 showed at least a 16% SUV increase, compared to contralateral normal cortical uptake (range 1.16–3.21). All metastatic lesions ≥ 7 mm on T1-Gad (n = 24) showed AMT accumulation. One patient (24) had one AMT-negative lesion, which was 4 mm in diameter on T1-Gad, and another patient (33) had multiple AMT-negative metastases measuring 2 to 3 mm in diameter on MRI. Thirteen metastatic lesions showed nodular enhancement, eight were ring enhancing, and two showed an enhancement pattern that did not fit into these two categories. The only nonenhancing metastatic lesion (a melanoma metastasis, patient 33d in Table 1) had high AMT SUV (tumor/cortex ratio 1.30), showed signal intensity very similar to that of the surrounding white matter on T1-Gad, and only minimally distorted the gyral pattern. Follow-up MRI of this lesion 4 weeks later showed growth, suggesting tumor presence, although it still presented no clear contrast enhancement.
All 19 GBMs showed gadolinium enhancement and increased AMT uptake, with an SUV tumor/cortex ratio range of 1.37 to 3.33. Fourteen GBMs were ring enhancing, and five showed nodular enhancement.
Comparison of Different Tumor Types
GBMs versus All Metastases
Compared to GBMs, metastases had lower tumoral SUVs (mean ± SD: 3.84 ± 1.47 vs 5.02 ± 1.44; p = .005), as well as a lower mean tumor/cortex SUV ratio (mean ± SD: 1.78 ± 0.57 vs 2.10 ± 0.46; p = .009) and tumor/cortex VD ratio (mean ± SD: 2.07 ± 0.67 vs 3.09 ± 1.45; p = .014) (Table 2). For the distinction of GBMs and metastatic tumors, a tumoral SUV of 4.1 had the highest differentiating accuracy (74%) and a VD tumor/cortex ratio of 2.8 had the highest PPV (82%; Table 3). Tumor diameter on T1-Gad MRI was greater in the GBM group compared to the metastases (40 ± 17 mm vs 25 ± 14 mm; p = .003). A diameter threshold of 28 mm separated the two tumor groups with 72% accuracy, but PPV was lower (67%) than PPV obtained by AMT-PET. In cases where there was consensus in tumor classification by AMT SUV and the diameter on T1-Gad (based on the above-described cutoff threshold values, n = 26), the combined accuracy has increased to 88% with a PPV of 75%. The accuracy of combined MRI + AMT-PET classification reached 93% after the addition of nonconsensus cases with a high VD ratio (> 3.5) classified as GBMs.
Comparisons of AMT Kinetic Parameters of Different Tumor Groups

AMT = α[11C]methyl-L-tryptophan; GBM = glioblastoma; NS = not significant; SUV = standardized uptake value; VD = volume of distribution.
p value of ring-enhancing GBM and ring-enhancing metastasis comparison.
Differentiation of Ring-Enhancing GBMs and Metastases
Ring-enhancing metastases showed a lower diameter on T1-Gad than ring-enhancing GBMs (27 ± 16 mm vs 43 ± 15 mm, respectively; p = .029). The tumor SUV and the tumor/cortex SUV, K, and VD ratios were all lower in the ring-enhancing metastases compared to GBMs (p values: .029, .001, .048, and .034, respectively; see Table 2). The SUV ratio of 1.65 reached the highest differentiating accuracy of 91%, with a PPV of 93% (see Table 3), falsely identifying only one metastasis as GBM (1 of 8) and one GBM as metastasis (1 of 14), whereas the diameter threshold of 27 mm produced a lower accuracy (82%) and PPV (81%).
Summary of Differentiating Accuracy and Positive Predictive Values of the Various Imaging Parameters

GBM = glioblastoma; NS = not significant; PPV = positive predictive value; SUV = standardized uptake value; VD = volume of distribution.
Highest accuracy and PPV values in each column are italicized.
GBMs versus Metastatic Carcinomas
After the exclusion of melanomas, the remaining metastatic carcinomas (n = 19) were compared to the GBMs. Tumoral SUV and K, VD, and SUV tumor/cortex ratios were all higher in GBMs (see Table 2). Tumoral SUV with a 4.1 threshold was the most accurate for the distinction of the two groups with an accuracy of 74% (PPV = 74%; see Table 3), and the highest PPV (90%) was provided by a VD tumor/cortex ratio of 2.8. The mean diameter was higher in the GBM group than in the carcinomatous metastases (40 ± 17 mm vs 25 ± 15 mm; p = .006). The diameter threshold of 28 mm separated the GBMs and carcinomas with 71% accuracy and 70% PPV.
GBMs versus Breast Metastases
Only VD tumor/cortex ratios differed between GBMs and breast metastases, with a higher mean value in GBMs (see Table 2). A VD ratio of 1.9 was able to distinguish the two groups with 84% accuracy and 94% PPV (see Table 3). Also, diameter difference was found on T1-Gad MRIs between GBMs and breast metastases (40 ± 17 mm vs 29 ± 17 mm; p = .026). The diameter threshold of 24 mm produced 77% accuracy and 84% PPV.
GBMs versus Lung Metastases
Lung metastases had significantly lower tumoral SUVs and K tumor/cortex ratios compared to GBMs (see Table 2). An SUV threshold of 4.1 distinguished the two groups, with an 81% accuracy and 100% PPV, and a 1.52 tumor/cortex K ratio also had high accuracy (78%) and PPV (88%; see Table 3). The mean tumor diameter on T1-Gad was higher in the GBM group than in the lung metastases (40 ± 17 mm vs 25 ± 15 mm; p = .026). A 28 mm diameter threshold separated the two groups with 74% accuracy and 88% PPV.
Breast versus Lung Metastases
The tumor/cortex VD ratios in the lung metastases were higher than in the breast metastases (2.35 ± 0.47 vs 1.78 ± 0.53, respectively; p = .039). A VD ratio threshold of 1.9 distinguished the two groups with 86% accuracy and 88% PPV. No diameter difference was found on T1-Gad between lung and breast metastases (37 ± 20 mm vs 25 ± 15 mm, respectively; p = .64).
Discussion
In this study, we found that tumoral AMT uptake can distinguish GBMs from metastatic tumors with a high degree of accuracy. SUVs are easy to obtain without blood input function, and tumor/cortex AMT SUV ratios appear to be very accurate (> 90%) in discriminating ring-enhancing GBMs from brain metastases, a difficult clinical dilemma when a single new ring-enhancing lesion is demonstrated on MRI (Figure 1). Tumoral SUV could also distinguish GBMs from lung metastases with a very high positive predictive value. Kinetic analysis of AMT uptake provided useful additional information, compared to contrast-enhanced MRI (T1-Gad diameter), for identifying GBMs based on their higher tumor/cortex AMT VD ratios. With the combination of a simple MRI parameter (size of contrast-enhancing lesion) and AMT-PET values, the differentiating accuracy reached up to 93%. These results suggest that AMT SUV and VD, measured by PET, can provide an improved discrimination of the most common malignant tumor types within the brain.
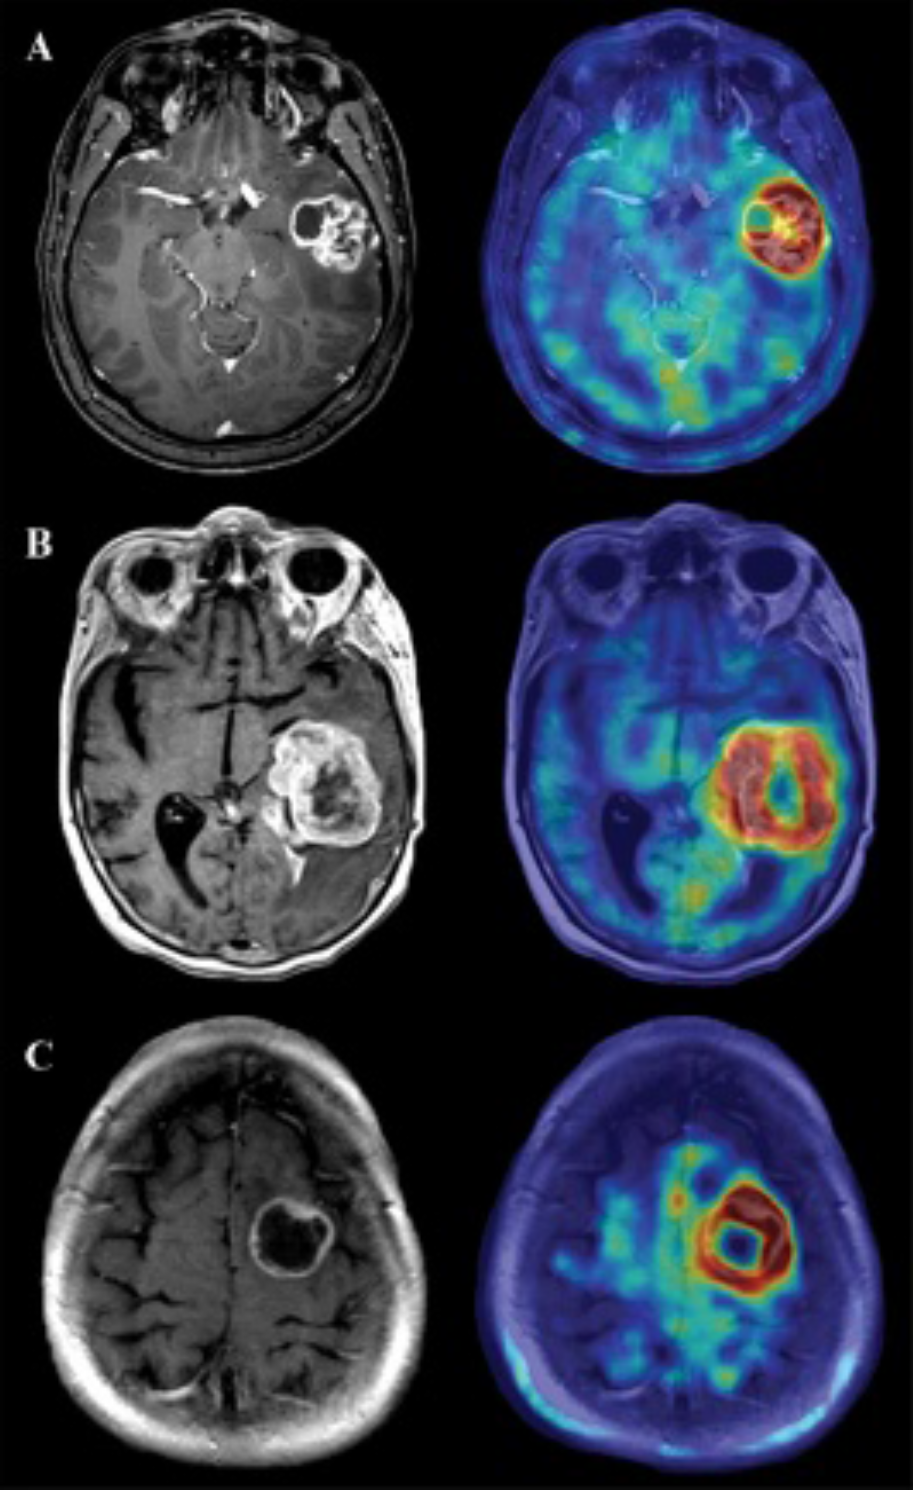
T1-Gad (left column) and AMT-T1-Gad fusion (right column) images of three ring-enhancing tumors: (A) glioblastoma multiforme (GBM) (patient 12); (B) lung metastasis (patient 28); (C) breast metastasis (tumor “a” of patient 23). Although the tumors looked similar on T1-Gad and AMT standardized uptake value (SUV) images, the GBM had the highest SUV tumor/cortex ratio (2.08), whereas the VD tumor/cortex ratio distinguished the lung (2.53) from the breast (1.89) metastasis.
Imaging Features to Differentiate Malignant Brain Tumor Types
There are a few features on conventional MRI that can help differentiate primary gliomas from metastatic brain tumors. For example, localization in the gray-white matter junction is generally associated with metastases. 8 In our study, this was not helpful in the distinction of tumor types because the majority of both GBMs and metastases penetrated the white matter and involved the cortex at the same time. Another typical feature of glial tumors is their larger diameter compared to metastases. 8 The maximum diameter of enhancement was indeed greater in GBMs than in metastases in our study; however, no significant difference was found among different types of metastatic lesions. In addition, abnormalities on advanced MRI, including magnetic resonance spectroscopy (MRS) and perfusion-weighted imaging (PWI), may be helpful to differentiate infiltrative gliomas from other solid brain tumor types, which have different metabolite and blood flow characteristics in peritumoral edema.7,41 However, high-grade glial neoplasms and metastases often demonstrate increased relative cerebral blood volume on PWI. MRS has limited brain coverage even when using a multivoxel technique and is often nondiagnostic if the area imaged contains blood products or is too close to cerebrospinal fluid spaces or bone. Lastly, both MRS and PWI have poor spatial resolution. Therefore, these techniques currently have limited use in treatment planning, although they can improve posttreatment differentiation of recurrent gliomas from radiation injury. 42 In contrast, PET scanning with various amino acid radiotracers is an excellent tool for detecting infiltrative tumor growth in high-grade glial tumors12,43–46 and can be directly used in stereotactic surgical and radiosurgical planning.11,13,47,48
Compared to MRI, PET is less available and requires more expensive instrumentation, and the availability of 11 C-labeled amino acid radiotracers is limited to specialized centers equipped with a cyclotron. FDG-PET is more widely used but has a limited accuracy in high-grade brain tumor imaging. 10 A thorough analysis of brain tumor cases from the National Oncologic PET Registry showed that dedicated FDG-PET scanning of the brain rarely changed the management; however, patients who underwent brain FDG-PET were biopsied much less often; thus, its economic efficacy might lie in FDG being a plausible surrogate for brain biopsy. 49 In the present study, we found that AMT-PET can accurately distinguish most common high-grade tumors that invade brain parenchyma. It is generally thought that brain metastases are recognized earlier because they cause neurologic symptoms at a smaller size due to their vicinity to the cortex, 8 and clinicians have a lower threshold of suspicion in patients whose primary tumor is already known. It is plausible that, in addition to the characteristic presence in the gray-white matter junction, the presence of nodular enhancement is an early morphologic feature of many metastatic tumors, and as tumoral development progresses (with angiogenesis at the tumor edge and central necrosis), the tumors adapt a ring-enhancing pattern, a morphology that converges toward the features of GBMs on conventional MRI. AMT-PET was found to have excellent accuracy for discrimination of tumors with such morphology; thus, it can be valuable in these challenging cases.
Differentiation of AMT Kinetics of Lung versus Breast Metastases and Potential Mechanism of AMT Uptake Differences
The present study provides preliminary evidence that quantification of AMT uptake may assist differentiation of lung metastases from metastatic breast cancer within the brain. In our previous studies, we investigated the AMT uptake kinetics in primary lung and breast cancers.19,33 Both of these cancer types, although heterogeneous themselves, showed substantial AMT tracer efflux out of the tumors at the primary tumor site, whereas metastases within the brain, similar to gliomas, had no significant tracer efflux. The majority of primary extracranial tumors studied until now had a peak tracer uptake within the first 25 minutes of the scan and showed decreasing uptake afterward. In contrast, gliomas and brain metastases typically showed prolonged, steadily increasing uptake beyond 30 minutes after tracer injection. Therefore, a different model was applied for the kinetic analyses of primary extracranial tumors than for brain tumors, and the absolute values obtained by these analyses are not directly comparable. However, one patient (22) included in the present study was also studied in the previous primary breast tumor study, along with histologic data from both the primary tumor and the brain metastasis. 19 Both the primary and the metastatic tumor of this patient had an exceptionally high tryptophan uptake. Aside from this, the AMT kinetics in brain metastasis from this patient was generally more similar to GBMs than to the primary tumors from other patients.
It is important to mention that whereas the background AMT uptake in the lung or breast tissue was negligible, the AMT uptake of normal brain tissue was substantial because tryptophan is used for serotonin synthesis.16,17,38 Also, the blood-brain and blood-tumor barriers provide a more protected microenvironment in the brain, although these barriers are often compromised in high-grade tumors. The differences in AMT tracer kinetics at the extracranial versus the cerebral tumor sites suggest that the AMT uptake characteristics are affected by the tissue matrix the tumor cells are embedded in and not determined solely by the tumor type. Nevertheless, the results of the present study provide novel evidence that tumoral accumulation of AMT, measured by PET imaging, can be a useful imaging tool to differentiate between GBMs and common brain metastases in selected patients where such a distinction cannot be made on clinical grounds or conventional imaging.
We also found the AMT VD and tumor cortex/ratios to be the most accurate kinetic parameters to differentiate between lung and brain metastases. The same parameter also provided the highest PPV to differentiate GBMs from metastatic tumors. Tissue (including tumor) VD is high when the majority of injected radioactive tracer moves from the blood to the tissue (ie, high influx) and/or when only a small amount moves back from the tissue (tumor) to the blood (ie, low efflux). Thus, AMT VD is an indirect measure of net tryptophan transport from the blood to the tumor tissue, and its tumor/cortex ratio was found to be highly correlated with glioma proliferative activity in our recent study. 31 Whether the observed VD differences among high-grade tumor types (GBM vs metastases; breast and lung cancer metastases) are related to tumor proliferation or other factors remains to be clarified in a larger series with histopathology comparisons. Also, we recently showed that patients with high-grade gliomas may have altered AMT kinetics in remote cortex, 31 which could affect tumor/cortex ratios. In the present study, cortical AMT parameters of the reference cortical regions did not differ between the GBMs and metastases; therefore, it is likely that the observed AMT differences were driven by different tumoral AMT kinetics rather than by cortical changes.
Differentiation from Nontumorous Lesions
Increased amino acid uptake is not confined to tumors but can occur in nontumorous lesions, most commonly associated with brain inflammation. Moderately increased methionine uptake on PET has been described in brain abscess, and a mild increase was also reported in active demyelinating lesions associated with multiple sclerosis.50–52 Similarly, in preliminary studies, we observed focal increases of AMT uptake in a few patients with multiple sclerosis. 53 The degree of these increases was mild/moderate, generally lower than increases seen in malignant brain tumors. Therefore, differentiation between high-grade brain tumors and demyelinating lesions may be possible by SUVs or differential tracer kinetics, but direct comparative studies are not yet available. Likewise, although increased AMT uptake can occur in nontumorous epileptic lesions (mostly seen in epileptogenic developmental brain malformations), AMT SUV lesion/cortex ratios in such regions rarely reach the high values observed in the present study. 54 Nevertheless, there is some overlap between the AMT uptake seen in malignant brain tumors and some nontumorous lesions, and a firm differentiation of such lesions should be based on the history, clinical presentation, and all imaging findings rather than PET imaging alone.
Limitations and Future Directions
Although the findings of this study are promising, further, prospective studies in larger patient populations using predefined analysis cutoff values are needed to confirm the differentiating accuracy of AMT-PET imaging. A larger study would allow multivariate analyses to test AMT-PET for its added clinical value compared to and in conjunction with MRI characteristics. It also remains to be determined if PET imaging with other amino acid radiotracers can provide similar or better accuracy for differentiating malignant gliomas from metastatic lesions as well as other, nontumorous lesions. Given that tumoral accumulation of several other amino acid PET tracers (eg, [18F]-labeled tyrosine, [11C]-methionine or [18F]-dopamine) is primarily driven by amino acid transport, quantification of tumoral uptake of these tracers could provide a similar distinction between GBMs and common metastatic brain tumors. The use of these PET tracers would increase the clinical impact of our observation because, currently, AMT has limited availability compared to some of the other amino acid PET tracers. This could change in the near future as recent advances in PET radiosynthesis, including the increasing availability and use of automated, modular PET radiosynthesis systems for routine synthesis of 11C-labeled compounds,55,56 may facilitate the more widespread application of such radiotracers in the clinical setting. Development of an [18F]-labeled AMT analogue may also be possible. Nevertheless, such advanced imaging techniques are not expected to gain widespread clinical application for primary diagnosis of such lesions. Rather, AMT-PET imaging may be useful in selected patients with specific diagnostic dilemmas that cannot be resolved with current routine clinical imaging. For example, accurate pretreatment differentiation of some newly diagnosed ring-enhancing brain lesions may affect subsequent diagnostic steps (such as urgent brain biopsy or resection versus search for a primary tumor). In addition, because AMT is metabolized via the immunosuppressive kynurenine pathway, which is often upregulated in various cancers, clinical application of AMT-PET (or an [18F]-labeled AMT analogue) may be useful as novel enzyme inhibitors of this pathway enter clinical trials.28,57 Such drug trials can benefit from molecular imaging of tryptophan uptake and metabolism for patient screening and monitoring treatment effects.
Footnotes
Acknowledgments
We thank Pulak Chakraborty, PhD, Hancheng Cai, PhD, and Thomas Mangner, PhD, for assistance in radiochemistry. We thank Janet Barger, RN, Kelly Forcucci, RN, and Cathie Germain, MA, for assisting patient recruitment and scheduling. We are grateful to the entire staff at the PET Center, Children's Hospital of Michigan, who provided invaluable technical help in performing the PET scans.
Financial disclosure of authors: The study was supported by a grant (R01 CA123451 to C.J.) from the National Cancer Institute, Start-up Funds from Wayne State University School of Medicine (to S.M.), and a Strategic Research Initiative Grant from the Karmanos Cancer Institute (to S.M. and C.J.).
Financial disclosure of reviewers: None reported.