
Abstract
Brain anatomy variability is a major problem in quantifying functional images in nuclear medicine, in particular relative to aging and neurodegenerative diseases. The aim of this study was to compare affine and elastic model–based methods for magnetic resonance imaging (MRI) to brain atlas registration and to assess their impact on the quantification of cholinergic neurotransmission. Patients with multiple system atrophy (MSA) and age-matched healthy subjects underwent an MRI and a single-photon emission computed tomographic (SPECT) examination using [123I]-iodobenzovesamicol (IBVM). Both affine and elastic methods were compared to register the subjects' MRI with the Montreal Neurological Institute brain atlas. Performance of the registration accuracy was quantitatively assessed and the impact on the IBVM quantification was studied. For both subject groups, elastic registration achieved better quantitative performance compared to the affine model. For patients suffering from neurogenerative disease, this study demonstrates the importance and relevance of MRI to atlas registration in quantification of neuronal integrity. In this context, in comparison with rigid registrations, an elastic model–based registration provides the best relocation of the brain structures to the atlas for accurately quantifying cholinergic neurotransmission.
PREVIOUS STUDIES support a role for acetylcholine neurotransmission impairment in various age-related neurodegenerative diseases. [123I]-radiolabeled iodobenzovesamicol ([123I]-IBVM) is a highly selective radioligand used for the visualization of vesicular acetylcholine transporter (VAChT) using single-photon emission computed tomography (SPECT). Similar to choline acetyltransferase, VAChT is a presynaptic marker of both cholinergic soma and terminals, 1 so [123I]-IBVM allows for the quantification of in vivo cholinergic innervation in humans. It has been used in vivo in several neurodegenerative disorders in which cholinergic deficits have been identified postmortem, such as Alzheimer disease (AD),2–4 multiple system atrophy (MSA),5,6 or Parkinson disease. 3
To quantify the [123I]-IBVM uptake signal in SPECT nuclear medicine images, modeling-based analyses have been proven to be preferable methods,2,7 especially when quantification of cholinergic neurons with [123I]-IBVM is performed through the calculation of pharmacokinetic target tissue parameters, such as nondisplaceable binding potential (BPnd), in different regions of the brain. The choice of the brain template in a group analysis study is crucial as it may affect localization of the functional regions and, consequently, the statistics of tracer uptake used for pharmacokinetic modeling. 8 Although one anatomic image of a subject in a given group can be used as a brain template, the image derived as the average of group brain images appears to be preferable. 9 As the fully automatic segmentation of anatomic regions in human brain images remains an unsolved challenge, delineation of the anatomic structures on the chosen brain template is performed using a manual or semiautomatic segmentation algorithm with the disadvantage of intra- and interoperator variability. To overcome these limitations, the Montreal Neurological Institute (MNI)-152 brain template, derived from T1 magnetic resonance images (MRIs) of a group of 305 young (age 23.4 ± 4.1 years) and healthy volunteers, 10 may be used. After registration of each subject's MRI with the MNI brain atlas, the MNI predefined set of regions of interest (ROI) can subsequently be applied to the subject's SPECT dynamic image and therefore allow for the computation of quantitative measures of radiotracer uptake for each brain region.
The variability in brain anatomy between different subjects is a major problem in analyzing a group of functional images (positron emission tomography or SPECT) and is arguably the most important challenge in functional localization.11,12 In the specific case of neurodegenerative studies, the MRI to brain atlas registration becomes even more challenging due to global or localized brain atrophy observed on both magnetic resonance and SPECT images. Moreover, for elderly subjects, the age difference may also induce a large discrepancy between elderly healthy subjects and patients, and the MNI atlas can therefore be observed at the level of the three brain compartments: gray matter, white matter, and cerebrospinal fluid (CSF). We must consider that there are different sources of cholinergic neurons in the brain, and among these are basal forebrain neurons from the nucleus basalis of Meynert, which provide the major source of cortical cholinergic function, 13 shown to be reduced in vivo in neurodegenerative diseases such as AD 14 and MSA. 15 Due to cholinergic terminal dispersion in the cerebral cortex, quantification of the weak signal observed requires adapted image analysis methods. Although a nonlinear deformable registration to map the subject's anatomy to the brain atlas is commonly used,16,17 no work has yet evaluated the importance of the subject's image to brain atlas registration method in the specific context of a group of subjects affected by extensive atrophy.
In elderly healthy subjects and patients with MSA, the aim of this study was to compare an affine and an elastic model–based method to perform MRI to MNI registration. The affine model is a global model with 12 degrees of freedom generally used to accurately realign images of the same subject's brain, but when registering two brain images of different subjects, this model reaches its limitations and is not able to account for local misalignments of brain structures. In this context, an elastic model is considered for its ability to potentially overcome the limitations of the affine model. The elastic model's continuous representation of the images through the use of B-spline basis functions is able to account for local deformations and better realign the participant's images to the MNI atlas. The performance of the registration accuracy for the two studied models was assessed both qualitatively and quantitatively. In addition, we examined how the choice of affine or elastic model–based registration impacts [123I]-IBVM quantification, both in healthy subjects and in the MSA group. We compared, in each group, with both affine and elastic models, BPnd values in brain ROI potentially most affected by atrophy. Moreover, manual segmentation of the brain structures, considered the gold standard methodology, was also performed. The BPnd values derived using this manual approach were then compared to those of the two registration models.
Materials and Methods
Study Population
A group of 10 elderly healthy volunteers (mean age 66.50 ± 3.92 years; 3 men, 7 women) with no neuropsychiatric disorders and a group of 9 patients with MSA (mean age 63 ± 5.24 years; 8 men, 1 woman) were recruited at the French Reference Centre for MSA.
Diagnosis of MSA was made by a senior neurologist (Wassilios Meissner) according to consensus criteria. 18 The study was initiated after protocol approval by the Human Ethics Committee of the University Hospital of Bordeaux and radioactive drug approval by the French Health Product Safety Agency. All patients provided written informed consent.
Scanning Protocol
Anatomic MRI
Each subject underwent high-resolution three-dimensional T1-weighted anatomic MRI used for further registration and partial volume effect correction of the SPECT data. All the MRI data were collected on a 1.5 T Gyroscan ACS NT Power track 6000 (Philips Medical System, Best, the Netherlands) using the following parameters: three-dimensional T1 turbo field echo sequence, repetition time/echo time = 7.1/3.5 ms, flip angle = 8, matrix = 256 × 256 × 228, voxel size = 1 mm3.
SPECT/Computed Tomography
SPECT imaging was performed on a SPECT/computed tomography (CT) SYMBIA T2 camera (Siemens, Erlanger, Germany) equipped with low–energy, high-resolution collimators. To minimize iodine uptake in the thyroid gland, each subject was administered 400 mg of potassium perchlorate orally 30 minutes before data acquisition and up to 24 hours after. After a mean intravenous injection of 252.87 ± 35.22 MBq of [123I]-IBVM, a dynamic sequence comprising 13 frames (64 projections with a matrix of 64 × 64 over 360°) was acquired at five different times over a period of 8 hours: 5 × 6 minutes at 0 hours after injection, 2 × 15 minutes at 1 hour after injection, 2 × 15 minutes at 2.5 hours after injection, 2 × 15 minutes at 4.5 hours, and 2 × 15 minutes at 7 hours after injection. Between the five acquisitions, the subjects were allowed out of the gantry to rest. CT image acquisition was performed before each of the five SPECT image acquisitions.
SPECT images were reconstructed on a 64 × 64 matrix using a flash three-dimensional iterative reconstruction (four iterations, eight subsets) and a voxel size of 6.8 × 6.8 × 6.8 mm3. Attenuation correction was performed using the CT image. All the reconstructed images were transferred to software developed in house designed for processing, including decay correction, normalization for frame duration, and frame merging. All the frames were rigidly registered together and with the CT image to ensure the same position of the subject brain in all images over time. A dynamic SPECT data set was obtained in this way.
Atrophy Correction of the Dynamic SPECT Data
To account for the atrophy in the four-dimensional SPECT data set registered to the MNI template, extra-cerebral tissue (ie, CSF plus cranium) was eliminated on MRI of each subject using an automatic method in SPM5 software (Welcome Department of Imaging Neuroscience, London, England) according to the Giovacchini two-segment MRI-based segmentation method. 19 The yielded two-segment (brain tissue and CSF) MRI-based mask—shown to be sufficient in studies of neurodegenerative diseases 20 —was applied voxel by voxel to the four-dimensional SPECT image, 19 resulting in unchanged voxels in the MRI-derived white and gray matter and voxels set to 0 in the CSF and cranium regions.
Registration of the Acquired Data to the MNI Template
Comparison of Two Registration Algorithms Based on an Affine and an Elastic Model
The affine model–based registration included in the Fusion tool of PMOD software (PMOD Technologies, Zurich, Switzerland) was used to perform the affine model–based registration (three translations, three rotations, three dilations, and three shears). Through the use of a multiresolution approach in conjunction with a local optimization method, 21 the registration aims at minimizing the normalized mutual information. A trilinear interpolation was used to derive the transformed image.
FSL software (Analysis Group, FMRIB, Oxford, UK) was used to perform the elastic model–based registration. An affine registration was first applied as an initialization step prior to the elastic registration. Spline interpolation provides continuous function of the discrete images, allowing accounting for local realignments. The space between control knots was set to be equal to 10 mm in all three dimensions. The registration was then formulated as an optimization procedure that minimized the sum of squared differences metric to find the best transformation parameters. The optimization uses a Levenberg-Marquardt modification of the Gauss-Newton method.
SPECT Data Registration to the MNI Template
The anatomical images, CT and MRI, of the subjects acquired within the studied imaging protocol were used to register the dynamic [123I]-IBVM SPECT images to the MNI template and the associated set of brain ROI. The acquisition and processing protocol is detailed in Figure 1 and is illustrated in the three following main steps:

Graphic representation of the magnetic resonance imaging (MRI) and single-photon emission computed tomography/computed tomography (SPECT/CT) [123I]-iodobenzovesamicol ([123I]-IBVM) scanning protocol. MNI = Montreal Neurological Institute.
The subject's CT and MRI images were first coregistered using a rigid registration. As these two images corresponded to the same subject, a rigid model (three translations and three rotations) was sufficient. The rigid transformation parameters were subsequently applied to the dynamic SPECT data to ensure coregistration with the subject's MRIs.
The subject's MRIs were segmented to extract the skull and CSF and only preserve the voxels corresponding to the white and gray tissues of the brain. This process was necessary to obtain an MRI with anatomic information similar to that of the MNI template.
Finally, the cranium-less (skull bone removed) MRI was spatially coregistered with the MNI T1-weighted MRI brain template using both affine (PMOD software) and elastic (FSL software) registration algorithms. The resulting transformation was subsequently applied to the 4D SPECT data sets, which were previously realigned to the subject's MRI. The dynamic SPECT image registered to the MNI template was subsequently corrected for atrophy following the method previously described.
Registration Performance Evaluation
To quantitatively assess the performance of the registration, the correlation ratio was chosen to measure on a voxel-by-voxel basis the similarity between the MNI template and the subjects' MRIs registered with each of the two studied methods. The correlation ratio is expressed as follows:

where var represents the variance and E corresponds to the conditional expectation of Y in terms of X. The correlation ratio, η, measures the functional dependence between the two compared images, X and Y. In this study, image X was chosen as the MNI template, whereas image Y corresponds to the subject's registered MRI.
A regional quantitative assessment was also carried out to locally evaluate the ability of the two considered registration methods to account for the subject's atrophy. Based on the application of the MNI set of regions to the registered and atrophy-corrected SPECT image, the volume of each ROI was calculated considering only the voxels in the white and gray matter. The better the registration was performed, the better the subject's SPECT images matched the MNI atlas, resulting in larger ROI volumes and minimizing the number of rejected voxels corresponding to CSF.
Manual Segmentation
A senior experienced anatomist manually segmented four selected brain structures using the Volume of Interest tool provided in the PMOD software for each subject. The occipital cortex and striatum were segmented as they were both needed for the pharmacokinetic modeling (see section below), and temporal and parietal cortices were also manually segmented as they exhibited significant differences in the BPnd values between the affine and elastic models. The temporal cortex was segmented from its origin beneath the frontal lobe until the central sulcus. The parietal lobe was segmented from the central sulcus to the parieto-occipital sulcus and the occipital lobe from the parieto-occipital sulcus until the end of the cortex. The striatum segmentation included the caudate nucleus and putamen.
Pharmacokinetic Modeling
For each subject, atrophy-corrected dynamic SPECT data registered to the MNI atlas were transferred to the PMOD software for derivation of regional time-activity curves (TACs). In the case of manual segmentation, the dynamic SPECT images were rigidly coregistered with the corresponding subjects' MRIs and corrected for brain atrophy before being transferred to PMOD.
TAC Calculation
A template in the MNI space was created based on anatomic automatic labeling (AAL) 22 brain segmentation. The template was built by merging some of the AAL regions to define the following anatomic ROI in each hemisphere: striatum; occipital cortex; frontal cortex; parietal cortex; temporal cortex; anterior, middle, and posterior cingulate cortex; thalamus; and cerebellar hemisphere.
The PMOD software (PXMOD tool) was used to apply this template to each frame of the registered and atrophy-corrected dynamic SPECT data and obtain average regional activities that were atrophy and decay corrected and plotted by time to obtain regional TACs.
Pharmacokinetic Modeling
In a previous study, we showed that multilinear analysis (multilinear reference tissue model 2 [MRTM2]) provides the best correlation between our results using the occipital cortex as a reference region and results from invasive blood sampling analysis.2,7 Therefore, the MRTM2 method was considered the method of choice for the quantification of [123I]-IBVM data. A two-step approach used with MRTM2 combining calculation of the reference region tissue-to-plasma clearance k'2 in a region with high binding potential (striatum) and multilinear regression analysis 7 led finally, for each ROI, to the calculation of the BPnd value and the coefficient of determination R2, a parameter measuring the quality of fit between the TAC measured on the SPECT image and the pharmacokinetic model.
Statistical Analysis
Data are reported as mean values ± standard deviation (SD) and were compared using the paired Student t-test. Statistical analyses were performed using STATISTICA software version 9 (Statsoft, Tulsa, OK). A p value < .05 was considered statistically significant.
Results
Quantitative Assessment of the MRI to MNI Registration
A representative comparison between the MNI T1 MRI template and the MRI image of an elderly subject (Figure 2) emphasized the morphologic differences between the two images.

Representative example of the morphologic difference between the Montreal Neurological Institute (MNI) T1 MRI template (A) and the MRI of an elderly subject (B). It is worth noting the mismatch between the two images at the level of the ventricles, mainly due to the age difference between the subjects used to derive the MNI template and our studied subjects.
Table 1 shows the similarity measures on a voxel-by-voxel basis using the correlation ratio between the MNI template and the MRIs registered with the affine and elastic models. For the elderly subjects, the mean correlation ratio increased from 0.65 ± 0.02 to 0.91 ± 0.01 (p < .0001) when the affine or the elastic model, respectively, was used to register the subjects' MRIs to the MNI template. Similarly, for the MSA patients, the correlation ratio increased from 0.58 ± 0.02 to 0.84 ± 0.08 (p < .0001) when using the affine or the elastic model, respectively. When comparing the two groups of subjects (elderly individuals versus MSA patients), the results show a significant difference for both registration models, with a slightly lower p value of .0003 when using the affine model (0.65 ± 0.02 vs 0.58 ± 0.02) in comparison with a p value of .0014 for the elastic model (0.91 ± 0.01 vs 0.84 ± 0.08).
Similarity Measurement (Correlation Ratio) between the MNI T1 MRI Template and the MRI of the Two Subject Groups Registered Using the Affine and Elastic Transformation Models

MNI = Montreal Neurological Institute; MRI = magnetic resonance imaging; MSA = multiple system atrophy.
Figure 3 represents the ROI volumes calculated after application of the subjects' MRI-derived atrophy correction to the SPECT images. For both groups of subjects, the volume of all the considered brain regions increased when using the elastic model compared to the affine model (p < .03 in 9 of 10 ROI for the MSA patients and in the striatum, thalamus, cerebellar hemisphere, and anterior and middle cingulate cortices for the elderly subjects), reflecting better matching of the registered and segmented subjects' MRIs with the MNI atlas.

Comparison of the atrophy-corrected region of interest (ROI) volumes (mean ± SD) calculated using both the affine and elastic model–based registration methods for (A) the group of elderly subjects and (B) the group of multiple system atrophy patients. **Significant difference with a p value < .05.
Modeling of the [123I]-IBVM Quantification
Figure 4 is a representative example with two elderly subjects of how the accuracy of the MRI to MNI registration using both affine and elastic model–based registrations may affect the location of the ROI associated with the MNI template on the registered and atrophy-corrected SPECT dynamic image prior to pharmacokinetic modeling. For the first elderly subject (top row in the figure, subject number 9 in Table 1), the size of the brain was smaller than the MNI template. Consequently, for the parietal, frontal, occipital, and temporal regions, the tracer uptake in the SPECT image obtained with the affine model is only present in half of the region volume, whereas the elastic model can better compensate for this difference in brain morphology between the MNI template and the subject's brain. Similarly, in the second elderly subject suffering from atrophy (bottom row in the figure, subject number 8 in Table 1), the elastic model better corrected for the larger size of the subject's ventricles compared to young healthy volunteers.

Example of the dynamic partial volume effect–corrected registered SPECT images of two elderly subjects (one elderly subject per row) after MRI to Montreal Neurological Institute (MNI) registration using the affine and the elastic models (left and right columns, respectively). Regions of interest associated with the MNI template have been superimposed to emphasize the difference in the realignment at the level of the parietal, frontal, occipital, and temporal regions for the first elderly subject (A and B) and at the level of the striata and thalami for the second elderly subject (C and D).
The TACs derived from the SPECT images obtained using both affine and elastic model–based registration were fitted using the MRTM2 pharmacokinetic model. For the control elderly subjects, very high values of the R2 correlation coefficient were observed (.9787 ± .0300 and .9814 ± .0206 for the affine and elastic methods, respectively). Similarly, for the MSA patients, values of the R2 coefficient of .9729 ± .0311 and .9757 ± .0320 were measured for the affine and elastic methods, respectively. Our results demonstrate that for both subject groups, no significant difference in terms of quality of fit was observed regardless of which registration model, affine or elastic, was chosen to register the SPECT dynamic images to the MNI template.
Figure 5 details for each studied brain region the mean value of the BPnd estimated for the two groups of subjects (elderly subjects and MSA patients). When comparing the two registration models, BPnd values for the elderly subjects were very similar in all the ROI, whereas for the MSA patients, BPnd values were found to be significantly different in some regions. Indeed, BPnd values decreased significantly in the parietal cortex (from 0.13 ± 0.05 to 0.09 ± 0.04, p < .02), whereas they increased significantly in the anterior cingulate cortex (from 0.18 ± 0.07 to 0.22 ± 0.06, p < .05) and in the middle cingulate cortex (from 0.16 ± 0.05 to 0.20 ± 0.07, p < .05) when using the affine versus the elastic model, respectively. A more significant difference was observed in the temporal cortex, where BPnd increased from 0.12 ± 0.04 (affine model) to 0.14 ± 0.04 (elastic model) (p < .005). For the MSA patients, as significant differences for the BPnd between the two registration approaches were obtained for the temporal and parietal cortices, these two brain structures were manually segmented, and the BPnd results for this manual method were considered the gold standard. The variations in BPnd observed when comparing affine versus elastic approaches was corroborated by the manual segmentation (see Figure 5). When comparing the BPnd values of the manual segmentation to those of the affine and the elastic approaches, in the parietal cortex, a significant difference was observed for both registration models, with p values of .006 and .028 for the affine and elastic models, respectively, reflecting a slightly higher concordance between the results obtained with manual delineation and those of the elastic model. For the temporal cortex, no significant difference was observed when comparing manual segmentation to the elastic model, whereas the affine model and the manual segmentation were found to be significantly different (p = .046) in this region.
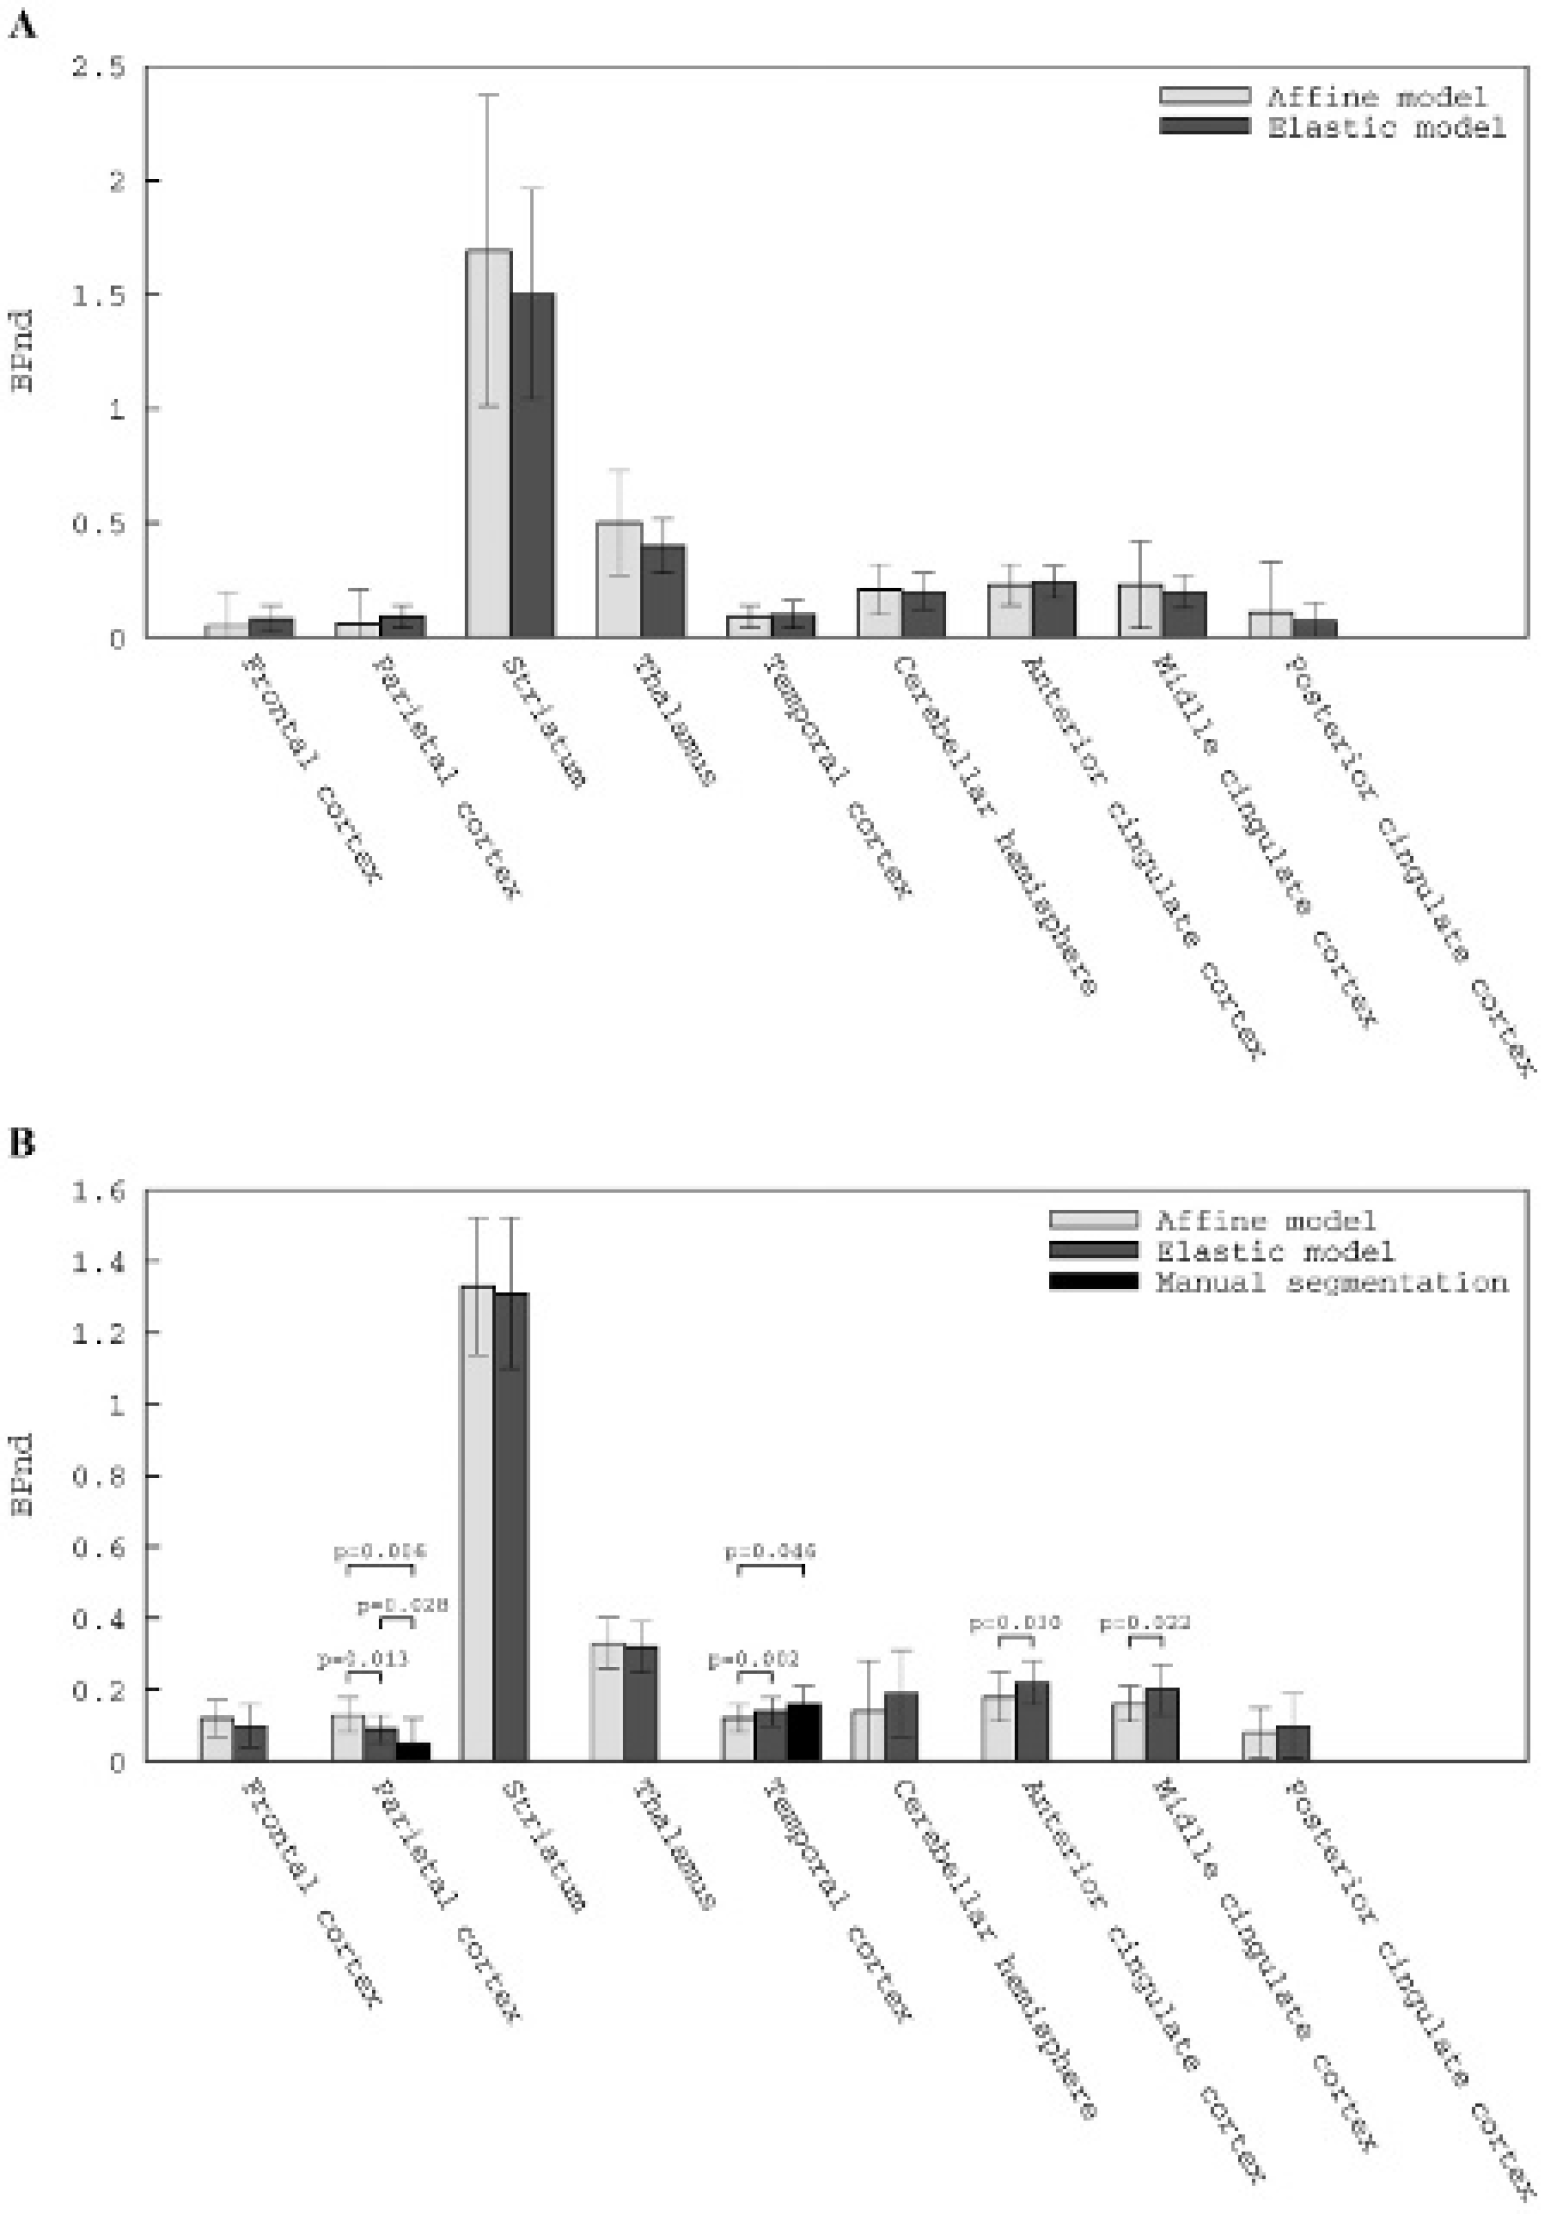
Binding potential (BPnd) estimated after application of the multilinear reference tissue model 2 (MRTM2) to the dynamic partial volume effect–corrected SPECT images registered to the Montreal Neurological Institute space using the affine and elastic transformation models, (A) the group of elderly subjects and (B) the group of multiple system atrophy patients.
Discussion
This study explored the extent to which the quantification of [123I]-IBVM brain uptake may be improved by the use of model-based registration to perform the patients' MRI to atlas registration. One basic problem for precise tracer uptake quantification was the difference in brain morphology caused by the age difference between the young normal population used to derive the MNI template (305 controls; age 23.4 ± 4.1 years) and older subjects with age-related atrophy or pathology-associated atrophy. Cross-sectional results from a large cohort of normal elderly participants revealed significant atrophy in older (> 60 years old) compared to younger participants. 23 In addition, atrophy was not uniform across brain regions, affecting preferentially the anterior regions, 24 leading to heterogeneous misregistration between elderly MRIs and the MNI template derived from MRI of young subjects. The group of elderly subjects we examined in this study exhibited normal atrophy according to their age (mean age 66.50 ± 3.92 years). 25 Moreover, in addition to age-related atrophy, neurodegenerative diseases induce localized atrophy in other areas, leading to image processing inaccuracies and to an over- or underestimation of tracer uptake depending on the brain area. In this respect, gray and white matter loss of patients with MSA has been shown affecting gray matter in the cerebellum, dorsal midbrain, putamen, and several cortical regions, including the insular cortex areas and white matter, essentially in the precentral gyrus.26,27 We performed the study in nine patients with MSA (mean age 63 ± 5.24 years); consequently, they should exhibit atrophy in the neighboring areas of some of the ROI mentioned above.
As previously described, pharmacokinetic modeling is the preferred method to quantify [123I]-IBVM SPECT images. 7 This type of quantitative analysis relies on the exact identification of different regions of the brain. The use of a template associated with a predefined set of brain regions remains the best method to ensure the accuracy and interreviewer reproducibility of the derived pharmacokinetic results. Moreover, the use of a template becomes inevitable when studying a large cohort of patients for which manual delineation of brain regions would be too time consuming. Therefore, the MNI T1 MRI template was used to register the images of the studied subjects into a common image space, allowing the computation of quantitative measures of radiotracer uptake for each region of the brain. Two registration models, affine and elastic, were considered to perform the subjects' image to MNI registration.
In this study, for the subjects suffering from significant brain atrophy, the affine model was not able to account for local misalignments of brain structures, whereas the elastic model could overcome these limitations and better realign the participants' images to the MNI template (two representative examples of elderly subjects are presented in Figure 4). Moreover, quantitative evaluation of the registration performances of these two algorithms (see Table 1 and Figure 3) demonstrated the superiority of the elastic model compared to the affine model to account for brain atrophy induced by aging (similarity measure of 0.91 ± 0.01 vs 0.65 ± 0.02 [p < .0001] and a mean ROI volume increase of 8.82 ± 5.51 mL when using the elastic versus the affine method) or neurodegenerative diseases (similarity measure of 0.84 ± 0.08 vs 0.58 ± 0.02 [p < .0001] and a mean ROI volume increase of 22.59 ± 18.55 mL when using the elastic versus the affine method). In addition, comparison of the similarity measure for the two groups of subjects showed that the elastic model performed more consistently for all the studied subjects compared to the affine model, the variation of the mean correlation ratio between the two subjects groups being reduced from 10.8% to 7.7% for the affine and elastic models, respectively (see Table 1).
Correction for atrophy performed through segmentation of the MRI previously registered to the MNI atlas using the Giovacchini method permits discarding all the voxels not belonging to white or gray matter. Therefore, the larger the ROI volume, the better the match between the registered MRI and the MNI template and, consequently, the better the match between the registered atrophy-corrected SPECT image and the MNI atlas. The mean variation in the ROI volume between the two subject groups was reduced from 22.8% to 9.9% for the affine and elastic models, respectively (see Figure 3). For the affine model, the mean ROI volume was 48% smaller for the MSA patients and 33% smaller for the elderly subjects in comparison with the mean ROI volume of the MNI. Similarly for the elastic model, in comparison with the MNI, the mean ROI volume was 33% and 26% smaller for the patient and elderly subjects, respectively. This observation suggests that brain atrophy is more severe in patients with neurodegenerative disease than in elderly subjects suffering from aging-related atrophy. Moreover, the higher intersubject variability observed in peripheral cortical areas (ie, frontal, parietal, and temporal cortices) when using elastic versus affine registration could reflect more crucial partial volume effect in these large areas comparatively to median cortices such as the cingulate cortex or subcortical areas such as the thalamus and striatum. Given the involvement of cholinergic cortical neurotransmitter abnormalities in the impairment of cognitive processes in neurodegenerative diseases, our results highlight the determinant role of image analysis methods for understanding disease-related neurotransmitter dysfunction. Therefore, the findings emphasize that even though elastic model–based registration performed better for the two groups of subjects compared to affine model–based registration, this difference in terms of performances was greater for the MSA patient group. This observation, together with the fact that only significant differences for the BPnd results were obtained for the MSA patients (see Figure 5), supports the superiority of the elastic model and its recommended use for the quantitative analysis of neurodegenerative diseases with [123I]-IBVM SPECT imaging.
Irrespective of the registration model, affine or elastic, chosen to produce the MNI-registered SPECT dynamic images, the quality of pharmacokinetic fit measured by R2 was very high for all subjects (mean value of .9756 ± .0298 and .9780 ± .0264 for the affine and elastic models, respectively, data not shown). In addition, for both groups, no significant difference in the R2 for all the studied brain structures was found when comparing the affine and the elastic approaches, with the exception of two regions that, despite close mean values, appear significantly different due to very low standard deviations. This observation demonstrates that irrespective of the registration method and of the subject group, the performance of pharmacokinetic modeling was very high and consistent. Therefore, variations in terms of BPnd values that might be observed when comparing the two registration techniques are not related to modeling but only to measured values in the dynamic SPECT images. Moreover, as previously described, 2 regional distribution of [123I]-IBVM uptake was concordant with the known densities of cholinergic sites in the brain28–30 for both registration models: levels of uptake were high in the striatum, intermediate in the thalamus, and low in the cortical regions (see Figure 5). Altogether, these findings are of great interest and demonstrate that (1) in both elderly healthy subjects and MSA patients, neither affine nor elastic registration affects the reliability of the VAChT binding parameters estimated from the analysis of [123I]-IBVM brain uptake curves, and (2) consequently, as the MRTM2 pharmacokinetic model performed well for both studied registration models, the differences observed in BPnd values in the MSA patient group could only result from differences in measuring the TAC due to a different location of the brain structures after the application of the affine or the elastic model on the registered and atrophy-corrected SPECT dynamic image. Moreover, the correction for atrophy and the more accurate placement of the ROI through the use of the elastic method did not necessarily result in an increased BPnd value. Indeed, BPnd values obtained using both registration models were shown to be unchanged in the healthy elderly subjects and significantly different for the MSA group in four cortical regions: BPnd values decreased in the parietal cortex and increased in the temporal, anterior, and middle cingulate cortices when using elastic versus affine registration (see Figure 5).
To confirm these variations in BPnd and discriminate between the affine and elastic methodologies, gold standard manual segmentation performed by an experienced anatomist was used. However, due to the high degree of interindividual variability in sulcal patterns, as well as in the cingulate gyrus,31,32 no standardized approach has been described to manually delineate the cingulate cortices. To avoid any bias in our quantitative results caused by the unstandardized manual delineation of the cingulate cortex, the anterior and middle cingulate cortices were not manually segmented, and only the results for the temporal and parietal cortices are presented. For both parietal and temporal cortices, the BPnd values obtained using the manual segmentation were closer to that of the elastic method than to the results of the affine approach, demonstrating the superiority of the elastic model to detect BPnd variations in cortical structures (see Figure 5). To summarize, better ROI placement leads to more accurate and larger ROI volume (see Figure 3), which may consequently result in a decrease or increase in the mean uptake value in the region and a decreased or increased BPnd value. These results highlight the crucial role of these image analysis methods in areas where cholinergic terminals are sparse, such as the cortical regions. Moreover, from a pharmacokinetic modeling point of view, the use of affine and elastic model–based registrations in elderly subjects affected solely subjects exhibiting high brain atrophy, such as MSA patients who exhibited increased mean ROI volume when using the elastic versus the affine model (see Figure 3) and had effects on BPnd values in the ROI most affected by atrophy, such as the cortical regions. Finally, given that elastic registration was quantitatively better than affine registration, and in brain structures exhibiting BPnd values depending on registration procedure, the application of the elastic model results in BPnd values after pharmacokinetic modeling closer to the gold standard manual segmentation method, our results demonstrate that the BPnd values measured in the MSA group with the elastic algorithm are the most accurate.
Conclusions
This study shows that the registration model is a major determinant of image preprocessing for atlas-based radiotracer uptake quantification. This report provides evidence that (1) compared to the affine model, using the elastic model–based method to perform MRI to MNI registration leads to significantly better localization of the ROI associated with the MNI template on the dynamic registered SPECT image for both normal elderly subjects and MSA patients, and (2) the registration model affects cortical presynaptic cholinergic BPnd values yielded by pharmacokinetic modeling in patients with neurodegenerative disease exhibiting more severe atrophy in cortical regions than in elderly subjects. These results lend further support to the relevant role of model-based methods to perform anatomic image to reference atlas registration in quantification of neuron integrity and show that the elastic model provides the best image processing to quantify cholinergic neurotransmission in patients with neurodegenerative disease. These preliminary findings require further confirmation in larger samples. Further studies are also required to extend these results to other radiotracers. As pharmacokinetic modeling is becoming the method of choice in SPECT/PET neuroimaging quantification, the derivation of multiregional TACs becomes necessary to compute quantitative parameters of tracer uptake. The fully automated method developed in this study allows the fast calculation of atrophy-corrected TACs ready to integrate in a nuclear medicine modeling-dedicated software. It may advantageously represent an alternative method to the laborious nonautomatic multistep methods requiring image registration, segmentation, and labeling of subjects' MRIs prior to derivation of the regional brain TACs.
Footnotes
Acknowledgments
We wish to thank T. Blandin for his technical support and Dr. Joel Swendsen for his scientific support.
Financial disclosure of authors and reviewers: None reported.