
Abstract
The goal of this study was to compare different quantification approaches and reconstruction methods to estimate the binding potential in [11C]raclopride studies in rats. The final aim was to determine if the results obtained with short-acquisition scanning were comparable to the results obtained with long-acquistion (conventional) scanning. We analyzed two rat data sets: a baseline versus a pretreatment study (with cold raclopride) and a young versus an old animal group comparison. The study results support the contention that optimization of [11C]raclopride positron emission tomographic studies in rats by shortening the acquisition time is feasible. In addition, filtered backprojection is recommended as a reconstruction algorithm, although iterative methods may be more sensitive to detect within-group differences.
POSITRON EMISSION TOMOGRAPHY (PET) is a widely used technique to study certain critical components of neurotransmission. One of the most commonly used radioligands to assess dopamine type 2 (D2) receptor occupancy is [11C]raclopride, a highly selective antagonist of D2/D3 dopamine receptors.1,2 By using PET, dynamic data can be obtained that reflect the time-activity course of the radiotracer in different brain regions. The analysis of these data may be used to provide an estimation of the binding potential (BP), which reflects the density of receptors in a given brain region. 3
The models used for BP PET quantification can be classified into two major categories depending on how the radioligand is administered: rapid bolus infusion or bolus plus constant infusion. The objective of the latter is to reach equilibrium between the tracer's infusion and the clearance rate. This approach requires several hours of constant infusion, and considerable intrasubject variation has been reported,3–5 so it has become a less used methodology. Another issue related to the quantification of the BP is the requirement of getting arterial blood plasma during the study, although the use of a reference region instead or alternative quantification methods is currently well accepted. 5
PET technique has become an invaluable tool in translational research because the same instrumentation is used in human and preclinical studies. Due to the differences in brain weight between humans and small laboratory animals, it is essential in PET that the total chemical quantity (mass) in the injected dose (mass effect study) be carefully considered. 6 The main drawback of small-animal PET imaging is that a study using this technique can become very expensive because, in principle, a radiotracer synthesis is needed for each animal. This can be partly solved by shortening the scan acquisition time and imaging more animals with each radiotracer dose. A full validation and comparison of the image quantification results obtained using short or long image acquisitions should be done first. In addition, the role of the image reconstruction algorithm used (filtered backprojection versus iterative algorithms) in image quantification results should also be evaluated.
The goal of this study was to compare different quantification approaches and reconstruction methods to estimate the BP in [11C]raclopride studies in rats. Concretely, the simplified reference tissue model (SRTM),1,7 the interval method (IM), 4 and the transient equilibrium method (TEM) 4 have been compared. The final aim was to determine if the results obtained with short-acquisition scanning were comparable to the results obtained by with long-acquisition (conventional) scanning. We analyzed two rat data sets: a baseline versus a pretreatment study (with cold raclopride) and a young versus an old animal group comparison.
Methods
Radiochemistry and Quality Control
[11C]Raclopride was synthesized according to the procedure described in the European Pharmacopoeia, 8 with minor modifications. Briefly, [11C]CO2 was generated in an IBA Cyclone 18/9 cyclotron by bombardment of a gas N2/O2 (95/5) mixture with high-energy protons. Formation of [11C]CH3I was carried out in a Bioscan Methylation Module by reduction of [11C]CO2 in the presence of lithium aluminum hydride (300 μL, 0.1 M solution in dry tetrahydrofuran, ABX, Radeberg, Germany). The methylation reaction (time = 6 minutes, room temperature) was carried out in a 2 mL stainless steel high-performance liquid chromatography (HPLC) loop precharged with a solution of O-desmethyl-raclopride (free base, 1 mg, ABX, Radeberg, Germany) in dimethyl-sulfoxide (80 μL) and aqueous 5 M sodium hydroxide solution (3 μL). The reaction mixture was purified by means of HPLC (stationary phase: Mediterranea Sea 18, 9.6 mm × 250 mm, 5 μm particle size; mobile phase: 62/38 ammonium formiate buffer (pH = 3.9)/acetonitrile), using an ultraviolet (λ = 254 nm) and a radiometric detector connected in series. Purified fraction (retention time 11–13 minutes) was diluted with saline (25 mL) and eluted through a C-18 cartridge (Sep-Pak Light, Waters) to retain [11C]raclopride. Further elution of the cartridge with ethanol (1 mL) and saline (9 mL) and double filtration through 0.22 μm sterile filters yielded the final [11C]raclopride solution. Quality control was performed in all cases before administration. Residual solvents were determined by means of gas chromatography; radiochemical purity was measured by means of radio-HPLC, and product identification was performed by radio-HPLC and coelution with standard reference solution. Typical radiochemical yields (end of synthesis) and specific activities were above 5% and 20 GBq/μmol, respectively. Radiochemical purity was higher than 95% in all cases.
Animals
Six adult male Sprague Dawley rats (Charles River, Barcelona, Spain) weighing 300.6 ± 55.6 g (mean ± SD) were used. Animals were housed with ad libitum access to food and water in standard environmental conditions until the PET procedure was performed. For the second set of experiments, male Oncins France Strain A rats (Charles River) were purchased. Six young adult animals (≈ 8 weeks old) and 6 animals over 80 weeks old were included in the study. Animals were housed with ad libitum access to food and water in standard environmental conditions until the PET procedure.
At the time of the PET acquisitions, the younger animals were 15.08 ± 3.58 (mean ± SD) weeks old and the older animals were 85.42 ± 2.84 (mean ± SD) weeks of age. At this time, the body weight of the animals was 332.73 ± 80.66 g (mean ± SD) and 606.67 ± 48.96 g (mean ± SD) for the young and older groups, respectively. All animal work was conducted according to local legislation and in compliance with the directives of the European Union.
PET Image Acquisition
Baseline (n = 4) and blocking (n = 2) PET studies were performed. Rats were anesthetized with isofluorane and received an intravenous bolus injection of [11C]raclopride. Blocking studies were performed by coinjection of 1 mg/kg of nonlabeled raclopride. Anesthesia was maintained through the whole acquisition with isofluorane vaporized in O2 at a concentration of 2.5% with a facial mask. PET data were collected for 90 minutes in an animal-dedicated camera (microPET R4, Concorde, Siemens, Knoxville, TN). For the second set of data, only baseline studies (young, n = 6; old, n = 6) were acquired in the same conditions as described above.
Image Analysis
All data acquired were reconstructed in two ways: framing the data to obtain a dynamic study (frames: 12 × 20, 10 × 60, 10 × 300, and 2 × 600 seconds) and summing the data acquired for certain intervals (0–30, 30–60, 60–90, and 0–90 minutes). Images were corrected for decay and nonuniformities. Neither attenuation nor scatter correction was applied.
Images were reconstructed using filtered backprojection (FBP) and the maximum a posteriori (MAP; 18 iterations) ordered subset expectation maximization (OSEM; 12 subsets, 2 iterations) algorithm.
PET images were coregistered to an anatomic rat brain atlas 9 by maximizing the mutual information function using the Statistical Parametric Mapping 5 program (Wellcome Trust Centre for Neuroimaging, London, UK). Two regions of interest (ROIs) were manually delineated over the atlas with the help of the MRIcro program (Chris Rorden, Columbia, SC). The ROI selected were the striatum (a region known to have a high density of D2 receptors) and the cerebellum (a region with a negligible amount of D2 receptors; the reference region). Time-activity curves were obtained for each animal by applying the ROIs over the dynamic data. ROIs were also applied to the summed images for a given interval (IM) (0–30, 30–60, 60–90, and 0–90 minutes), and the mean value was obtained. Following that, the BP was calculated using the different methods (SRTM, IM, TEM). All methods are based on the fact that a reference region exists—the cerebellum in this case—which accounts for the nondisplaceable amount of radiotracer. The BP obtained with the SRTM and FBP reconstructed images was considered the “gold standard.”
Simplified Reference Tissue Model
Time-activity curves were analyzed and the BP was determined using the SRTM. Briefly, the BP can be calculated applying equation 1 over the time-activity curves (equations 2 and equation 3). Quantification was done with the PMOD program.


where BPsp = binding potential in a specific region, Cb = concentration bound at a specific binding compartment, Cn = concentration at a nonspecific binding compartment, Csp = concentration at specific binding tissue (striatum in this case), and Cref = concentration at the reference region, the cerebellum in this case.
Interval Method
The BPsp can be calculated using equation 4:

In this case, the concentration at specific binding tissue was the striatum.
Transient Equilibrium Method
Transient equilibrium is defined as the time point where the derivate of the specific binding curve is zero4,10 (equation 5). Formally,
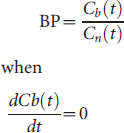
The plot Cb (striatum–cerebellum) over time allowed determining graphically the transient equilibrium point, which corresponds to the point where the curve reaches its maximum. Once this point is determined, the corresponding BP 4 can be calculated from the Cb/Cn plot.
Statistical Analysis
To determine the impact on BP estimation of the different factors under study, an analysis of variance (ANOVA) was set up, which included reconstruction (FBP, OSEM), quantification (SRTM; IM: 0–30, 0–90, 30–60, and 60–90 minutes; TEM), group (young, old), and pretreatment (baseline, blocked). At first, all main effects and possible interactions were modeled, but the model was subsequently simplified by discarding all nonsignificant interactions. Pairwise Bonferroni post hoc analysis was carried out on the different quantification methods. Statistical significance was concluded when p < .05.
Results
The total mass of injected raclopride in baseline studies was in the range of 1.36 to 5.49 nmol/kg, avoiding a mass effect. The BPs calculated using the IM with OSEM and FBP images for the different time intervals are presented in Table 1. The BPs calculated using the SRTM and the TEM are also included. The time to reach the transient equilibrium was 9.43 ± 3.08 minutes (mean ± SD). The results obtained with the second set of experiments (young and old animals) are reported in Table 2. A baseline study reconstructed with FBP and OSEM, overlaid over the anatomic atlas, can be seen in Figure 1. The corresponding blocking study has also been included.

Image reconstruction. Baseline study reconstructed using filtered backprojection (FBP) (left) and ordered subset expected maximization (OSEM) (center) algorithms. Blocking study reconstructed using FBP (right). Images were coregistered and overlaid to an MRI template.
Quantification Results of [11C]Raclopride BP of the Rat Striatum Using Different Methods and Reconstruction Algorithms for Baseline (n = 4) and Blocking (n = 2) Studies

BP = binding potential; FBP = filtered backprojection; OSEM = ordered subset expected maximization; SRTM = simplified reference tissue model; TEM = transient equilibrium method.
Quantification Results of [11C]Raclopride BP of the Rat Striatum Using Different Methods and Reconstruction Algorithms for Young and Old Animals

BP = binding potential; FBP = filtered backprojection; OSEM = ordered subset expected maximization; SRTM = simplified reference tissue model; TEM = transient equilibrium method.
Comparison OSEM versus FBP
For baseline studies, BP values determined with OSEM images were higher compared to FBP for all methods considered (see Table 1 and Table 2). For baseline studies, the biggest difference in BP was obtained for the SRTM (28%). Differences for the IM were above 20%, except for the late IM (60–90 minutes), which was 2%. For the TEM, differences were also above 20%. For the blocking studies, OSEM values were even lower than FBP in some cases, although the differences were very small (between 2 and 5%). The relative differences between OSEM and FBP values are reported in Table S1 (available with online version only).
For the second set of data, the greatest difference was obtained for young animals in the 60- to 90-minute IM (37%), followed by the SRTM (33%). For old animals, again the greatest difference was seen in the SRTM (48%), followed by the 30- to 60-minute (40%) and 60- to 90- minute (39%) IMs.
Comparison of Methods
Overall, the BP values obtained over the 0- to 30-minute IM were the lowest ones compared to the other IM and the values obtained for the 30- to 60-minute IM were the highest. The 0- to 90-minute IM showed very high agreement with the SRTM and the TEM (see Table 1 and Table 2). The relative difference in the value obtained for each method compared to the SRTM is computed in Table S2 (available with the online version only).
Statistical Analysis
All main effects (reconstruction, quantification, group, and pretreatment) reached significance, but only statistically significant interactions were found between reconstruction and group, reconstruction and pretreatment, and group and pretreatment. This model explained 95.3% of the observed variance. Post hoc analysis of the different levels of the quantification factor revealed statistically significant differences between the 0- to 30-minute IM and the 30- to 60-minute IM, the 0- to 30-minute and the 60- to 90-minute IM, the 0- to 30-minute IM and the TEM, the 0- to 90-minute IM and the 30- to 60-minute IM, the 0- to 90-minute IM and the 60- to 90-minute IM, the 30- to 60-minute IM and the SRTM, the 30- to 60-minute IM and the TEM, the 60- to 90-minute IM and the SRTM, and the and 60- to 90-minute IM and the TEM.
Discussion
Through the years, several approaches have been applied for the quantification of [11C]raclopride; the gold standard method, SRTM, was developed by Lammertsma and Gunn and their colleagues in humans.1,7 In addition, in 1997, Ito and colleagues performed an extensive study. 4 They used a rapid bolus injection and a continuous infusion to compare different quantifications methods in humans (full kinetic modeling with arterial input function, TEM, IM, and continuous infusion method).
To optimize and simplify the [11C]raclopride studies in rats, we sought to study the STRM, IM, and TEM (applied for the first time in rats to our knowledge). We also evaluated the effect of the reconstruction algorithm used (OSEM and FBP) on two sets of experiments.
The BPs determined using the SRTM fall in the range of the values reported in previous studies.1,10–12 Most of the published literature calculates the BP from FBP reconstructed images. The FBP method is fast and simple and has become the classic method for image reconstruction. Iterative image reconstruction methods are an alternative with a high computational cost but are currently available. These methods produce images with better contrast, a higher signal to noise ratio, and improved spatial resolution. We obtained a higher BP (28%, p = .04) when the SRTM was used in conjunction with OSEM images instead of FBP images.
The 0- to 90-minute IM BP values agree very well with the values obtained using the full kinetic SRTM. Image quantification of the IM is easier to perform because it does not require any kinetic modeling tools. In addition, the IM might be less prone to movement artifacts compared to kinetic analysis. The fact that the differences between FBP and OSEM images are smaller for the late IM compared to the early IM was expected because it is known that the performance of iterative reconstruction algorithms is highly dependent on appropriate counting statistics. 13
Surprisingly, the TEM was in very good agreement with SRTM values. This is the first time that the TEM has been applied to [11C]raclopride PET rat studies. The calculated transient equilibrium time was approximately 10 minutes postinjection. This result suggests that even shorter acquisition times (15 minutes) could lead to reliable results compared to the 90 minutes used for the SRTM. These acquisition periods (less than 30 minutes) would enable us to image more than one animal with each synthesis (if specific activity is high enough and successive injections are adjusted to avoid a mass effect 14 ). However, these simplified methods assume known and stable tracer kinetics. Therefore, in experiments in which changes in kinetics are suspected, full kinetic SRTM remains the method of choice.
The use of iterative algorithms will increase our sensitivity to detect changes when differences between baseline and blocking studies are to be assessed. But it should be kept in mind that if differences between groups are to be assessed (both in baseline situations), these differences might be greater if the FBP reconstruction method is used (within groups). The results of this study support this hypothesis because we examined two set of experiments. In the first, baseline values were compared to the ones obtained in blocking conditions. In the second set, young versus old animals were compared, all in baseline conditions. 15
Finally, the BP values obtained agree with the values reported in the literature, which range between 1 and 3.1,10–12 Most of the reported studies were quantified using the SRTM with 60- or 90-minute acquisition. The strain difference between Sprague Dawley and Oncins France rats is a factor of 2, which is maintained among methods.
Taken together, our results support the contention that optimization of [11C]raclopride PET studies in rats by shortening the acquisition time is feasible. The method that provides the best compromise among acquisition time, quantification simplicity, and accuracy is the TEM. This simplified method comes at the expense of sensitivity to potential changes in tracer kinetics. For optimal quantification accuracy, FBP is recommended as the reconstruction algorithm, although iterative methods may be more sensitive to detect between-group differences.
Footnotes
Acknowledgments
All work was performed at the Institut Alta Tecnologia-PRBB. We acknowledge Dolors Delafuente for technical support.
Financial disclosure of authors: This study was partly funded by grants from PHECOMP (LHSM CT 2007-037669) and from the Fondo de Investigación Sanitarias, Instituto de Salud Carlos III (PS09/02620 and PS09/02217), and by CDTI under the CENIT Programme (AMIT Project) from the Spanish Ministry of Science and Innovation. E.T. is partly supported by the Torres Quevedo program.
Financial disclosure of reviewers: None reported.