
Abstract
Techniques for visualizing cell death can provide noninvasive assessment of both disease states and response to therapeutic intervention. The purpose of this study was to develop and evaluate a multimodal imaging nanoplatform for the detection of cell death. In this study, we evaluated 111In-labeled annexin A5–conjugated core-cross-linked polymeric micelles (CCPMs) for multimodal imaging of cell death in various disease models. Three different models were conducted, including tumor apoptosis, hepatic apoptosis, and inflammation. Both micro single-photon emission tomography/computed tomography (μSPECT/CT) and fluorescence molecular tomography (FMT) were performed. Biodistribution and immunohistochemistry assays were carried out to validate the selectivity of cell death imaging. In all disease models, cell death was clearly visualized by both μSPECT/CT and FMT. In contrast, there was relatively low signal in the corresponding tissues of control mice. Moreover, the radioactive signal from 111In-labeled annexin A5–CCPM colocalized with its fluorescence signal, and both signals were confined to regions of dying cells. 111In-labeled annexin A5–CCPM allows visualization of cell death by both nuclear and optical techniques at the whole-body level as well as at the microscopic level. It has the potential to aid the diagnosis of disease states or tissue responses involving abnormal cell death.
THE MOST WIDELY USED CLASSIFICATION of mammalian cell death recognizes three types: apoptosis, necrosis, and autophagy. Programmed cell death, including apoptosis and autophagy, is an essential biologic process that occurs by genetically controlled program. Nonprogrammed cell death, like necrosis, is usually considered an accidental form of cell death and can be initiated or modulated by programmed control mechanisms in certain instances. 1 Cell death plays a vital role in homeostasis, normal development, pathology, and physiology. Dysregulation of cell death can lead to the accumulation of unwanted cells and disorder of normal tissues. The recognition of cell death has facilitated advances in unraveling the mechanisms of many diseases (eg, myocardial, neurodegenerative, and autoimmune diseases) and the development of therapeutic agents (eg, anticancer drugs).1–4 Therefore, a noninvasive technique for the detection of cell death is highly desired to monitor disease states and their responses to therapeutic interventions. Phosphatidylserine (PS), a component of cell membrane phospholipids in the inner plasma membrane, can expose on the outer leaflet of the plasma membrane in dying cells as an “eat me” signal.5,6 Annexin A5, an endogenous human protein, can specifically and strongly bind to PS on dying cells. 7 The number of annexin A5–binding sites per cell can increase 100- to 1,000-fold during apoptosis, reaching values of about 4 million in some cell lines.8,9 Currently, annexin A5 is the most widely used ligand in the visualization of cell death. In the past decades, a variety of annexin A5 derivatives have been developed for use with various imaging modalities.10–25 However, most of these agents are limited by the short half-life of annexin A5, which allows only a snapshot of the cell death process.
In general, cell death is a dynamic process in which newly generated dying or dead cells are rapidly removed. 26 Therefore, there is a short time window during which dying or dead cells display their characteristic features, such as exposure of PS. Furthermore, the peak of cell death activity after therapy varies from treatment to treatment and from patient to patient. Thus, we have developed a long-circulating dual-labeled annexin A5–conjugated corecross-linked polymeric micelle (CCPM) nanotracer, which allows multimodal imaging of cell death. In our previous report, 111In-labeled annexin A5–CCPM displays almost twofold higher uptake than conventional 99mTc-hydrazi-nopyridine-3-carboxylic acid (HYNIC)-conjugated annexin A5 in EL4 lymphoma after chemotherapy, 27 demonstrating the feasibility of using this nanotracer to visualize tumor apoptosis. However, it was necessary to demonstrate visualization of cell death using the nanotracer in other types of disease models. In the current study, four different cell death models were examined to evaluate the potential of 111In-labeled annexin A5–CCPM for visualization of cell death. These models include two tumor apoptosis models induced by cyclophosphamide,28,29 a hepatic apoptosis model induced by anti-Fas antibody, 18 and an acute inflammation model induced by turpentine. 20
Materials and Methods
Reagents
Common reagents were purchased from Sigma-Aldrich (St. Louis, MO) or Acros (Geel, Belgium) and used as received unless otherwise specified. Annexin A5 was obtained from Theseus Imaging Corporation (Cambridge, MA). CCPM nanoparticles were provided by Carestream Health, Inc. (Rochester, NY). The detailed procedure for synthesis and radiolabeling of the annexin A5–CCPM has been described elsewhere. 27 The average diameter of the nanoparticles was 25 nm. Each annexin A5–CCPM nanoparticle contained approximately 40 annexin A5 molecules on the surface and 21 Cy7-like dye molecules. The excitation and emission light intensities for the annexin A5–CCPM nanoparticles peaked at 755 and 781 nm, respectively. 27 Indium-111 chloride (111InCl3) was obtained from Perkin Elmer (Waltham, MA).
Tumor Apoptosis Model
All animal studies were carried out in the Small Animal Imaging Facility at The University of Texas MD Anderson Cancer Center in accordance with institutional guidelines. Cyclophosphamide is a widely used chemotherapeutic agent for lymphoma, leukemia, breast cancer, and ovarian cancer. 30 Treatment of mice bearing 38C13 lymphoma with cyclophosphamide induces substantial apoptosis. 28 This model was used to study the effect of cancer treatment on the biodistribution of 111In-labeled annexin A5–CCPM. Briefly, 38C13 cells (1.0 × 10⁶) were injected subcutaneously in the right flanks of 12 6- to 8-week-old female C3H/HeNCrl mice (22-25 g; Charles River Laboratories, Wilmington, MA). Two weeks after inoculation, when tumors reached about 5 to 6 mm in diameter, mice were divided into two groups (six mice per group). Mice in the chemotherapy group were treated with intraperitoneal injection of 100 mg/kg cyclophosphamide. Mice in the control group were untreated. 111In-labeled annexin A5–CCPM was injected via the tail vein at a dose of 5 × 10¹³ nanoparticles per mouse (7.4 MBq/mouse) 24 hours after drug treatment.
The 9L gliosarcoma model is described in the supplemental material (available online only). Induction of apoptosis in a 9L gliosarcoma tumor model was achieved as described previously. 29
Hepatic Apoptosis Model
Hepatic apoptosis was induced as described previously. 18 Anti-Fas antibody, which binds to hepatic Fas receptors, can be used to induce massive apoptosis of hepatocytes in mice within a few hours, mimicking fulminant hepatitis. 31 Twenty-one healthy female BALB/c mice (22–25 g; Charles River Laboratories) were divided into three groups (seven mice per group). Mice in groups 1 and 3 were injected intravenously with a purified anti-Fas monoclonal antibody (10 μg/mouse, Jo2, BD Biosciences, San Diego, CA). Mice in group 2 were injected with phosphate-buffered saline (PBS) and were used as controls. Two hours after administration of anti-Fas antibody or PBS, mice in groups 1 and 2 received intravenous administration of 111In-labeled annexin A5–CCPM at a dose of 5 × 10¹³ nanoparticles per mouse (7.4 MBq/mouse), whereas mice in group 3 were injected intravenously with 111In-labeled CCPM (without annexin A5).
Inflammation Model
Turpentine can be used as a stimulus to trigger a series of inflammation reactions, such as migration of granulocytes to the injured tissues and subsequent clearance of apoptotic granulocytes through PS-specific recognition by monocytes, after intramuscular injection. 20 Ten healthy female Swiss mice (22–25 g; Charles River Laboratories) received a 100 μL intramuscular (right thigh) injection of 100% pure gum turpentine (Spectrum, New Brunswick, NJ). The left thigh served as an internal control for nonspecific muscle uptake of the nanotracer. Mice were divided into two groups (five mice per group). In group 1, 111In-labeled annexin A5–CCPM was injected intravenously at a dose of 5 × 10¹³ nanoparticles per mouse (7.4 MBq/mouse) 24 hours after the administration of turpentine. Mice in group 2 were injected with 111In-labeled CCPM (without annexin A5) as a control.
Imaging and Biodistribution Studies
At predetermined time intervals after administration of 111In-labeled annexin A5–CCPM, the mice underwent a series of studies, including micro single-photon emission tomography/computed tomography (μSPECT/CT), fluorescence molecular tomography (FMT), biodistribution, autoradiography, optical imaging, and histologic analysis. mSPECT/CT images were acquired using an xSPECT-CT scanner (Gamma Medica, Northridge, CA). SPECT (3 cm radius of rotation, 32 projections, 20 seconds per projection) and CT scans (512 projections, 75 kV, 500 mA) were acquired and coregistered for image fusion and three-dimensional anatomic localization of the tracer signal. The acquired SPECT and CT data sets were processed with Amira 5.1 (Visage Imaging, San Diego, CA). Whole-body optical imaging was performed using an FMT camera (Visen Medical, Bedford, MA). Briefly, the mice were positioned in an FMT imaging chamber. A near-infrared laser diode transilluminated the mice body and signal detection occurred via a camera placed on the opposite side of the mice. Appropriate optical filters allowed collection of both fluorescence and excitation data sets, and the multiple source-detector fluorescence projections were normalized to the paired collection of laser excitation data. During each imaging session, mice were anesthetized with 2% isoflurane gas (Iso-Thesia, Rockville, NY) in oxygen.
At the end of the imaging sessions, the mice were sacrificed, and various tissues (blood, heart, liver, spleen, kidney, lung, stomach, intestine, muscle, bone, brain, and tumor) were removed, weighed, and assessed for radioactivity with a Cobra Auto-gamma counter (Packard Instrument, Meriden, CT). Uptake of the nanoparticles was calculated as the percentage of the injected dose per gram of tissue (%ID/g). Tumor to blood and tumor to muscle ratios were calculated on the basis of %ID/g values of the corresponding tissues.
Autoradiography and Optical Imaging
Tissues of interest (tumors, livers, or muscles) were harvested at the end of the imaging sessions, snap-frozen, and sectioned into 5 mm sections. The sections were photographed and exposed on BAS-SR 2025 Fuji phosphorus film. The film was scanned with an FLA5100 Multifunctional Imaging System (Fujifilm Medical Systems USA, Stamford, CT).
After autoradiographic study, optical images of the sections were acquired by scanning the slides at 800 nm using the Odyssey infrared imaging system (Li-Cor Biotechnology, Lincoln, NE).
Histologic Analysis
In 38C13 lymphoma models, following autoradiographic study, one slice of each tumor was immunostained with anti-caspase-3 antibody using a commercial kit (Sigma-Aldrich, St. Louis, MO) according to the manufacturer's protocol. The stained sections were counterstained with hematoxylin. Images were recorded using a Zeiss Axio Observer.Z1 fluorescence microscope (Carl Zeiss MicroImaging GmbH, Jena, Germany).
For terminal deoxynucleotidyl transferase dUTP nick end labeling (TUNEL), a slide adjacent to those used for autoradiographic studies was stained with a TUNEL staining kit (R&D Systems, Minneapolis, MN) according to the manufacturer's instructions. Cell nuclei were counterstained with 4′-6-diamidino-2-phenylindole (DAPI). The cellular fluorescence was examined under the same Zeiss Axio Observer.Z1 fluorescence microscope equipped with a 350/450 nm ultraviolet filter for DAPI, a 494/517 nm filter for TUNEL staining, and a 710/810 nm filter for Cy7.
In the models of hepatic apoptosis and inflammation, after autoradiography, one slice of each tissue (liver or thigh abscess) was stained using hematoxylin and eosin (H&E). Images were recorded by the fluorescence microscope.
Statistical Analysis
Statistical analysis was performed with Prism version 4.0 (GraphPad Software, La Jolla, CA). A Student t-test was used to compare differences in tissue uptakes between groups. Differences with p < .001 were considered significant.
Results
Tumor Apoptosis Model
Figure 1 compares μSPECT/CT and FMT optical images of untreated mice and mice treated with cyclophosphamide 48 hours after administration of 111In-labeled annexin A5–CCPM. Apoptotic tumors were clearly visualized in the treated mice after chemotherapy (Figure 1, A and B, bottom), whereas the tumors in the untreated mice could not be seen, indicating an absence of apoptosis, as expected (Figure 1, A and B, top). Intratumoral distribution of 111In-labeled annexin A5–CCPM was shown in both autoradiographic images (Figure 1C) and fluorescence images (Figure 1D) of tumor sections from the untreated and treated mice. Chemotherapy caused markedly increased radioactivity and fluorescent signal intensity. The locations of both radioactivity and fluorescence signals from 111In-labeled annexin A5–CCPM correlated with the locations of apoptotic cells stained with anti-caspase-3 antibodies (Figure 1, E and F). Moreover, the fluorescent signal from 111In-labeled annexin A5–CCPM colocalized with apoptotic cells detected with the TUNEL assay (Figure 2).

Dual μSPECT/CT and FMT of 38C13 lymphoma apoptosis with 111In-labeled annexin A5–CCPM. The mice in the control group (top) were injected intravenously only with 111In-labeled annexin A5–CCPM. The mice in the chemotherapy group (bottom) received an intravenous injection of 111In-labeled annexin A5–CCPM 24 hours after treatment with cyclophosphamide (100 mg/kg) by intraperitoneal injection. (A) Representative μSPECT/CT images. (B) Representative FMT images. (C) Representative autoradiographs of excised tumors. (D) Fluorescence images of the same slides used in the autoradiographic studies. (E and F) Immunohistochemical staining for caspase-3 (brown) of the same slides used in autoradiographic studies. All images were acquired 48 hours after injection of 111In-labeled annexin A5–CCPM. Arrows indicate tumor.

Fluorescence microscopy of a 38C13 lymphoma section from a mouse treated with chemotherapy. The tumor sections were subjected to TUNEL staining (green). Signal from Cy7-loaded annexin A5–CCPM was pseudocolored red, and cell nuclei were stained with DAPI (blue). Scale bar: 20 μm.
The biodistribution data were consistent with our imaging data. Forty-eight hours after injection, the mean uptake of 111In-labeled annexin A5–CCPM was significantly higher in the tumors of the treated mice (4.84 %ID/g) than in those of the untreated mice (0.49 %ID/g) (p < .001) (Figure 3). The tumor to blood ratios were 0.2 in the untreated group and 2.8 in the cyclophosphamide-treated group, and the tumor to muscle ratios were 4.6 and 22.7, respectively.

Biodistribution of 111In-labeled annexin A5–CCPM in mice bearing 38C13 lymphoma 48 hours after administration. The mice in the chemotherapy group were injected with 111In-labeled annexin A5-CCPM intravenously 24 hours after administration of cyclophosphamide (black). The mice in the control group were injected only with 111In-labeled annexin A5–CCPM (white). Data were obtained using the radioactivity count method and plotted as %ID/g. All data are expressed as mean ± standard deviation (n = 6). **p < .001.
Similarly, apoptotic 9L gliosarcoma tumors in the mice treated with cyclophosphamide were readily visualized with both μSPECT/CT and FMT after administration of 111In-labeled annexin A5–CCPM (Figure S1, online version only). TUNEL staining showed colocalization of 111In-labeled annexin A5–CCPM and apoptotic cells in 9L tumors treated with cyclophosphamide but not in untreated tumors, confirming that the nanotracer detected apoptotic cells (Figure S2, online version only).
The biodistribution data demonstrated significantly higher uptake of the nanotracer in the 9L gliosarcoma tumors of cyclophosphamide-treated mice than in the tumors of untreated mice (p < .001) (Figure S3, online version only). It is interesting to note that the uptake of the nanotracer in the liver, spleen, and bone of treated mice was also significantly higher than that of untreated mice (p < .001), suggesting damage of these organs caused by the treatment.
Hepatic Apoptosis Model
High levels of 111In-labeled annexin A5–CCPM accumulated in the livers exposed to anti-Fas antibody. In contrast, much lower nanotracer uptake was detected in healthy livers of control mice after injection of 111In-labeled annexin A5–CCPM (Figure 4, A and B). Both autoradiographic images (Figure 4C) and fluorescence optical images (Figure 4D) of hepatic sections confirmed the high signal intensity of 111In-labeled annexin A5-CCPM in the apoptotic livers. In histologic analysis (Figure 4E), hepatocytes in the liver treated with anti-Fas antibody exhibited pyknosis of nuclei and condensation of the cytoplasm, which are typical features of cell death. It demonstrated that anti-Fas antibody could rapidly induce massive apoptosis in the liver of mice. The biodistribution data further confirmed the imaging results. The uptake value of 111In-labeled annexin A5–CCPM in apoptotic liver was 35 %ID/g, which was significantly higher than the nanotracer's uptake in healthy liver (10 %ID/g, p < .001) and the uptake of 111In-labeled CCPM in apoptotic liver (8 %ID/g, p < .001) 3 hours after nanotracer injection (Figure 5).
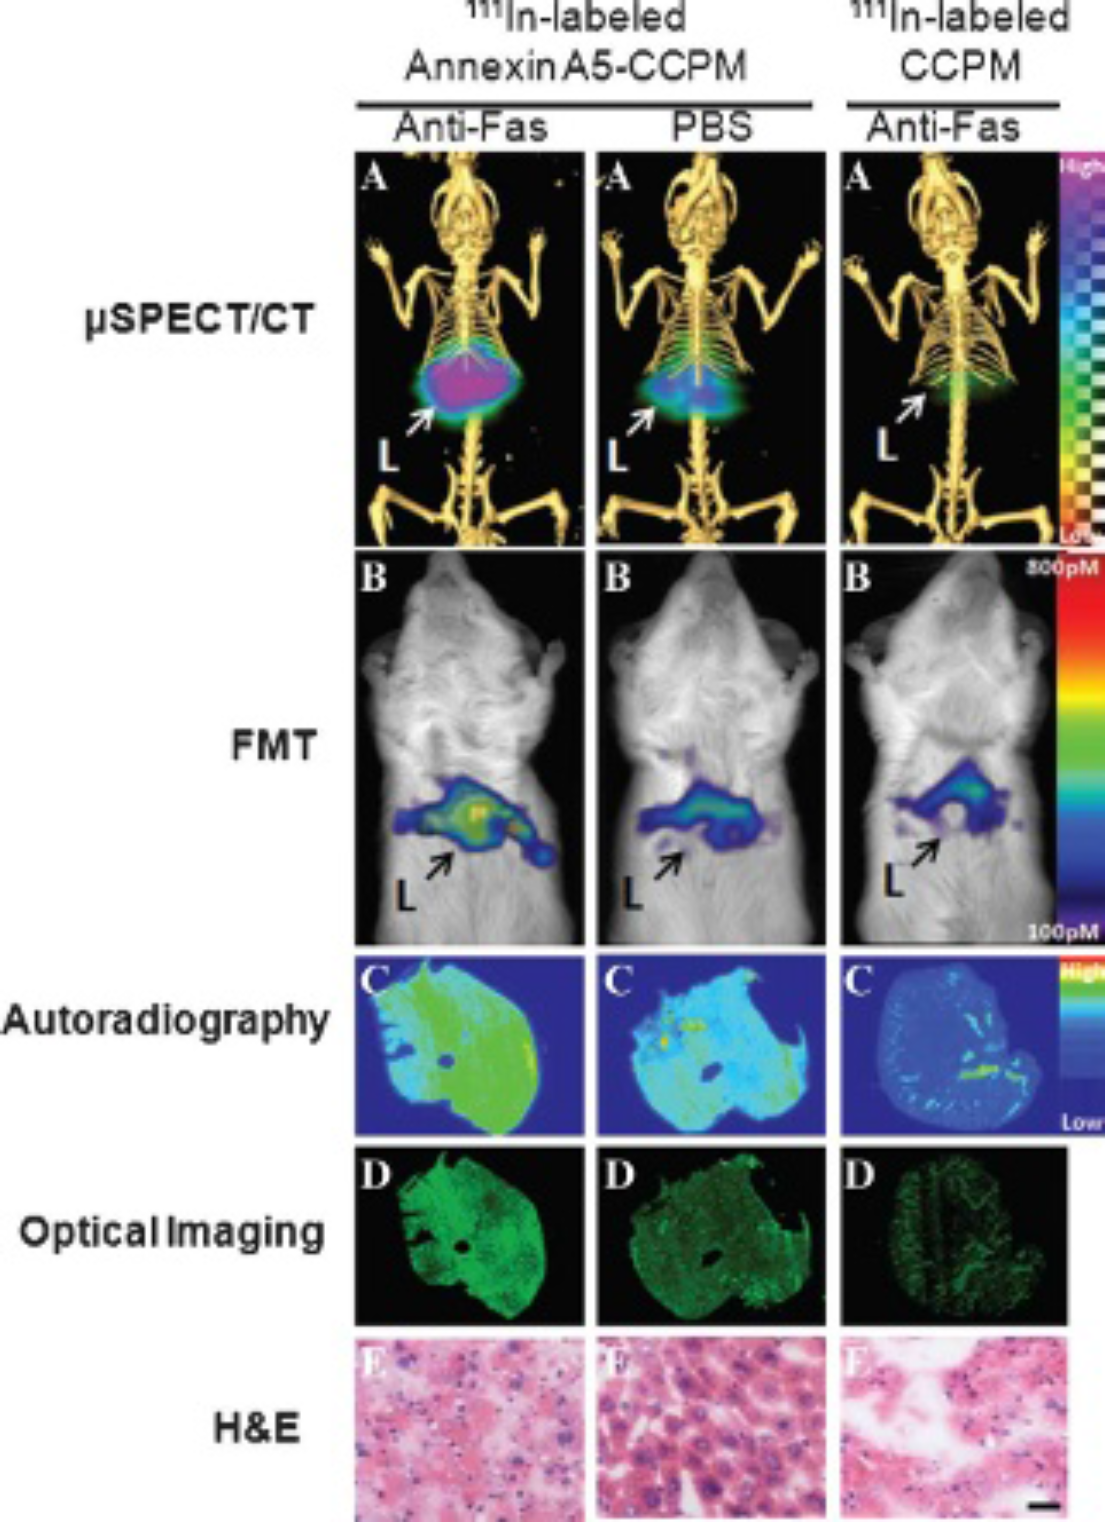
Dual μSPECT/CT and FMT of hepatic apoptosis with 111In-labeled annexin A5–CCPM. Two groups of mice were injected intravenously with the nanotracer 2 hours after treatment with intravenous anti-Fas antibody (10 μg/mouse; left) or phosphate-buffered saline (PBS) (middle). A third group of mice was injected intravenously with 111In-labeled CCPM 2 hours after anti-Fas antibody treatment (right). (A) Representative mSPECT/CT images. (B) Representative FMT images. (C) Representative autoradiographs of excised tumors. (D) Fluorescence images of the same slides used in the autoradiographic studies. (E) Hematoxylin-eosin (H&E) staining of the same slides used in the autoradiographic studies; bar = 20 μm. All images were acquired 3 hours after injection of 111In-labeled nanoparticles. Arrows indicate liver.
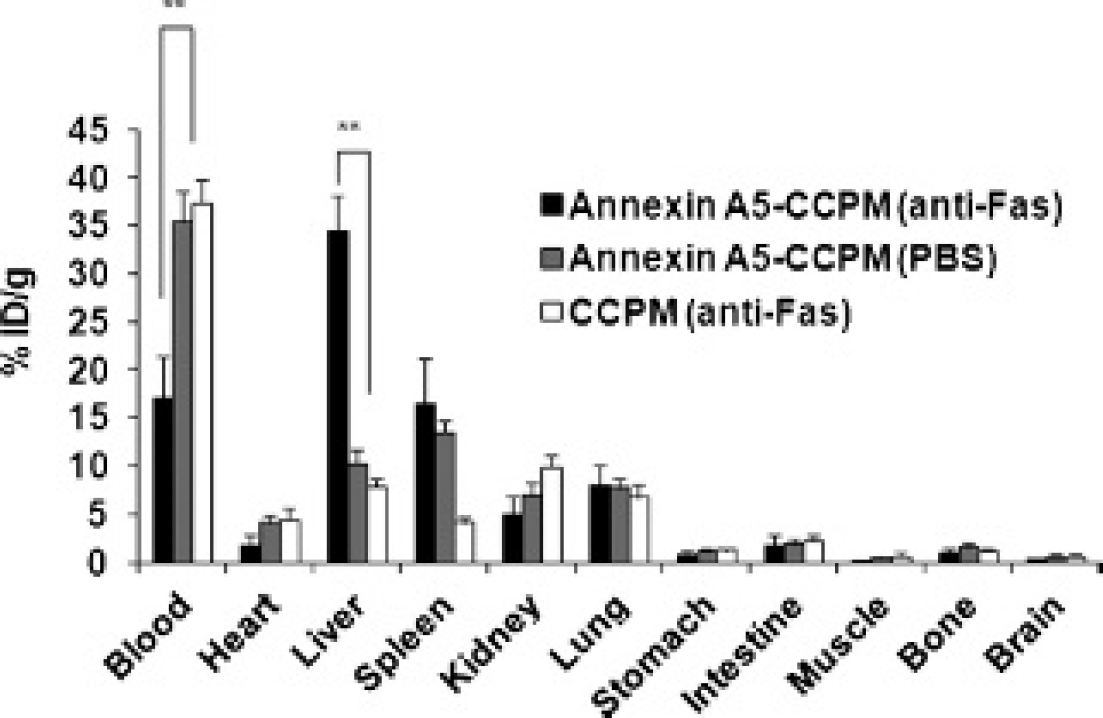
Biodistribution of 111In-labeled annexin A5–CCPM or CCPM in the hepatic apoptosis model 3 hours after administration. Two groups of mice were injected intravenously with the nanotracer 2 hours after intravenous treatment with anti-Fas antibody (black) or phosphate-buffered saline (PBS) (gray). A third group of mice was injected intravenously with 111In-labeled CCPM 2 hours after anti-Fas antibody treatment (white). Data were obtained using the radioactivity count method and plotted as %ID/g. All data are expressed as mean ± standard deviation (n = 7). **p < .001.
Inflammation Model
In Figure 6, A and B, abscesses induced in the right thigh were readily visualized by both nuclear and optical imaging after intravenous administration of 111In-labeled annexin A5–CCPM, whereas the tissue in the left (control) thigh showed lower uptake of the nanotracer. Biodistribution data showed a general concordance with the imaging results, with a mean uptake value of 4.9 %ID/g in the thigh abscess after injection of 111In-labeled annexin A5–CCPM, compared to the mean values of 0.6 %ID/g in the healthy thigh after injection of 111In-labeled annexin A5–CCPM and of 2.3 %ID/g in the thigh abscess after injection of 111In-labeled CCPM (Figure 7). Autoradiographic, fluorescence optical, and histologic images of muscle sections confirmed that 111In-labeled annexin A5–CCPM uptake was intensely focal and colocalized with the inflammatory areas, which displayed more infiltrated granulocytes and fewer monocytes adjacent to the abscess cavities than in normal tissue (Figure 6, C–E).

Dual μSPECT/CT and FMT of inflammation with 111In-labeled annexin A5–CCPM. The mice received an intravenous injection of 111In-labeled annexin A5–CCPM 24 hours after treatment with turpentine or phosphate-buffered saline (100 μL/mouse) by intramuscular injection. (A) Representative mSPECT/CT images. (B) Representative FMT images. (C) Representative autoradiographs of excised muscle. (D) Fluorescence images of the same slides used in the autoradiographic studies. (E) Hematoxylin-eosin (H&E) staining of the same slides used in the autoradiographic studies. All images were acquired 48 hours after injection of 111In-labeled annexin A5–CCPM.

Thigh uptake of111In-labeled annexin A5–CCPM and 111In-labeled CCPM in mice treated with turpentine or phosphate-buffered saline (PBS) 48 hours after administration of nanoparticles. Data were obtained using the radioactivity count method and plotted as %ID/g. All data are expressed as mean ± standard deviation (n = 5). **p < .001.
Discussion
For most molecular imaging agents, it is important that the agents are cleared from the blood and normal organs quickly so that good target to background can be achieved and imaging studies can be performed in a few hours after tracer injection. However, a different set of pharmacokinetic criteria may apply for imaging cell death. This is because cell death is generally a short dynamic process in which newly generated dying or dead cells are rapidly removed within hours. It is critical that cell death is visualized either at its peak or over the prolonged time period during which cell death responses might exist to maximize the detection sensitivity. Currently, 99mTc-labeled annexin A5 is widely used in the detection of cell death. Because annexin A5 has a short blood half-life of only a few minutes, it has been suggested that an imaging protocol using multiple separate injections of 99mTc-labeled annexin A5 and multiple radionuclide scans could be used to assess peak apoptotic activity. Such a protocol, however, may be difficult to implement in the clinic. In addition, it has been reported that annexin A5 can strongly bind to three PS molecules on the cell surface with a nanomolar affinity. 32 Thus, it is possible that the previous injection of annexin A5 may still tie up PS on the cell surface and thereby compromise the ability of the later dose to bind. We hypothesized that modulation of the pharmacokinetics of annexin A5 through the use of long-circulating nanoparticles would permit single injection of this tracer to monitor cell death process over a prolonged period of time, avoiding an imaging protocol with multiple injections. In addition, the introduction of CCPM nanoparticles to annexin A5 also improves the level of disease tissue uptake signal via prolonged circulation time. Our previous study has already demonstrated that 111In-labeled annexin A5–CCPM displays a significantly higher uptake than conventional 99mTc-HYNIC annexin A5 in EL4 lymphoma after chemotherapy. 27
In the past few years, several groups reported on the development of annexin A5–conjugated nanoparticles for the detection of cell death.22–24 Schellenberger and colleagues developed a PS-specific superparamagnetic iron oxide-based MRI contrast agent. 22 van Tilborg and colleagues developed an annexin A5–conjugated quantum dot that is encapsulated in a paramagnetic micelle to enable its use for both optical imaging and MRI. 23 These nanotracers showed advantages over conventional annexin A5 imaging agents. However, these nanoparticles were investigated only by in vitro study. It is necessary to perform a variety of animal studies to evaluate their potential application. Recently, van Tilborg and colleagues developed an annexin A5–functionalized bimodal micelle for MRI and fluorescence optical imaging of apoptosis. 24 This nanoparticle is capable of selectively imaging PS-expressing cells in atherosclerotic lesions of ApoE−/− mice. To date, all PS-targeting nanotracers reported previously are mainly designed for MRI modality. In this study, we developed a new class of annexin A5–conjugated nanotracer for both SPECT/CT and fluorescence imaging of cell death. Our nanotracer potentially permits whole-body visualization to locate disease site with abnormal cell death by SPECT, followed by fluorescence imaging. The ability to perform optical imaging should guide surgery and biopsies to precisely define and remove the treated disease tissues.
Cell death, such as apoptosis, autophagy, and necrosis, occurs during normal development and continues throughout the whole life cycle. Abnormal cell death can lead to many diseases, such as myocardial diseases, neurodegenerative diseases, autoimmune diseases, and rejection of transplanted organs (liver, heart, lung, kidney).1–4 Therefore, imaging cell death has broader applications other than the monitoring of drug-induced tumor apoptosis. Our data showed the feasibility of 111In-labeled annexin A5–CCPM for imaging cell death not only in two different tumor apoptosis models but also in hepatic apoptosis and inflammation models. Interestingly, increased uptake of the nanotracer was also noted in the liver, spleen, and bone of mice treated with cyclophosphamide (see Figure 3 and Figure S3, online version only), suggesting that chemotherapy may have induced toxic responses in these organs—a finding that is consistent with previous reports.15,27 Moreover, the mice treated with high-dose cyclophosphamide (170 mg/kg) in 9L gliosarcoma model showed a higher uptake of the nanotracer in damaged liver and spleen than the mice with low–dose cyclophosphamide (100 mg/kg) in 38C13 lymphoma model (see Figure 3 and Figure S3, online version only). Although apoptosis, autophagy, and necrosis seem to have different biochemical, morphologic, and physiologic characteristics, PS-based targeting agents can be broadly used to detect these cell death processes. Annexin A5–functionalized probes can bind to either externalized PS at the apoptotic or autophagic cell membrane or PS inside the necrotic cells due to the loss of cell membrane integrity. Thus, this annexin A5–functionalized nanotracer can be applied for detection of necrotic and autophagic cells as well. 7 In a hepatic apoptosis study, there is high radioactivity signal intensity in some necrotic areas (data not shown). In addition, expression of PS also occurs with nonlethal cell injury that does not necessarily lead to irreversible morphologic changes such as deoxyribonucleic acid (DNA) fragmentation.33,34 This information may be useful in some settings (eg, cancer) because early identification of externalized PS in injured cells may be helpful for defining tissues at risk for cell death, thereby permitting therapeutic interventions to either promote or hinder cell death.
Because inflammation is associated with a host of diseases, detection of inflammation is critical to the diagnosis and treatment of those diseases. The possibility of identifying inflammatory processes at an early stage may allow for disease prevention and early therapeutic intervention. Currently, a few radiotracers, including 18F-fluorodeoxyglucose (18F-FDG), 99mTc-labeled bisphosphonates, 99mTc- or 111In-labeled white blood cells, and radiolabeled protein (eg, IgG or albumin), are clinically used for visualizing inflammation. 35 These agents accumulate in the site of inflammation by means of two mechanisms. 35 One is specific uptake by inflammatory tissue as a result of increased inflammation-related cellular activities or the migration of specific cells associated with inflammation, as occurs with 18F-FDG and 99mTc-labeled bisphosphonates. The other is nonspecific accumulation in the inflammatory site because of enhanced vascular permeability, such as IgG and albumin. We hypothesize that it may be possible to take advantage of these two mechanisms to make imaging more sensitive and specific for inflammation. Radiolabeled annexin A5 derivatives have been investigated as imaging probes for in vivo detection of macrophages at the site of inflammation.20,36 In our study, turpentine-induced inflammatory response was clearly delineated with 111In-labeled annexin A5–CCPM, and the nanotracer displayed significantly higher uptake in inflammatory muscle than in healthy muscle (see Figure 6 and Figure 7). Increased uptake of the nanotracer at the inflammatory site may be attributed in part to retention of nanoparticles by a nonspecific mechanism, because 111In-labeled CCPM without annexin A5 also showed significantly higher uptake at the inflammatory site than at the PBS-treated site. Moreover, specific uptake mediated by annexin A5 was also implicated because 111In-labeled annexin A5–CCPM showed significantly higher uptake at the inflammatory site than 111In-labeled CCPM (see Figure 7).
Conclusion
Cell death was readily visualized with 111In-labeled annexin A5–CCPM using multimodality whole-body imaging in four different cell death models. Moreover, 111In-labeled annexin A5–CCPM permitted detection of dying or dead cells at the single cell level by optical imaging, thus providing confirmation of cell death. The complementary information acquired with multiple imaging techniques should be advantageous in assessing and validating early response to therapy.
Footnotes
Acknowledgments
We thank Zach Bohannan and Kathryn Carnes for editing the manuscript.
Financial disclosure of authors: This work was supported in part by National Institutes of Health grants (R01 CA119387 and RC2 GM092599) and the John S. Dunn Foundation. R.Z. is a recipient of the Harry S. & Isabel C. Cameron Foundation Fellowship. We also acknowledge the National Institutes of Health Cancer Center Support Grant CA016672 for support of MD Anderson's Small Animal Imaging Facility and High-Resolution Electron Microscopy Core Facility.
Financial disclosure of reviewers: None reported.