
Abstract
In vivo imaging of aminopeptidase N (APN/CD13) expression is crucial for the early detection of cancer. This study attempted to show that APN/CD13 expression can be imaged and quantified with novel Cerenkov luminescence tomography (CLT). Na131I with various activities was placed at different depths in a tissue-mimicking phantom, and various porcine tissues and luminescent images were acquired. The binding of 131I-NGR with human fibrosarcoma HT1080 and human colon cancer HT-29 cells was detected with Cerenkov luminescence imaging (CLI). Nude mice bearing HT-1080 tumors were imaged after injection with 131I-NGR using both planar and tomographic CLI methods. The penetration depth increased with ascending activity of Na131I. There was a robust linear correlation between the optical signal intensity and the HT1080 cell numbers (r2 = .9691), as well as the activity (r2 = .9860). The three-dimensional visualization CLT results clearly showed that 131I-NGR uptake in tumor tissues represented a high expression of the APN/CD13 receptor. CLT also allowed quantifying 131I-NGR uptake in tumor tissues showing an average activity of 0.1388 ± 4.6788E-6 MBq in tumor tissues. Our study indicated that 131I-NGR combined with CLT allowed us to image and quantify tumor-associated APN/CD13 expression noninvasively. The promising CLT technique could be potentially used for sensitively evaluating tumor angiogenesis in vivo.
IN 1971, FOLKMAN postulated that the growth and metastasis of tumors were determined by angiogenesis. 1 Tumors cannot grow beyond the size of 1 to 2 mm without the formation of neovasculature to provide oxygen and nutrients. 2 Aminopeptidase N (APN/CD13) is a Zn2+-dependent membrane-bound ectopeptidase that preferentially degrades proteins and peptides with an N-terminal neutral amino acid. 3 The transmembrane molecule CD13 is expressed on endothelial cells and has been demonstrated to be associated with cancer invasion, metastasis, and angiogenesis, indicating a suitable target for anticancer therapy. 3
In vivo imaging of APN/CD13 expression is crucial for the early detection of cancer. The asparagine-glycine-arginine (NGR)-containing peptide selected by phage display can specifically target tumor vasculature. 4 Recognizing the APN/CD13 receptor on the membrane of tumor cells, the peptide can be further internalized into the cytoplasm via the endosomal pathway. 4 Hence, NGR can serve as an ideal molecular probe for tumor imaging by being conjugated with fluorescent materials or a radionuclide.4,5 However, nuclear imaging is very expensive and has low throughput and low resolution. Fluorescence-mediated tomography (FMT) has the problem of inherent background noise and probe toxicity. Therefore, existing nuclear imaging and optical imaging methods are not optimal for imaging APN/CD13 expression.
Recently, Cerenkov radiation–based luminescence imaging (CLI) has emerged,6–18 which can image the radionuclide with high-energy particles with an optical imaging instrument. The novel technique can overcome the limitations of existing imaging methods. Cerenkov radiation is a well-known phenomenon in which visible and near-infrared photons are emitted when a charged and high-energy particle travels in a dielectric medium at a velocity faster than the speed of light. The emitted visible and near-infrared photons from the radionuclide can be detected using a highly sensitive charge-coupled device (CCD) camera. Recently, CLI has become a motivating topic.6–18 Robertson and colleagues first performed CLI on mice using positron-emitting radionuclide tracers. 6 Liu and colleagues successfully demonstrated that a variety of radionuclide-labeled probes can be used for CLI in small animals. 8
Currently, CLI is mainly used in two-dimensional (2D) imaging.6–15 Nevertheless, 2D planar imaging cannot provide three-dimensional (3D) biodistribution and quantification information of the radionuclide-labeled probe in living small animals. Li and colleagues presented 3D Cerenkov luminescence tomography (CLT) based on a homogeneous mouse model using 18F-fluorodeoxyglucose (18F-FDG). 16 However, the assumption of a homogeneous optical property background will lead to inaccurate source reconstruction.19,20 In our previous study, we performed in vivo 3D CLT based on a heterogeneous mouse model with an implanted Na131I radioactive source. 17 Our results showed that the reconstruction based on a heterogeneous mouse model was more accurate in localization than using the homogeneous one.
In the current study, we employed the CLT method to image and quantify APN/CD13 expression. It was necessary to acquire the Cerenkov optical signal of the mice bearing HT1080 tumors injected with 131I-NGR for the reconstruction of 131I-NGR uptake in the tumor tissues. Whether the Cerenkov luminescence signal could be detected by the CCD camera was influenced by many factors, such as the depth, affinity, and specificity of 131I-NGR and the variety of biologic tissues. Therefore, we first investigated the penetration of Cerenkov luminescence emitted from Na131I through ex vivo experiments using the tissue-mimicking phantom and various porcine tissues. We then labeled NGR peptide with 131I and measured a specific tumor-targeted 131I-NGR conjugate on an HT1080 fibrosarcoma and HT-29 colon cancer cell in the in vitro cell experiment. Next, we conducted in vitro CLI of 131I-NGR uptake in two cell lines. Finally, we performed CLT of APN/CD13 expression in mice bearing HT1080 tumors. The activity of 131I-NGR uptake in the tumor tissues was reconstructed based on the semiquantitative Cerenkov radiation spectral characteristic-based Cerenkov luminescent source reconstruction method.
Materials and Methods
Penetration of Luminescence Emitted from Na131I in the Tissue-Mimicking Phantoms
Cubic phantoms (n = 5) were used in the investigation of the penetration depth of CLI (Figure 1A). The tissue-mimicking phantoms were made from nylon, which simulated the mouse lungs measuring 32 mm in the lateral dimension. A small hole with a 1 mm diameter and a 12 mm depth from the top surface of each phantom was drilled to place the radioactive source (Figure 1B). The distance, d, between the center of the hole and the front surface of the phantom was 1, 4, 7, 10, and 13 mm, respectively. The refractory index for the phantom was 1.53. In the phantom experiment, radionuclide-labeled Na131I probes with various activities (n = 10) were injected at the bottom of the glass capillaries as the radioactive sources. The capillaries were made of glass. Each glass capillary was then placed into the hole of the phantoms, and luminescent images were acquired one by one. For each glass capillary, the experiment was performed more than three times. The dimensions of the glass capillaries were approximately 2 mm in diameter and 15 mm in height. The activities of Na131I were 0.0185, 0.037, 0.074, 0.185, 1.48, 2.96, 3.7, 11.1, 18.5, and 24.05 MBq, respectively. The height was approximately 3 mm.

Phantom experiment. Radionuclide-labeled probe Na131I with various activities was placed in the hole of the tissue-mimicking phantoms (n = 5), and luminescent images were acquired. The probe depth was 1, 4, 7, 10, and 13 mm, respectively. A and B are the photograph and schematic diagram of the tissue-mimicking cubic phantoms, respectively. We acquired optical signals emitted from the Na131I with the activity of 3.7 MBq at a depth of 7 mm and 24.05 MBq at a depth of 10 mm (C). The approximate minimal activity exponentially increased with an increase in Na131I depth (D). Optical intensity decreased with increasing optical density (y = 3.3675E6/1.9447x, r2 = .9630) (E).
Furthermore, we investigated the relationship between optical intensity and optical density using the cubic phantoms (n = 6). The phantoms were made from nylon, had the same refractive index of 1.53, and measured 32 mm in the lateral dimension (see Figure 1A). The distance, d, between the center of the hole and the front surface of the phantom was 1, 2, 4, 5, 7, and 8 mm, respectively. Na131I with the activity of 7.4 MBq was injected in the bottom of a glass capillary and then placed into the hole of the phantoms, and luminescent images were acquired one by one.
Penetration of Luminescence Emitted from Na131I in Various Porcine Tissues
Considering that the phantoms were not real biologic tissues, we further investigated the penetration depth of CLI using porcine tissues, including kidneys, fat, heart, and muscle (Figure 2A). The just-butchered porcine tissues were frozen at −20°C and then cut into slices of various thicknesses using a microtome. The dimensions of the slices were approximately 10 mm in width and 70 mm in length. The thicknesses of the porcine tissues were from 1 to 8 mm, with a 1 mm interval. The linear radioactive sources were made of glass capillaries (n = 4) filled with Na131I. The dimensions of the glass capillaries were approximately 1 mm in diameter and 50 mm in length. The activities of Na131I were 0.4625, 0.925, 1.85, and 3.70 MBq, respectively. The volume of Na131I was 50 μL. The capillaries were placed under the porcine tissues of various thicknesses, including 1, 2, 3, 4, 5, 6, 7, and 8 mm, and then luminescent images were acquired. The experiment was conducted three times.
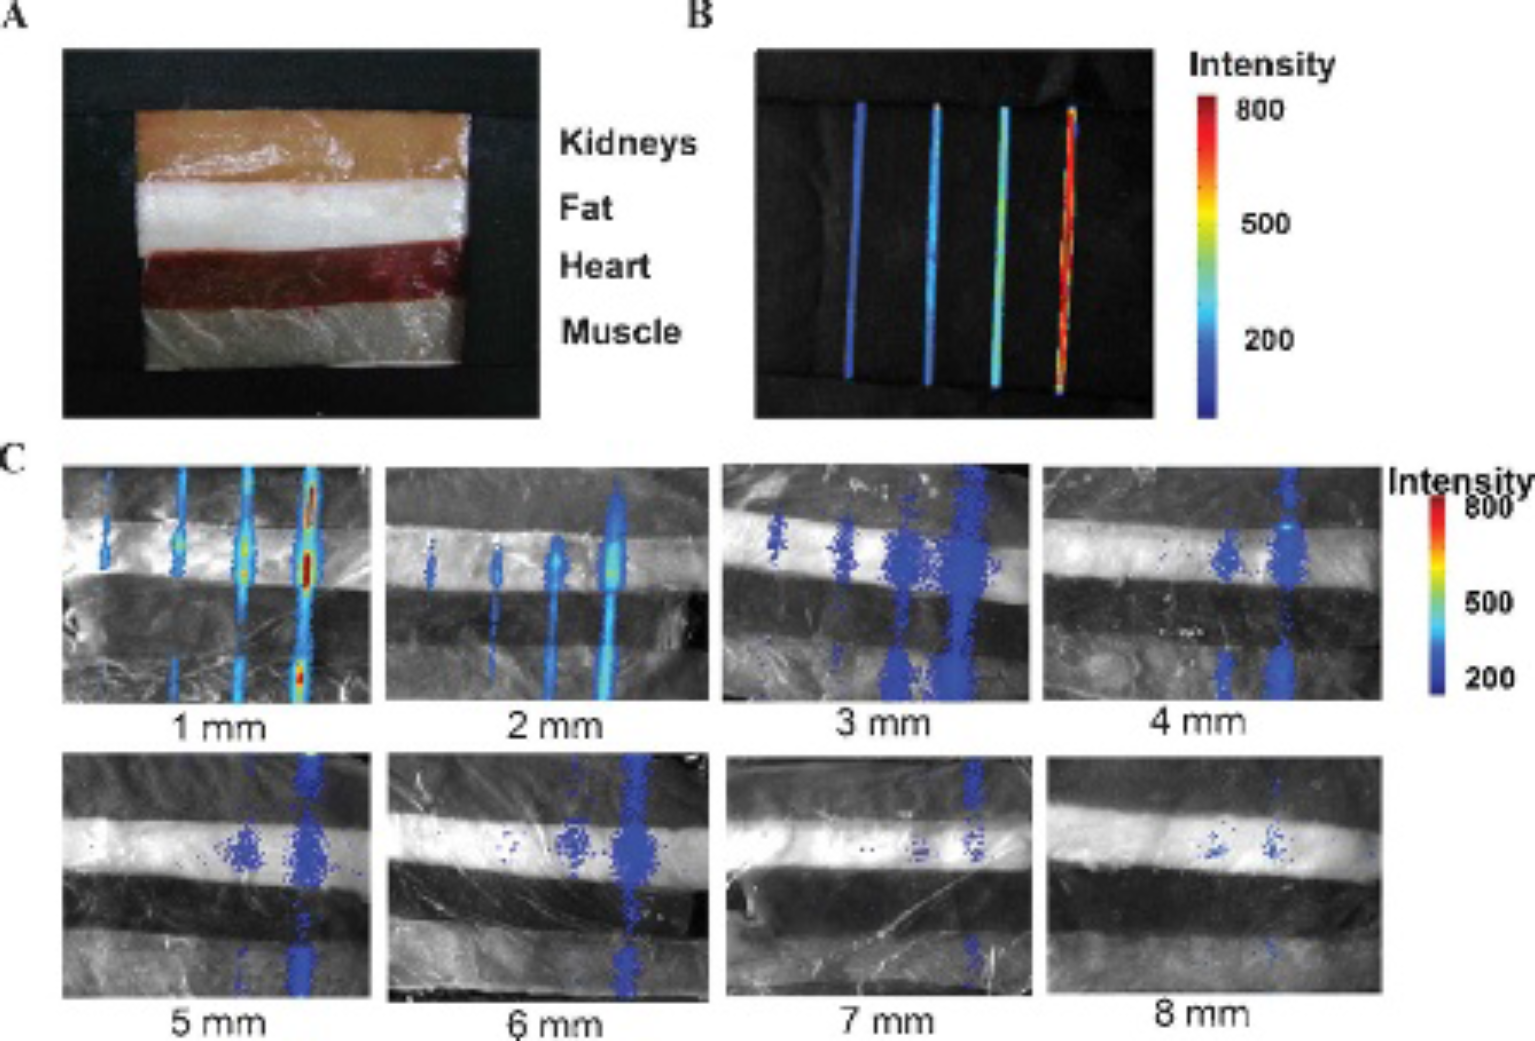
Penetration depth experiment with porcine tissues. The linear radioactive sources were made of glass capillaries (n = 4) filled with Na131I. The activities of Na131I were 0.4625, 0. 925, 1.85, and 3.70 MBq, respectively. They were put in position at different depths in the porcine tissues, and luminescent images were acquired. A, The porcine tissues, including kidneys, fat, heart, and muscle. B, The linear radioactive sources Na131I (n = 4) were acquired for the luminescent images. C, The linear radioactive sources of Na131I (n = 4) at different depths in the porcine tissues acquired for the luminescent images. The depths of the linear radioactive sources were 1, 2, 3, 4, 5, 6, 7, and 8 mm, respectively.
131I Radiolabeling of NGR
NGR-containing peptide [cyclo-(Cys-Asn-Gly-Arg-Cys) Gly-Gly-Tyr] was purchased from the Jier Biochemical Company (Shanghai, China). All chemicals were used as purchased without further purification. Peptides were dissolved in a phosphate-buffered saline (PBS) buffer (0.1 N, pH 7.4) and frozen at −20°C. NGR peptide was labeled with 131I via the iodogen method. Briefly, 37 MBq of 131I (Beijing Atom High Tech, Beijing, China), 20 μg of NGR peptide, and 100 μL of 0.2 M phosphate buffer (pH 7.4) were added to the vial coated with 50 μg Iodogen (Sigma-Aldrich, St. Louis, MO). After reacting for 7 to 10 minutes at room temperature, the labeling yield of 131I-NGR was measured by instant thin-layer chromatography (ethanol:water:ammonia water = 2:1:5 as the mobile phase) on a radio-thin-layer mini scanner (Bioscan, Washington, DC). The stability of 131I-NGR was studied at room temperature for 4, 8, 12, and 24 hours.
Cell Culture
Human fibrosarcoma HT1080 and human colon cancer HT-29 cells were cultured in high-glucose Dulbecco's Modified Eagle's Medium (DMEM). Cells were grown routinely in a monolayer culture at 37°C in a 5% CO2 humidified air atmosphere. APN/CD13-specific antibody H300 for immunofluorescence was from Santa Cruz Biotechnology (Santa Cruz, CA).
Immunofluorescence
To investigate cellular expression of the CD13 receptor, HT1080 and HT-29 cells were plated into 24-well plates at a density of 50,000 cells/well. Cells were fixed in 4% (m/v) paraformaldehyde for 10 minutes after overnight incubation at 37°C. Cells were then washed with PBS saline, blocked in normal goat serum (1%), and then incubated with an anti-CD13 polyclonal antibody H300 (Santa Cruz Biotechnology) overnight at 4°C. Fluorescein isothiocyanate goat antirabbit IgG (Invitrogen, Carlsbad, CA) was used as the secondary antibody. Images were acquired with an Olympus IX71 microscope (Olympus, Tokyo, Japan).
131I-NGR Uptake in HT1080 Cells and HT-29 Cells
Approximately 5 × 10⁶ CD13-positive expression HT1080 cells and CD13-negative expression HT-29 cells were seeded in a 24-well plate. After 12 hours, the culture medium was combined with 131I-NGR with the activity of 0.74, 1.85, 3.70, 5.55, 7.4 MBq. After incubation for 1 hour, the culture medium was poured, the 24-well plate was washed three times with PBS, and the luminescent image was acquired.
Approximately 5 × 10⁶, 2.5 × 10⁶, 1.25 × 10⁶, 6.25 × 10⁵, and 3 × 10⁵ CD13-positive expression HT1080 cells and CD13-negative expression HT-29 cells were seeded in a 24-well plate. After 12 hours, the culture medium was combined with 131I-NGR with the activity of 7.4 MBq. After incubation for 1 hour at 37°C in a 5% CO2 humidified air atmosphere, the culture medium was poured, the 24-well plate was washed three times with PBS, and the luminescent image was acquired. All of the experiments were performed three times.
Tumor Xenografts
All animal studies were approved by the Fourth Military Medical University (FMMU)-approved animal protocol. Female athymic nude mice (n = 3) were obtained from the Department of Experimental Animals (FMMU, Shaanxi, China). At 4 to 6 weeks of age, 5 × 10⁶ HT1080 cells were injected subcutaneously in the right front flank of each mouse. When tumors reached 8 to 10 mm in diameter, the HT1080 tumor-bearing mice were subjected to in vivo imaging studies.
CLI and CLT
Na131I with various activities at different depths in a tissue-mimicking phantom and various porcine tissues was acquired for the luminescent images. Both HT1080 cells and HT-29 cells combined with Na131I with various activities and the two cell lines with different numbers combined with Na131I were imaged with planar CLI. The mice bearing HT1080 tumors were acquired for luminescent images 8 hours after the intravenous tail injection with 22.2 MBq of 131I-NGR. All of the luminescent images were acquired using the dual-modality ZKKS-Direct 3D molecular imaging system (jointly developed by Guangzhou Zhongke Kaisheng Medical Technology CO., Ltd, Xidian University, and Institute of Automation, Chinese Academy of Sciences) with a binning value of 4, integration time of 5 minutes, and aperture number of fnum = 2.8. For acquiring the biologic tissue structure, the computed tomographic (CT) images were acquired after optical imaging using the following imaging parameters: 50 kV, 1,000 μA, 480 frames, and a 5-minute scan.
The steady-state diffusion equation (DE) and Robin boundary condition can be used for describing the propagation of Cerenkov photons in biologic tissues.21–23 Based on DE, a semiquantitative Cerenkov radiation spectral characteristic-based Cerenkov luminescent source reconstruction method was employed in this study to recover the 131I-NGR distribution in living mice. 24
In the reconstruction method, data in the entire spectra of the Cerenkov luminescent signals were used in the reconstruction of the biodistribution of the Cerenkov light source. The optical parameters of the biologic tissues over the entire spectrum were estimated based on the spectral characteristics of the Cerenkov light source and could be calculated as follows:

where
Based on DE, an adaptive hp strategy was used in this study to recover the Cerenkov light source distribution. 25 Based on this method, the relationship between the Cerenkov light source and surface flux density can be established as follows:

where
It is difficult to solve equation 3 directly because of the ill-posed nature of the internal source reconstruction. We can employ the classic Tikhonov regularization method to solve equation 3. The following optimization problem is defined to determine the radionuclide tracer distribution:

where Cinf and Csup are the lower and upper bounds of the Cerenkov light source power density and λj represents the regularization parameter. L 2 (π) denotes the weight matrix and satisfies ‖V‖ L 2(π) = VTL2(π)V. The minimization problem is solved by use of a modified Newton method with an active set strategy. 26
To quantify 131I-NGR uptake in vivo in living mice, the CCD camera was calibrated using an integrating sphere 12 inches in diameter (USS-1200V-LL Low-Light Uniform Source, Labsphere, North Sutton, NH). The calibrated method is described in the literature. 27 Our previous study suggested that there was a linear relationship between the reconstructed power and the activity of the radionuclide-labeled probe (y = 4.56574E–5*x). Therefore, the 3D biodistribution and activity of the radionuclide labeled probe in living mice can be reconstructed.
Results
Penetration Depth Increased with Increasing Activity of Na131I in the Tissue-Mimicking Phantom
For Na131I with the activity of 0.037 to 0.074 MBq, the penetration depth was approximately 1 mm; for 0.185 to 2.96 MBq, it was 4 mm; for 3.7 to 18.5 MBq, it was 7 mm; and for 24.05 MBq, it was 10 mm. The data suggested that the penetration depth increased with increasing activity of Na131I. The luminescent images for Na131I with the activity of 3.7 MBq at a depth of 7 mm and 24.05 MBq at a depth of 10 mm are shown in Figure 1C. Additionally, we found that 0.037 MBq was approximately the minimal activity that could be detected by CLI when the depth of Na131I was 1 mm; at 0.185 MBq, it was 4 mm; at 3.7 MBq, it was 7 mm; and at 24.05 MBq, it was 10 mm. The approximate minimal activity exponentially increased with an increase in Na131I depth (Figure 1D). The relationship between the optical density and the optical intensity is shown in Figure 1E. The results showed that the optical intensity decreased with increasing optical density (y = 3.3675E6/1.9447x, r 2 = .9630) at the same refractive index.
Penetration Depth of Na131I is Different in Various Porcine Tissues
The linear radioactive sources of Na131I (n = 4) were acquired for the luminescent images (Figure 2B). Optical signal intensity increased with increasing activity, which was consistent with our previous study. 17 Na131I at different depths in various porcine tissues were acquired for the luminescent images (Figure 2C). We observed that the optical signal intensity decreased with an increase in Na131I depth. Additionally, the penetration depth for Na131I with more activity was greater than that with much less activity. For 0.037 MBq/μL Na131I, the penetration depth in muscle was 4 mm; in fat, it was 6 mm; in kidney, it was 1 mm; and in the heart, it was 3 mm. The data suggested that the penetration depth was different in various porcine tissues. Preliminary experimental results indicated that optical signals for Na131I with a concentration of 0.074 MBq/mL at a depth of 6 mm could be detected by CLI.
Characterization of 131I-NGR
The purity of the synthesized NGR peptide was more than 95%. The NGR peptide was labeled with 131I by iodogen with a labeling yield over 95%. 131I-NGR is stable, with its purity remaining 85% at room temperature in 24 hours.
Expression of CD13 in HT1080 and HT-29 Cells
To determine the cellular origin of the APN/CD13 receptor and its activity in HT1080 and HT-29 cells, the cell lines were analyzed for CD13 protein expression via immunofluorescence. Immunofluorescence on tumor tissue slices with CD13 antibody H300 exhibited membranous APN/CD13 antigen expression in HT1080 cells (Figure 3A), and only background staining was present in HT-29 xenografts (Figure 3B).

A, HT1080 cells producing high APN/CD13 levels revealed strong cellular fluorescence. B, HT-29 cells, which lack CD13 expression, did not bind the targeted fluorochrome (objective magnification X40).
Robust Linear Correlation between the Cerenkov Optical Signal Intensity versus Activity and the HT1080 Cell Numbers
Approximately 5 × 10⁶ CD13-positive expression HT1080 cells and 5 × 10⁶ CD13-negative expression HT-29 cells were combined with 131I-NGR with various activities and were acquired for luminescent images (Figure 4A). Optical signals were observed in HT1080 cells, and there was almost no signal in HT-29 cells. The data showed that there was a target for the combination of CD13 expression in HT1080 cells and NGR. Moreover, the intensity of the optical signal emitted from HT1080 cells increased linearly with the increasing activity of 131I-NGR (y = 57.8389 + 1.5021x, r 2 = .9860) (Figure 4B).

In vitro CLI of 131I-NGR uptake in HT1080 cells and HT-29 cells. A, The luminescent images of 5 × 10⁶ CD13-positive expression HT1080 cells and 5 × 10⁶ CD13-negative expression HT-29 cells combined with 131I-NGR with various activities are shown. B, The intensity of the optical signal emitted from HT-1080 cells increased with increasing activity of 131I-NGR. C, The acquired luminescent images of HT1080 cells and HT-29 cells with different cell numbers combined with 131I-NGR with the activity of 7.40 MBq. D, There was a linear correlation between the signal intensity and the cell numbers.
HT1080 cells and HT-29 cells with different cell numbers were combined with 131I-NGR with the activity of 7.4 MBq, and luminescent images were acquired (Figure 4C). Optical signals were observed in HT1080 cells, and almost no optical signal was detected in HT-29 cells. Furthermore, there was a linear correlation between the signal intensity and the cell numbers (y = 61.4703 + 1.1111E–6*x, r 2 −.9691) (Figure 4D).
CLT of APN/CD13 Expression in Mice Bearing HT1080 Tumors
Figure 5A is the photograph of the mouse bearing HT1080 tumors. The Cerenkov luminescent image of the mouse bearing HT1080 tumors was acquired 8 hours after intravenous tail injection with 131I-NGR with the activity of 22.2 MBq, which is in pseudocolor superimposed on the corresponding photograph of the mouse (Figure 5B). Luminescence was observed in the right front flanks of the mouse bearing the HT1080 tumor, indicating high expression of the APN/CD13 receptor. A few optical signals were detected in the mouse abdomen. The CT slices showed the position of the tumor obtained at z = 15.66 mm (Figure 5C) and y = 19.91 mm (Figure 5D). The green arrow represents the position of the tumor.

A, Photograph of the mouse bearing HT1080 tumors. B, Cerenkov luminescent image of the mouse bearing HT1080 tumors 8 hours after intravenous tail injection with 131I-NGR with the activity of 22.2 MBq. C, The horizontal view of the computed tomographic (CT) results at z = 15.66 mm. D, The coronal view of the CT results at y = 19.91 mm. E, The 3D distribution of 131I-NGR in the mouse bearing HT1080 tumors. The reconstructed source representing the 131I-NGR uptake in the tumor tissues. F, The 3D reconstructed CT images of the mouse, which show the position of the CT slice at z = 15.66 mm. The green arrow represents the position of the tumor.
3D distribution of 131I-NGR in the mouse tumor tissues was reconstructed using the previously described Cerenkov light source reconstruction method based on the 2D luminescent image. The 3D rendering from CLT demonstrated the 3D biodistribution and quantification of the 131I-NGR in the living mouse, and the reconstructed source represented the 131I-NGR uptake in the tumor tissues (Figure 5E). The 3D reconstructed CT images of the mouse showed us the position of the CT slice at z = 15.66 mm (Figure 5F). The reconstructed results clearly showed the location of the 131I-NGR distributed in the right front flanks. The 131I-NGR uptake in the tumor tissues represented high expression of the APN/CD13 receptor. The activity of 131I-NGR uptake in the tumor of three nude mice was calculated as approximately 0.138827, 0.138819, and 0.138827 MBq, respectively. The average activity of 131I-NGR uptake in the tumor was 0.1388 ± 4.6788E–6 MBq. Experimental data demonstrated the capacity of CLT for APN/CD13 expression in mice bearing HT1080 tumors.
Discussion
In vivo imaging of APN/CD13 expression is crucial for the early detection of cancer. To the best of our knowledge, we imaged the abnormal expression of APN/CD13 in tumorigenesis with the novel CLT for the first time. The reconstructed results of 131I-NGR uptake in the tumor tissues demonstrated the ability of CLT to image and quantify the expression of the APN/CD13 receptor.
CLI results of the in vitro cell experiment showed that optical signals were observed clearly in HT1080 cells cultured with 131I-NGR. However, little signal was observed in HT-29 cells, which was coincident with the results of immunofluorescence. Our study indicated that NGR can specifically bind with CD13 expressed in HT1080. Therefore, CLI can be used for the imaging of 131I-NGR uptake in HT1080 cells. Moreover, the emitted optical signal linearly increased with increasing cell number, which suggested the potential of the CLT technique to accurately image APN/CD13 expression.
The experimental reconstruction of an implantation mouse model with a Na131I radioactive source validated the performance of the semiquantitative hybrid spectral reconstruction method. 24 We employed the reconstruction method to reconstruct the 3D biodistribution of 131I-NGR in living mice. The results indicated that 131I-NGR uptake in the tumor tissues represented high expression of the APN/CD13 receptor. The average activity of 131I-NGR uptake in the tumor tissues was reconstructed as 0.1388 ± 4.6788E-6 MBq. It was notable that unlike with 2D planar CLI, we could obtain the location and quantification information of a radionuclide-labeled probe using the 3D CLT technique, which is significant for the diagnosis and treatment of cancer.
The main disadvantage of CLI is limited penetration. We investigated the penetration of Cerenkov luminescence emitted from 131I using the tissue-mimicking phantom and various porcine tissues. Our preliminary data indicated that the penetration depth increased with increasing activity of Na131I, and Cerenkov luminescence could penetrate the shallow porcine tissue. The maximal activity used in the experiment was 24.05 MBq. The activity of the radiopharmaceutical used in clinics is usually 12 mCi. Therefore, it was possible for CLI/CLT to be applied in the imaging of shallow tissues in clinics.
CLT provides a new avenue for the imaging of APN/CD13 expression. Compared to nuclear imaging and FMT, CLT has many advantages, such as being an inexpensive optical instrument and having high throughput, high resolution, and no problems with probe toxicity. Moreover, based on Cerenkov radiation, the radionuclide-labeled probe can also be imaged via the optical imaging system. The inherited multimodality imaging of combining optical and nuclear imaging can easily be achieved with a single radioisotope or radionuclide-labeled probe. Thus, CLT has the potential for imaging APN/CD13 expression and potentially promotes the application of a novel optical imaging technique in the early detection of cancer. Additionally, this promising technique could be potentially used for evaluating tumor response to chemotherapy or radiotherapy.
Conclusion
In this study, we imaged the abnormal expression of APN/CD13 in mice bearing HT1080 tumors with novel CLT. The reconstructed results of 131I-NGR uptake in the tumor tissues demonstrated the ability of CLT to image and quantify the expression of the APN/CD13 receptor. Our study indicated that this promising technique could potentially be used for sensitively evaluating tumor angiogenesis in vivo.
Footnotes
Acknowledgments
We would like to thank Y. Zhou, S. Zhou, and M. Ning for their technical assistance in performing optical imaging and X. Lin and L. Yang for their technical support on CT imaging. We would like also to acknowledge H. Yi and M. Liu for their help in conducting this research.
Financial disclosure of authors: This work was supported by the Program of the National Basic Research and Development Program of China (973) under grant no. 2011CB707702; the National Natural Science Foundation of China under grant nos. 81090272, 81101083, 81101084, 81101100, 81000632, 30900334, and 30970847; the Shaanxi Provincial Natural Science Foundation Research Project under grant no. 2009JQ8018; and the Fundamental Research Funds for the Central Universities.
Financial disclosure of reviewers: None reported.