
Abstract
The use of multimodal imaging as a tool to assess the in vivo pharmacokinetics and biodistribution of nanocarriers is important in understanding the nature of their in vivo transport. The current study reports the development of a nano-sized liposomal computed tomographic (CT)/optical imaging probe carrying iohexol and Cy5.5 and its use in micro-CT and optical imaging to quantitatively assess the whole-body (macroscopic), intratumoral, and microscopic distribution over a period of 8 days. These multimodal liposomes have a vascular half-life of 30.3 ± 8.9 hours in mice bearing subcutaneous H520 non-small cell lung cancer tumors, with the maximum liposome accumulation in tumor achieved 48 hours postinjection. The in vivo liposome distribution and stability were quantitatively assessed using both micro-CT and fluorescence molecular tomography. The combination of CT and optical imaging enables visualization of the liposomes at the whole-body, tumor, and cellular scales with high sensitivity. Such noninvasive tracking of therapeutic vehicles at the macro- and microscale is important for informed and rational development of novel nanocarrier systems.
IMAGE-BASED ASSESSMENT of the in vivo pathway and fate of nanocarriers has received widespread interest.1–5 This has been made possible by labeling nanocarriers with one or more contrast agents or probes that enable the noninvasive visualization and measurement of the spatiotemporal distribution of the nanocarriers in vivo using single or multiple imaging modalities.6–8 The strategic combination of multiple imaging modalities is powerful as it allows for macroscopic (whole-body), intraorgan, and microscopic monitoring of the nanocarrier distribution. For example, a high-resolution anatomic imaging modality such as computed tomography (CT) combined with a high–sensitivity, microscopy-capable imaging modality such as optical imaging would provide complementary, quantitative, multiscalar information of the nanocarrier distribution, thereby offering important characterization of the structural, functional, and molecular processes in vivo. In addition to microscopic imaging, the development of fluorescence molecular tomography (FMT) has enabled optical imaging to quantitatively assess the three-dimensional (3D) macrodistribution of fluorophores in small animals and tissues with an imaging depth of several centimeters.9–11 Hybrid imaging systems using magnetic resonance or CT in combination with FMT have also been proposed.12–16 Owing to intrinsic fluorescent properties and photon scattering, reconstructed FMT images are typically limited to spatial resolutions on the order of 1 mm for objects at depth.
Liposomes are the most established nanocarriers and can easily be labeled or loaded with probes, contrast agents, or radionuclides to support in vivo imaging.6,17–22 Labeled liposomes have been used to self-report on their fate in vivo. Image-based assessment of the distribution of drug delivery systems can provide information that is otherwise unavailable using conventional techniques.23,24 Such labeled delivery systems or formulations may be employed in the design and implementation of personalized medicine.
Previous studies in our laboratory have employed CT to quantitatively assess the distribution of liposomes containing the iodinated agent iohexol over prolonged periods of time in mouse and rabbit models.25,26 The current study extends the use of the liposome formulation to support optical imaging with a relatively low fluorophore burden (Figure 1). In this study, a novel CT/optical liposome formulation was developed and its in vivo stability was assessed using CT and FMT imaging methods. Finally, the feasibility of in vivo microscopic imaging was demonstrated using a confocal microscopy probe.
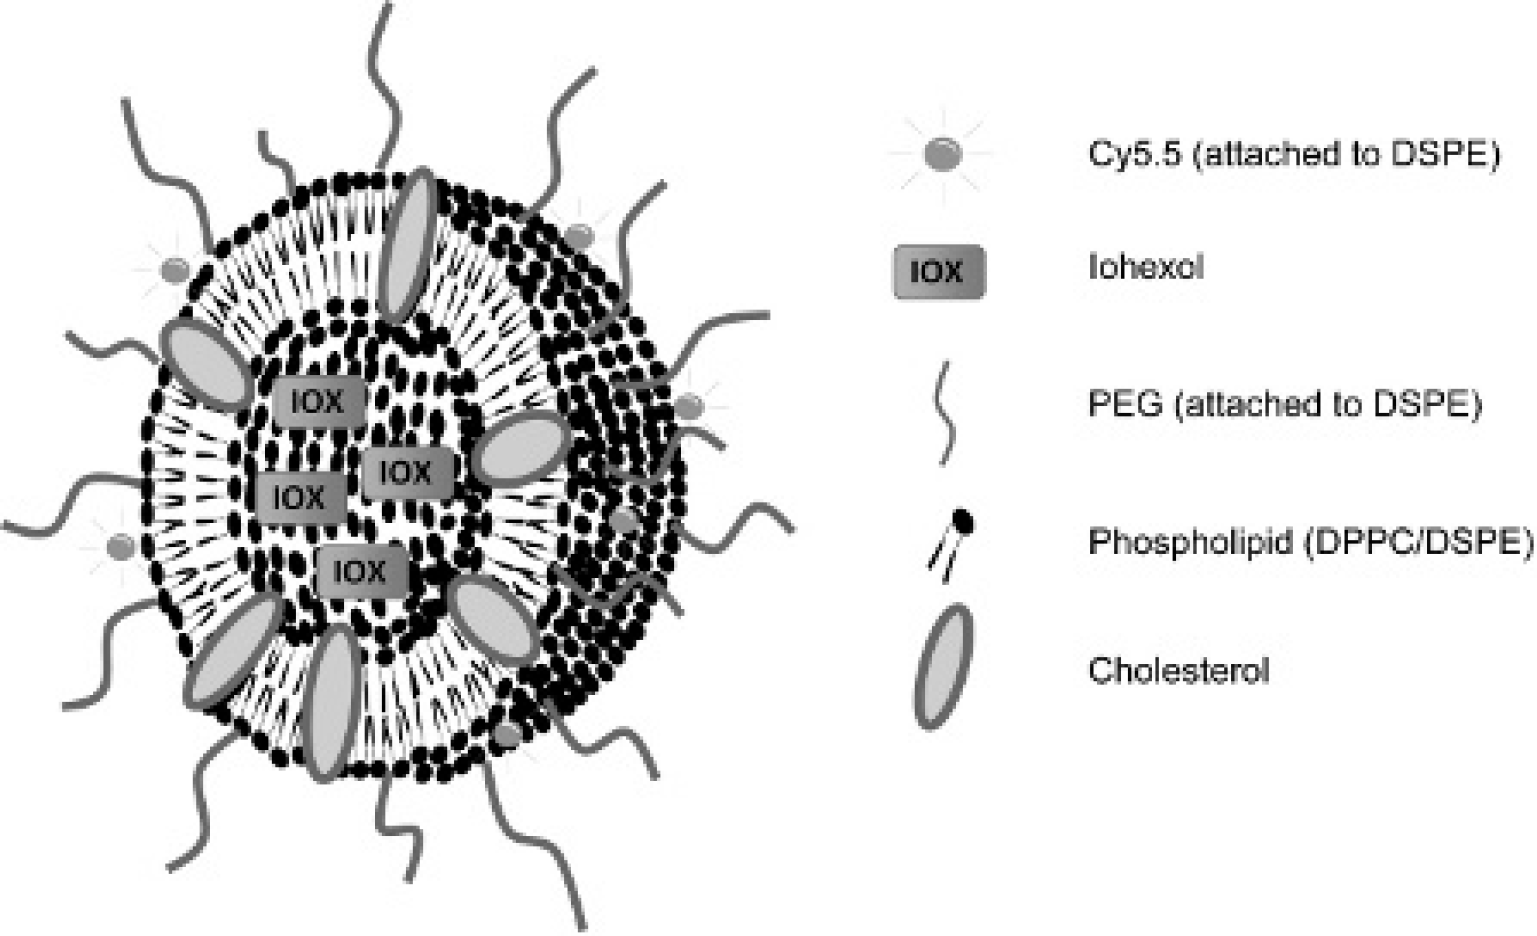
Schematic of the CT/optical liposome-based contrast agent (not drawn to scale). The average hydrodynamic diameter of the liposomes was found to be 86 ± 5 nm by dynamic light scattering.
Materials and Methods
Anhydrous dimethyl sulfoxide (DMSO), anhydrous chloroform, triethylamine (TEA), C8 reverse-phase silica gel, and bovine serum albumin (BSA) were purchased from Sigma-Aldrich Canada (Oakville, ON). 1,2-Dipalmitoyl-sn-glycero-3-phosphocholine (DPPC; molecular weight [MW] 734 Da) and 1,2-distearoyl-sn-glycero-3-phosphoethanolamine-N-poly(ethylene glycol) 2000 (DSPE-PEG2000; MW 2,774 Da) were purchased from Genzyme Pharmaceuticals (Cambridge, MA). 1,2-Distearoyl-sn-glycero-3-phosphoethanolamine (DSPE; MW 748.09 Da) and cholesterol (CH; MW 387 Da) were obtained from Avanti Polar Lipids Inc. (Alabaster, AL). Omnipaque, a commercially available iodinated CT contrast agent that contains iohexol (MW 821.14 Da) at 300 mg/mL iodine, was purchased from GE Healthcare (Piscataway, NJ). Cy5.5 mono-NHS ester (Cy5.5-NHS, molar extinction coefficient 250,000 M−1cm−1, MW 1128.4 Da) was obtained from Amersham Sciences (Buckinghamshire, UK). NCI-H520 human non-small cell lung cancer cells and RPMI 1640 medium (2 mM L-glutamine, 10 mM 4-(2-hydroxyethyl)-1-piperazineethanesulfonic acid [HEPES], 1 mM sodium pyruvate) were supplied by American Type Culture Collection (Manassas, VA). Female nude athymic CD-1 mice were provided by Charles River (Wilmington, DE). HEPES was purchased from BioShop Canada (Burlington, ON).
Synthesis and Characterization of Cy5.5-DSPE
The synthesis of Cy5.5-DSPE was modified from previously published studies.27,28 In this method, DSPE dissolved in anhydrous chloroform mixed with TEA was added to Cy5.5-NHS dissolved in anhydrous DMSO at a DSPE:Cy5.5 molar ratio of 1:1. The solution was stirred at 22°C for 18 hours with protection from light and was then dried and redissolved in methanol. Unreacted reagents were removed by reverse-phase chromatography using a column packed with C8 reverse-phase silica gel. Deionized water, methanol, and methanol/chloroform (80/20, % v/v) were used to elute Cy5.5, Cy5.5-DSPE, and DSPE, respectively. The Cy5.5-DSPE product was confirmed using electrospray mass spectroscopy (QStarXL mass spectrometer with electrospray [ESI] source, MDS Sciex, Concord, ON) with methanol/H2O (50/50, % v/v) as solvent. The purity of Cy5.5-DSPE was determined by ultraperformance liquid chromatography (UPLC) with a 10 cm BEH C18 column (Waters, Milford, MA). A constant flow rate of 0.1 mL/min was employed with a gradient mobile phase of 50/50 (% v/v) 0.05 M triethylammonium acetate (TEAA) buffer (pH 7.0)/methanol to 100% methanol in 6 minutes. The yield of Cy5.5-DSPE was measured by ultraviolet (UV) absorbance at a wavelength of 674 nm using a Cary 50 UV-visible spectrophotometer (Varian, Palo Alto, CA).
Liposome Preparation
The method used for liposome preparation was adapted from a previously published report. 6 Briefly, lipid components for the CT/optical liposome formulation (ie, DPPC, CH, DSPE-PEG2000, and Cy5.5-DSPE) were dissolved in anhydrous ethanol at 70°C at a molar ratio of 54.98:40:5:0.02 DPPC:CH:DSPE-PEG2000:Cy5.5-DSPE. Omnipaque (300 mg/mL iodine) was added to the solution with a lipid concentration of 100 mM following ethanol removal. The solution was kept at 70°C for 4 hours with intermittent vortexing. Unilamellar vesicles were formed via extrusion at 70°C using a 10 mL Lipex Extruder (Northern Lipids Inc, Vancouver, BC) with five passages through two stacked 200 nm pore size Track-Etch polycarbonate membranes (Whatman Inc., Clifton, NJ) followed by 10 passages through two stacked 80 nm membranes. The unincorporated contrast agents were removed by 18 hours of dialysis (MW cutoff 8 kDa) against a 250-fold volume excess of 0.02 mM HEPES-buffered saline solution (HBS; pH 7.4). The liposome formulation was then concentrated to a final iodine concentration of approximately 40 mg/mL, with a final Cy5.5 concentration ranging between 35 and 45 mg/mL. Liposomes without Cy5.5-DSPE (CT liposomes) were also made using the same method with a molar lipid ratio of 55:40:5 DPPC, CH, DSPE-PEG2000.
Liposome Characterization
To evaluate their hydrodynamic diameter and zeta potential, the liposomes were diluted to a lipid concentration of 2.5 mM in deionized water. The hydrodynamic diameter was measured by dynamic light scattering (DLS) at an angle of 90° and a temperature of 25°C using a 90Plus particle size analyzer (Brookhaven, Holtsville, NY). Zeta potential was measured by photon correlation spectroscopy using a ZetaPALS zeta potential analyzer (Brookhaven, Holtsville, NY). The average of 10 runs consisting of 25 measurement cycles per run was reported. For iodine and Cy5.5 concentration measurements, the liposomes were ruptured with a 10-fold volume excess of ethanol and diluted with HBS. The iodine concentration was determined by measuring UV absorbance at a wavelength of 245 nm, and that of Cy5.5 was determined by measuring UV absorbance at a wavelength of 674 nm. The loading efficiencies for both iohexol and Cy5.5 were calculated using the following equation: agent loading efficiency (%) = (amount of agent in final product)/(amount of agent added during preparation) × 100.
In Vitro Stability and Agent Release
Liposome stability was evaluated by monitoring the hydrodynamic diameter by DLS analysis over a 14-day incubation period. Specifically, the liposomes were placed in a dialysis bag (MW cutoff 8 kDa) and immersed in 250-fold volume excess of HBS containing 45 mg/mL BSA. The sample was incubated at 37°C. Over the course of 14 days, aliquots of the liposome solution were taken from the dialysis bag and their hydrodynamic diameter was measured using DLS. The release of contrast agents from the liposomes was also evaluated. Briefly, liposomes were mixed with fetal bovine serum (FBS) such that the final lipid concentration was 6.5 mM and incubated at 37°C. At 0, 2, 6, 24, 48, 72, and 96 hours postincubation, aliquots were collected and a Sepharose CL-4B column was used to separate the liposomes from the free agents and protein. The liposome fraction was collected, and the encapsulated amounts of iohexol and Cy5.5 were determined by measuring the UV absorbance at 245 and 674 nm, respectively.
Macroscopic CT and Optical Image Acquisition
The in vivo imaging studies were performed under protocols approved by the University Health Network Animal Care and Use Committee. Athymic female CD-1 mice (6 weeks; average weight 27 g) were injected via the tail vein with a liposome formulation (CT or CT/optical) such that each animal received 1.8 g lipid/kg body weight, 0.35 g iodine/kg body weight, and, for the CT/optical liposomes, 0.3 mg Cy5.5/kg body weight. The animals were anesthetized using 2% isoflurane, and full-body 16-second anatomic micro-CT scans (GE Locus Ultra micro-CT, GE Healthcare, Waunakee, WI) were performed preinjection and 0.083, 1, 4, 8, 24, 48, 72, 150, and 168 hours postinjection. CT images were acquired at 80 kVp and 70 mA with a voxel size of 0.15 mm × 0.15 mm × 0.15 mm and a field of view of 15.7 cm (transaxial) and 10.2 cm (long). Immediately after each CT scan, the animal was fixed in the scanning chamber of the FMT system (VisEn Medical Inc., Bedford, MA). A reflectance image of each animal was obtained, and the chamber was filled with the index matching fluid (VisEn Medical Inc.) up to the animal's upper chest. The scanning window was adjusted to its maximum size. Each animal was scanned at excitation and emission wavelengths of 670 nm and 700 nm, respectively. FMT images were acquired with a nominal voxel size of 1 mm × 1 mm × 0.5 mm and a tomographic nominal field of view of 34.5 mm × 34.5 mm.
The same protocol was used for imaging tumor-bearing animals. H520 non-small cell lung cancer cells were cultured in RPMI 1640 medium supplemented with 10%vol FBS and 1%vol penicillin-streptomycin in an atmosphere containing 5% CO2. Cells were inspected for consistent morphology and growth rate and were passaged no more than 10 times prior to mouse inoculation. Athymic female CD-1 mice (4 weeks; average weight 23 g) were inoculated subcutaneously with 5 × 10⁶ H520 cells in the right hind flank. CT/optical liposomes (0.35 g/kg iodine, 0.3 mg/kg Cy5.5, and 1.8 g/kg lipid) were injected into the animals 9 days after cell inoculation. CT scans were performed preinjection and 0.083, 24, 50, 73, 97, 122, 146, 169, and 193 hours postinjection. Immediately after each CT scan, an FMT scan was performed, with the scanning window adjusted to surround the right hind flank.
CT and FMT Image Analysis
CT images were exported via DICOM and analyzed (MicroView v2.2, GE Healthcare, Waunakee, WI) according to a previously reported method. 26 Briefly, the mean iodine concentrations in various organs were determined by contouring the volume of interest (VOI) on multiple two-dimensional slices to generate a 3D volume and calculating the mean voxel intensity (expressed in CT attenuation Hounsfield units [HU]) for each volume. For the non-tumor-bearing animals, iodine concentrations in blood (aorta), liver, spleen, and kidneys were measured. For the tumor-bearing animals, iodine concentrations in blood (aorta) and tumor were measured. Signal enhancement for each tissue was calculated as the difference between the mean voxel intensity at each time point postinjection and the mean voxel intensity preinjection. The intensity values were then converted to iodine concentrations using a CT calibration curve of HU versus iodine concentration, and the results were expressed as percent injected dose per volume tissue (%ID/cm3). Pharmacokinetic parameters were calculated by fitting the blood iodine concentration profiles with a one-compartment model using Scientist3.0 (Micromath, St. Louis, MO). Initial parameter values were estimated through curve stripping of the blood iodine concentration versus time plot. The fitting model used a monoexponential decay function (C = C0e−Ke*t, where Kg is the elimination constant) and method of weighted least squares. The best fit was chosen based on highest coefficient of determination, model selection criterion, and lowest coefficient of variation. All best fits possessed an R 2 > .98. The vascular half-life was calculated as T1/2 = ln(2)/Ke. The area under the blood-iodine concentration versus time curve (AUC) was calculated using the trapezoidal rule. Volume of distribution (VD) was calculated as VD = dose/C0. Clearance (Cl) was calculated as Cl = dose/AUC.
The FMT images for the tumor-bearing animals were analyzed in tumor VOIs, where VOI boundaries were defined by tumor uptake. The mean Cy5.5 concentration in the tumor was determined using the FMT analysis software (VisEn Medical Inc.). Briefly, an intensity-derived 3D contour was defined to include the tumor region. The intensity/window threshold level was adjusted to exclude low signal voxels in the contour until the contour volume matched the tumor volume determined by micro-CT analysis. The mean voxel intensity was converted to %ID/cm3 in the tumor using a custom FMT calibration curve of FMT signal versus Cy5.5 concentration. The calibration curve was generated in advance from varying Cy5.5 concentrations (10 steps from 15 to 4,000 nM), each loaded in a calibration block provided by the vendor (VisEn Inc.) and scanned using the FMT.
The iohexol to Cy5.5 ratio (wt/wt) for the tumor was calculated for all time points by dividing the concentration of iohexol (quantified by micro-CT) by the concentration of Cy5.5 (quantified by FMT) at the tumor region and normalizing to the iohexol to Cy5.5 ratio in the formulation prior to in vivo administration.
Feasibility of Microscopy of Intratumoral Liposome Distribution and Transport
At 24 and 193 hours postinjection of the CT/optical lipsomes (same dose as above) and after CT and FMT scanning, one mouse was scanned using the confocal laser-scanning fluorescence microscope (Leica Microsystems Inc., Bannockburn, IL). Specifically, the skin above the tumor was removed, and the endoscopic probe (excitation and emission wavelengths of 650 and 700 nm, respectively) was stabilized at various locations inside and on the surface of the tumor (through visual inspection). Real-time confocal videos (frame rate 12 fps) of the regions were recorded to monitor the transport of the liposomes inside the tumor microenvironment. The Cy5.5 concentration for each time point was estimated by the FMT quantified Cy5.5 concentrations in the tumor of the same mouse as described previously.
Results
Synthesis and Characterization of Cy5.5-DSPE
The presence of the Cy5.5-DSPE was determined using UPLC and confirmed by mass spectroscopy. The purity of Cy5.5-DSPE was found to be 99 ± 1%, and the yield was 17 ± 5%.
Physicochemical Characterization of the CT and CT/Optical Liposomes
The physicochemical properties of the CT and CT/optical liposomes are summarized in Table 1. Following concentration of the liposome formulation to ≈ 40 mg/mL iodine (35–45 μg/mL Cy5.5), the agent to lipid ratio (w/w) was ≈ 0.53:1 for iohexol and ≈ 1.4 × 10⁻⁴:1 for Cy5.5. DLS analysis of the CT/optical liposomes revealed a narrow, unimodal size distribution, with the incorporation of Cy5.5 increasing the hydrodynamic diameter from 82 ± 2 to 86 ± 5 nm, although this change is not statistically significant. The zeta potential of the CT/optical liposomes (− 34 ± 3 mV) was more negative than that of the CT liposomes (− 28 ± 3 mV), which is attributed to the negatively charged Cy5.5 molecules at the surface of the vesicles.29,30 The CT/optical liposomes were shown to be stable, with no change in their size over the 2-week incubation period in the presence of BSA (Figure 2). Figure 3A shows the in vitro release of iohexol and Cy5.5 from the CT/optical liposomes and of only iohexol from CT liposomes in FBS at 37°C. After 96 hours, ≈ 15% of iohexol was released from both CT and CT/optical liposomes, whereas ≈ 25% of Cy5.5 was released from the CT/optical liposomes. Therefore, the ratio of iohexol to Cy5.5 (w/w) in the CT/optical liposomes increased during the course of the incubation period such that it was significantly higher than that in the preincubation formulation at all time points except 2 hours (Figure 3B). Such release of lipid conjugates from phospholipid bilayers has been shown to occur as a result of lipid exchange with serum lipoproteins.31–33
Physicochemical Characteristics of CT and CT/Optical Liposomes (n = 5)

CT = computed tomography; N/A = not available.
Data are represented as the mean ± standard deviation.
Based on (8.1 ± 0.9) × 104 lipids/liposome, 4.5 nm bilayer thickness,49 and assuming a homogeneous distribution of iohexol and Cy5.5.
Statistically significant differences with p < .05.

Hydrodynamic diameter (obtained by dynamic light scattering analysis) of the CT/optical liposomes over a 2-week period with dialysis against a 250-fold volume excess of HEPES-buffered solution containing 45 mg/mL bovine serum albumin at 37°C. Data are represented as the mean ± standard deviation of three independent batches of liposomes.

A, The in vitro release profile of iohexol and Cy5.5 from CT/optical liposomes (n = 3) and iohexol from CT liposomes (n = 3) incubated in fetal bovine serum (FBS) at 37°C. B, Ratio of iohexol to Cy5.5 (wt/wt) in the CT/optical liposomes following incubation in FBS at 37°C. The initial iohexol to Cy5.5 ratio was normalized to 1. *Statistically significant difference (p < .01) from t = 0.
In Vivo Pharmacokinetics, Biodistribution, and Tumor Accumulation of the Liposomes
Figure 4 contains representative single coronal micro-CT and FMT image slices from a non–tumor bearing mouse at various time points postadministration of the CT/optical liposomes, illustrating the distribution of the liposomes in vivo. As shown, tissues and organs can be distinguished in the CT images, but it is not possible to identify using the FMT images alone. However, each FMT slice also contains a reflectance image (in effect, a photograph) of the animal and the fluorescence image in the scanning window (depicted in the square in each slice). Micro-CT and FMT image slices representing the accumulation of liposomes in the tumor are shown in Figure 5. Both the transverse and coronal CT images are displayed. Quantitative analysis of the images demonstrated an increased vascular half-life (T1/2 = 36.2 ± 2.1 hours) compared to the previously reported CT liposomes (T 1/2 = 29.2 ± 3.7 hours) in non-tumor-bearing mice (p < .05; Figure 6A, Table 2). In tumor-bearing mice, the vascular half-life of the CT/optical liposomes was found to be 30.3 ± 8.9 hours (Figure 7A), with a higher variability, and therefore not statistically different from the CT liposomes. The data obtained from analysis of biodistribution in non–tumor-bearing mice revealed a slight increase in liposome accumulation in the liver and kidneys for the CT/optical liposomes at selected time points, with statistically significant differences in the liver (p < .05 for 5 minutes and 24 hours postinjection) and kidneys (p < .05 for 48, 72, and 96 hours postinjection) (Figure 6, B, D, and E). Liposome accumulation in the spleen was equivalent for both formulations (Figure 6C).

Micro-CT (top) and FMT (bottom) images of a non–tumor-bearing mouse injected with CT/optical liposomes. The same window and level were used for all images from each modality.
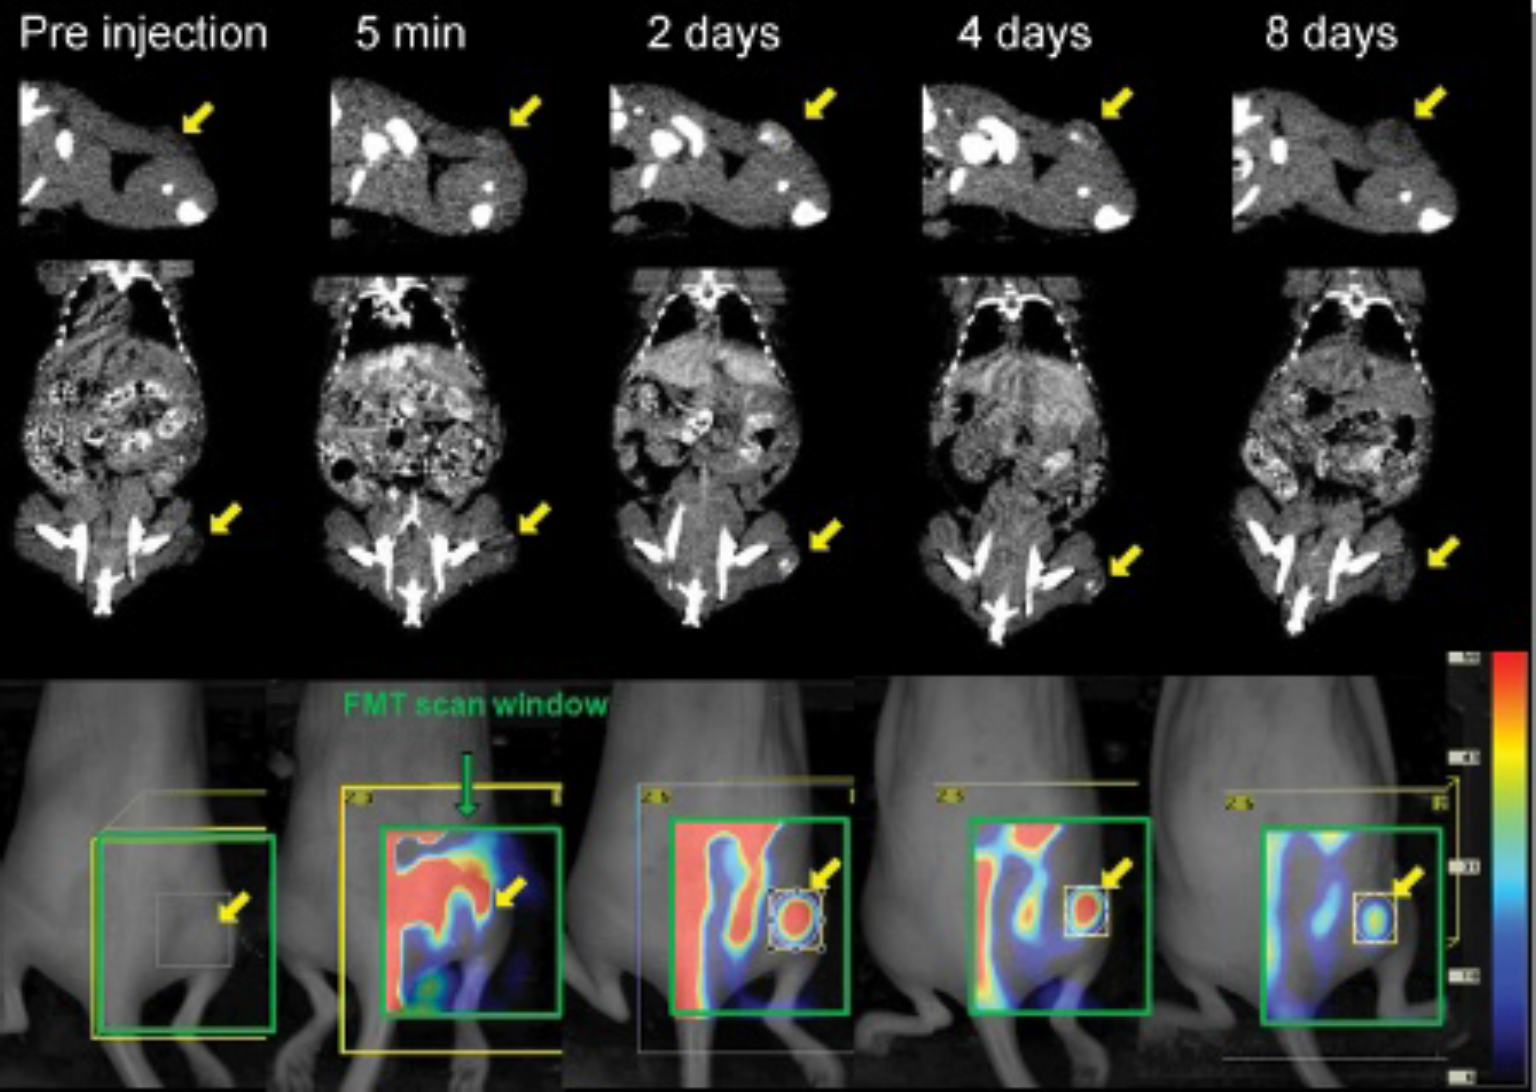
Micro-CT transverse (top), coronal (middle), and FMT images of a tumor-bearing mouse injected with CT/optical liposomes at various time points. The transverse micro-CT images display the right side of the mouse. The arrow indicates the location of the tumor. The same window and level were used for images from each modality.

Pharmacokinetics and biodistribution profiles of CT and CT/optical liposomes in non-tumor-bearing mice as determined using micro-CT image-based assessment. A, The blood iodine concentration versus time. The time-dependent biodistribution measured in (B) liver, (C) spleen, (D) left kidney, and (E) right kidney. *Statistically significant differences (p < .05) between CT and CT/optical liposomes in %ID/cm3 tissue.
Pharmacokinetic Parameters for CT and CT/Optical Liposomes (n = 7) in Non-Tumor-Bearing Mice and CT/Optical Liposomes (n = 5) in Tumor-Bearing Mice

AUC = area under the curve; CL = clearance; CT = computed tomography; T1/2 = half-life; VD = volume of distribution.
Statistics were analyzed between the CT and CT/optical liposomes in non-tumor-bearing mice and between CT/optical liposomes in non–tumor- and tumor-bearing mice.
Statistically significant differences with p < .05.
Statistically significant differences with p < .01.

A, Blood iodine concentration at various time points as determined using micro-CT image-based assessment for CT/optical liposomes in tumor-bearing mice (n = 5). B, Micro-CT and FMT image-based determination of intratumoral concentration versus time for the CT/optical liposomes. Statistical significance was observed only for t = 0.083 hours. C, Ratio of iohexol to Cy5.5 (wt/wt) in the tumor. The ratios were normalized to the ratio preinjection. *Statistically significant difference from the ratio preinjection.
The liposome accumulation in the tumor is shown in Figure 7B. As shown, both analyses by micro-CT and FMT imaging reveal similar tumor accumulation profiles with maximum liposome accumulation in tumor at 48 hours postinjection (ie, ≈ 10 %ID iohexol/cm3 and ≈ 7 %ID Cy5.5/cm3 in tumor). However, FMT-based determination of tumor accumulation shows a higher %ID/cm3 for the liposomes at 5 minutes postinjection in comparison with the accumulation measured using the micro-CT data (p < .05). At all other time points, micro-CT-based determination showed a higher average liposome accumulation than that determined by FMT, although no statistical significance was found. These phenomena are consistent with the increased rate of release of Cy5.5 compared to iohexol from the liposomes, in accordance with the in vitro results (see Figure 3B). Figure 7C includes a plot of the in vivo iohexol to Cy5.5 ratio over the entire tumor volume for each time point, wherein the iohexol and Cy5.5 concentrations are determined by micro-CT and FMT analyses, respectively.
Figure 8 shows the representative frames selected from the video using the confocal laser-scanning fluorescence microscope acquisitions in the tumor (A, B, C) and in normal liver (D). Targeting of the microscope tip to normal liver tissue (Figure 8D) highlights the orderly nature of the normal vasculature compared to the heterogeneous nature of the tumor vasculature being monitored in Figure 8, A and C. At the early time points (24 hours postinjection), most liposomes still resided within the tumor vasculature. At this time point, the FMT-estimated bulk Cy5.5 concentration in the tumor was 0.4 μg/mL (≈ 0.4 μM). During the video monitoring period (30 minutes), the liposomes were observed to flow inside the vasculature with various speeds, with reversal in flow direction also seen. These flow patterns need to be considered cautiously as the mechanical pressure of the probe placement can affect transport at these levels.
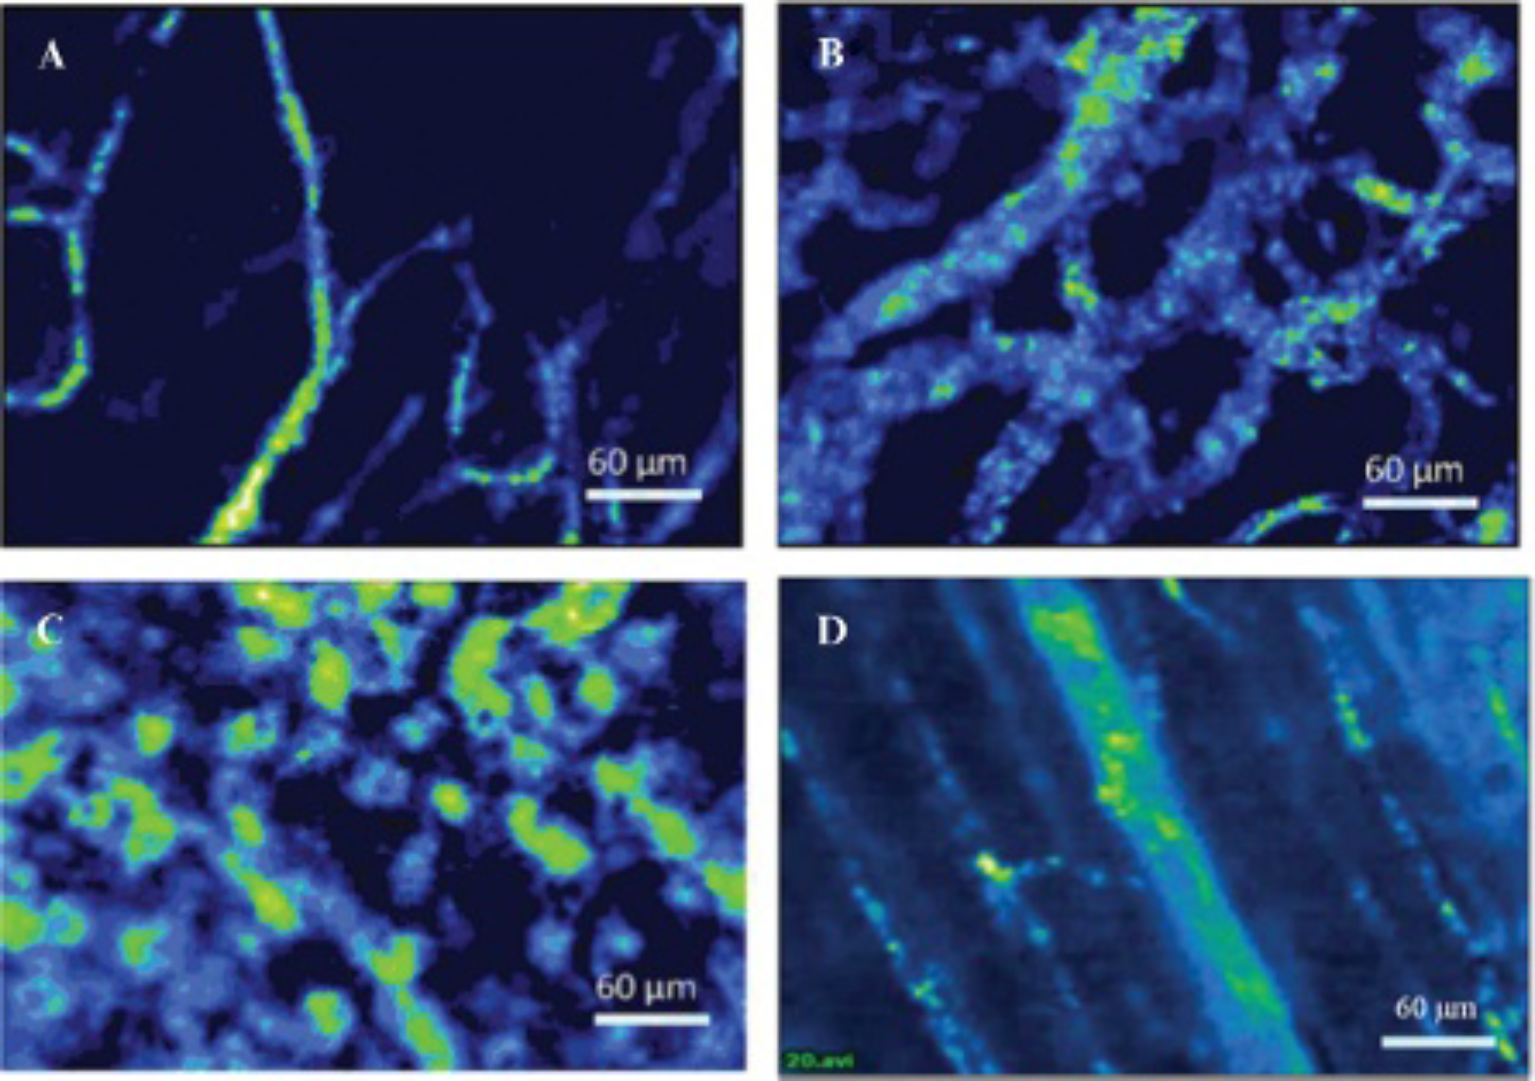
In vivo endoscopic images of the CT/optical liposomes in the tumor area at 24 hours (A, B) and 8 days (C) postinjection. D, The CT/optical liposomes in the liver at 24 hours postinjection. Early time points showed vascular containment, whereas later points demonstrated extravascular entrapment.
However, no visible transport of the liposomes out of the vasculature was observed during the monitoring period. On the other hand, at 8 days postinjection (see Figure 8C), liposomes could be seen in the extravascular space and scattered within what was presumed to be tumor tissue. At this time point, the bulk Cy5.5 concentration in the tumor was estimated to have dropped to 0.1 μg/mL (≈ 0. 1 μM). It is interesting to note that the extravascular patterns are stable and the intravascular motion was no longer visible.
Discussion
In the current study, we demonstrated the capability of performing macroscopic and microscopic imaging to monitor the in vivo distribution of a novel CT/optical liposome formulation. In this formulation, iohexol was passively encapsulated within the liposomes while Cy5.5 was conjugated to the bilayer surface via insertion of a phospholipid-Cy5.5 construct. A formulation that is stable in vitro (see Figure 2) with low release of the incorporated contrast agents (see Figure 3A) is shown to translate into prolonged in vivo stability using combined-modality imaging. The extended circulation lifetime of the liposomal systems is demonstrated by the prolonged contrast enhancement in both the CT and FMT images (see Figure 4, Figure 5, Figure 6, and Figure 7). The tumor accumulation profile (see Figure 7B) clearly demonstrates the enhanced permeability and retention (EPR) effect, which is a well-established phenomenon wherein liposomes and other nanocarriers passively accumulate at solid tumors due to leaky vasculature and poor lymphatic drainage.34–36 The lower %ID/cm3 values from FMT compared to the micro-CT (see Figure 7B) and the corresponding increased iohexol to Cy5.5 ratios (see Figure 7C) reveal that the Cy5.5 is released from the liposomes at a more rapid rate than iohexol in vivo, correlating with the in vitro observations (see Figure 3A) but not agreeing exactly.
The presence of background fluorescence is known to contribute to the quantification inaccuracy of FMT. 37 It has been reported that this error can be as large as 50%. Nevertheless, subtraction of the background fluorescence prior to image reconstruction can lead to improved image quality and quantification accuracy. Despite applying this subtraction, quantification error was still reported to be over 30%. 37 Such FMT quantification error leads to differences in micro-CT and FMT-based quantification results. In our study, the impact of this is shown in Figure 7B, where the high background fluorescence associated with the large blood-pool concentration greatly affects the FMT signal at early time points (see 5 minutes postinjection) compared to the micro-CT result. The extent to which background fluorescence can affect FMT quantification is currently being investigated in a separate study. The differences in micro-CT and FMT quantification could also be attributed to limitations of the FMT approach in delineating the tumor. Whereas micro-CT allows for delineation of organs and tissues and can provide quantitative measurement of liposome distribution in vivo, 26 the FMT system does not provide agent-independent imaging of the anatomy.
In the current study, a simple approach was employed where the CT data set was used as a guide for delineation of the tumor VOIs in the FMT data set. Several FMT-based studies have used CT to guide FMT image reconstruction to improve FMT image quality and quantification.38–41 An alternative would be to use the FMT signal alone. This was evaluated for illustration purposes by calculating the ratio of CT to FMT signal as a function of a cubic VOI designed to encompass the entire enhancing region on the FMT image. These ratios were then sorted by volume of the cubic VOI and plotted. As shown in Figure 9, this ratio remained constant when the VOIs were less than or equal to the micro-CT defined tumor volume (indicated by the dotted line) but increased drastically with further increases in FMT-defined VOI.

Iohexol to Cy5.5 ratio (wt/wt) as a function of the size of the volume of interest (VOI). Larger VOIs resulted in an underestimate of the Cy5.5 concentration. Data include liposome accumulation in tumors 24 to 72 hours postinjection. The tumor volumes are 25 to 30 mm3. The ratios were normalized to the iohexol to Cy5.5 ratio preinjection.
Delineation of objects in imaging systems that suffer from “limiting blur” has been attempted before. Adaptive thresholding methods have been proposed and applied to FDG-PET imaging.42,43 In these studies, thresholds (% of the maximum intensity) were applied to PET images and regions of interest were contoured and compared to those determined by CT imaging. The positron emission tomographic threshold that gave rise to the smallest difference in ROI volumes was identified as optimal. This threshold was reported to be around 40% of the maximum standard uptake value (SUVmax) 42 and has been adopted in several clinical studies.44–46 However, it was noted that the threshold depends on the VOI 43 and the background signal 47 and therefore should not be a fixed value. In our study, it was found that the lowest FMT window threshold where the FMT VOI matched the micro-CT-defined tumor volume was determined to be 66 ± 7% of the maximum FMT signal within the VOI. Indeed, the constant FMT threshold holds only for tumors of a certain volume (25-30 mm3) and varied based on the micro-CT-defined tumor volume.
The main benefit provided by multimodal imaging is the acquisition of complementary information. In our study, micro-CT imaging enabled the clear identification of anatomic features (see Figure 4) with good spatial resolution and permitted the quantitative and longitudinal assessment of the pharmacokinetics and biodistribution of the liposomes in vivo. In addition, it provided information on the intratumoral heterogeneity associated with liposome accumulation (see Figure 4). This compensated for the inability of FMT to distinguish between different organs and assess the intratumoral liposome distribution. In complement, the high sensitivity of optical imaging allowed for a remarkably low fluorophore burden per liposome while still providing sufficient signal in both macroscopic (FMT) and microscopic (confocal probe) optical imaging. Comparatively, micro-CT requires an iodine concentration in the micromolar range 48 for detection, whereas FMT can detect Cy5.5 concentrations in the nanomolar range. 10 Our CT/optical liposome formulation gave rise to a 1,000:1 (iodine:Cy5.5) difference in the dose of agents administered. Nonetheless, FMT signal was still clearly observed 8 days postinjection, whereas CT contrast could not be visualized relative to intrinsic x-ray quantum noise (see Figure 5). For in vivo confocal microscopy, its high sensitivity and resolution allowed us to identify small clusters of liposomes and monitor their in vivo transport in real time. In this study, the microscopy confirmed the nature of the dynamics of the EPR effect, where at 24 hours postinjection, liposomes were observed to be entrapped in the tumor vasculature and moved with the blood flow (see Figure 8, A, B), and at 8 days postinjection, liposomes were observed to have extravasated into the tumor intersitium (see Figure 8C).
Conclusion
This study demonstrates the feasibility and effectiveness of assembling a multimodal agent that enables combined CT and optical imaging to obtain qualitative and quantitative macroscopic and microscopic measurements of the pharmacokinetics and in vivo distribution of CT/optical liposomes. Beyond increasing our understanding of the nature of liposomal transport, such combined-modality agents may find applications wherein macroscopic and microscopic localization is required. For example, a CT/optical agent could be envisaged as a tool in the clinical setting for image-guided surgery to assess the location of the tumor both preoperatively with CT and intraoperatively with fluorescence optical imaging.
Footnotes
Acknowledgments
We thank Dr. Jinzi Zheng for providing scientific support, Debbie Squires for technical assistance, and the team at the STTARR Innovation Centre and the University Health Network animal care program for technical support.
Financial disclosure of authors: This study was supported by grants from the Canadian Institutes of Health Research and Ontario Institute for Cancer Research to C.A. and D.A.J.
Financial disclosure of reviewers: None reported.