
Abstract
The purpose of this positron emission tomography (PET) study was to compare the prognostic value of pretreatment volume of [11C] methionine (MET) uptake and semiquantitative MET uptake ratio in patients with malignant glioma. The study population comprised 40 patients with malignant glioma. Pretreatment magnetic resonance imaging (MRI) and MET-PET imaging were performed before the initiation of glioma treatment in all patients. The pretreatment MET uptake ratios and volumes were assessed. To create prognostically homogeneous subgroups, patients′ pretreatment prognostic factors were stratified according to the six classes of Radiation Therapy Oncology Group recursive partitioning analysis (RTOG RPA). Univariate and multivariate analyses were performed to determine significant prognostic factors. Survival analyses identified the pretreatment volume of MET uptake and a higher RTOG RPA class as significant predictors. In contrast, pretreatment maximum areas of contrast enhancement on MRI and semiquantitative MET uptake ratios could not be identified as significant prognostic factors. The patients′ outcomes and Karnofsky Performance Scale scores were significantly correlated with pretreatment volume of MET uptake but not with semiquantitative MET uptake ratio. The data suggest that pretreatment volumetry of MET uptake but not the semiquantitative MET uptake ratio is a useful biologic prognostic marker in patients with malignant glioma.
CURRENTLY, ANATOMIC IMAGING using magnetic resonance imaging (MRI) is the most widely accepted method of determining the target for the treatment of patients with malignant gliomas. The area of gadolinium–diethylenetriamine pentaacetic acid (Gd-DTPA) enhancement is generally assumed to correspond well to the main mass of active tumor tissue. However, using Gd-DTPA enhancement as a predictive marker was not significantly correlated with outcome. 1
In patients with malignant glioma, [11C]-methionine (MET) positron emission tomography (PET) is widely used for the detection of brain tumor recurrence, guidance of biopsies and neurosurgical resection, treatment monitoring, and delineation of radiation therapy target volume.2–8 Additionally, PET imaging before treatment has been used for estimation of prognosis.9–14 To date, however, the value of the in vivo application of amino acid analogues (especially the radiotracer MET) before the initiation of treatment as an independent prognostic factor remains controversial. 10 For example, using a semiquantitative region of interest (ROI) analysis, no significant prognostic value of studying the maximal MET uptake index in low- and high-grade gliomas before treatment has been reported. 10
In contrast, to assess the prognosis of primary brain tumors before treatment using a semiquantitative ROI analysis of MET uptake, De Witte and colleagues found that high MET uptake can be used as a prognostic factor for World Health Organization (WHO) grade II and III tumors, with high quantitative uptake being associated with poor survival. 14 Interestingly, in that study, no relationship between MET uptake before treatment and survival in patients with glioblastoma multiforme (GBM) could be observed. The authors suggested that this observation might reflect the fact that survival in patients with highly malignant tumors is uniformly short, largely influenced by the localization of the lesion and reflected by the Karnofsky Performance Scale (KPS) score.
On the other hand, previous studies also confirmed the pretreatment reliability of semiquantitative MET evaluation using a ROI analysis as a prognostic factor in patients with low- and high-grade glioma (including patients with GBM).9,11–13 In these studies, MET uptake ratios recorded before the initiation of treatment were highly correlated with prognosis.
To further investigate this issue and to explore the prognostic value of the pretreatment volume of MET uptake in patients with high-grade malignant gliomas, we performed a threshold-based volume of interest (VOI) analysis of the metabolically active tumor. We hypothesized that pretreatment volumetry of MET uptake provides a better prognostic value than a semiquantitative ROI analysis.
Materials and Methods
A retrospective review of medical records was performed on all patients with diagnostic brain MRI strongly suggesting a diagnosis of WHO grade III or IV glioma who had undergone MET-PET prior to histologic diagnosis of a supratentorial high-grade glioma from 1995 to 2006. Forty patients with histologically verified high-grade glioma (WHO grade III or IV) were identified and included in this study. Prior to histologic diagnosis, pretreatment MRI and MET-PET were performed within a mean of 20 ± 7 days in all patients. As described previously, pretreatment MRIs were reviewed and classified as showing enhancement of tumor mass or not. 11 Table 1 provides a summary of the patients′ characteristics. To create prognostically homogeneous patient subgroups, patient data concerning pretreatment prognostic factors were stratified according to the six prognostic classes (Table 2) of Radiation Therapy Oncology Group recursive partitioning analysis (RTOG RPA). 15 For analysis purposes, classes 1 to 3, 5, and 6 were merged (Table 3).
All patients had given written informed consent to participating in the MET-PET studies. PET studies were performed on an ECAT EXACT HR or ECAT HRRT scanner (Siemens/CTI, Knoxville, TN). Following a 10-minute transmission scan, PET scanning was performed after intravenous slow bolus injection of 740 MBq (20 mCi) of MET, synthesized according to the method of Berger and colleagues. 16 Tracer accumulation was recorded in three-dimensional mode over 60 minutes in 47 transaxial slices covering the entire brain. Summed activity from 20 to 60 minutes after tracer injection was used for image reconstruction. Images were reconstructed with Fourier rebinning and filtered back-projection with a ramp filter. Images were corrected for scatter, attenuation, and random coincidences. Spatial resolution was 6 mm or better in all dimensions.
Patients and Disease Characteristics

KPS = Karnofsky Performance Scale; TTP = time to progression.
RTOG RPA Classification

AA = anaplastic astrocytoma; GBM = glioblastoma multiforme; KPS = Karnofsky Performance Scale; MS = mental status; NF = neurologic function; RPA = recursive partitioning analysis; RTOG = Radiation Therapy Oncology Group.
Distribution of Patients′ Characteristics and MET-PET Results by RTOG RPA Classes

AA = anaplastic astrocytoma; GBM = glioblastoma multiforme; KPS = Karnofsky Performance Scale; MET =- [11C]-methionine; PET = positron emission tomography; RPA = recursive partitioning analysis; RTOG = Radiation Therapy Oncology Group.
PET data assessment was based on an ROI approach. As described previously,17,18 a circular ROI (8 mm radius; surface 201 mm2) was placed in the hottest area of the tumor (ie, centered on the pixel with maximal activity). For reference, an identically sized circular ROI was placed on the unaffected corresponding contralateral cortex or, if impossible because of the tumor location, on intact brain regions. The uptake index of tumor to contralateral mean activity was calculated. As described previously, 17 tumor volumes were measured by performing a three-dimensional threshold-based VOI analysis in all patients for MET uptake using the VINCI tool 19 (Figure 1). The threshold for increased MET uptake was set to ≥ 1.3 in the contiguous tumor region. In a previous study with mainly high-grade gliomas comparing the exact local MET uptake to histopathologic findings obtained with stereotaxic-guided biopsies, a receiver operating characteristics analysis demonstrated a sensitivity of 87% and a specificity of 89% for the detection of tumor tissue at a threshold of 1.3-fold MET uptake relative to normal brain tissue. 20 This threshold was subsequently reproduced in a further study using diffusion tensor imaging in comparison with MET uptake. 21
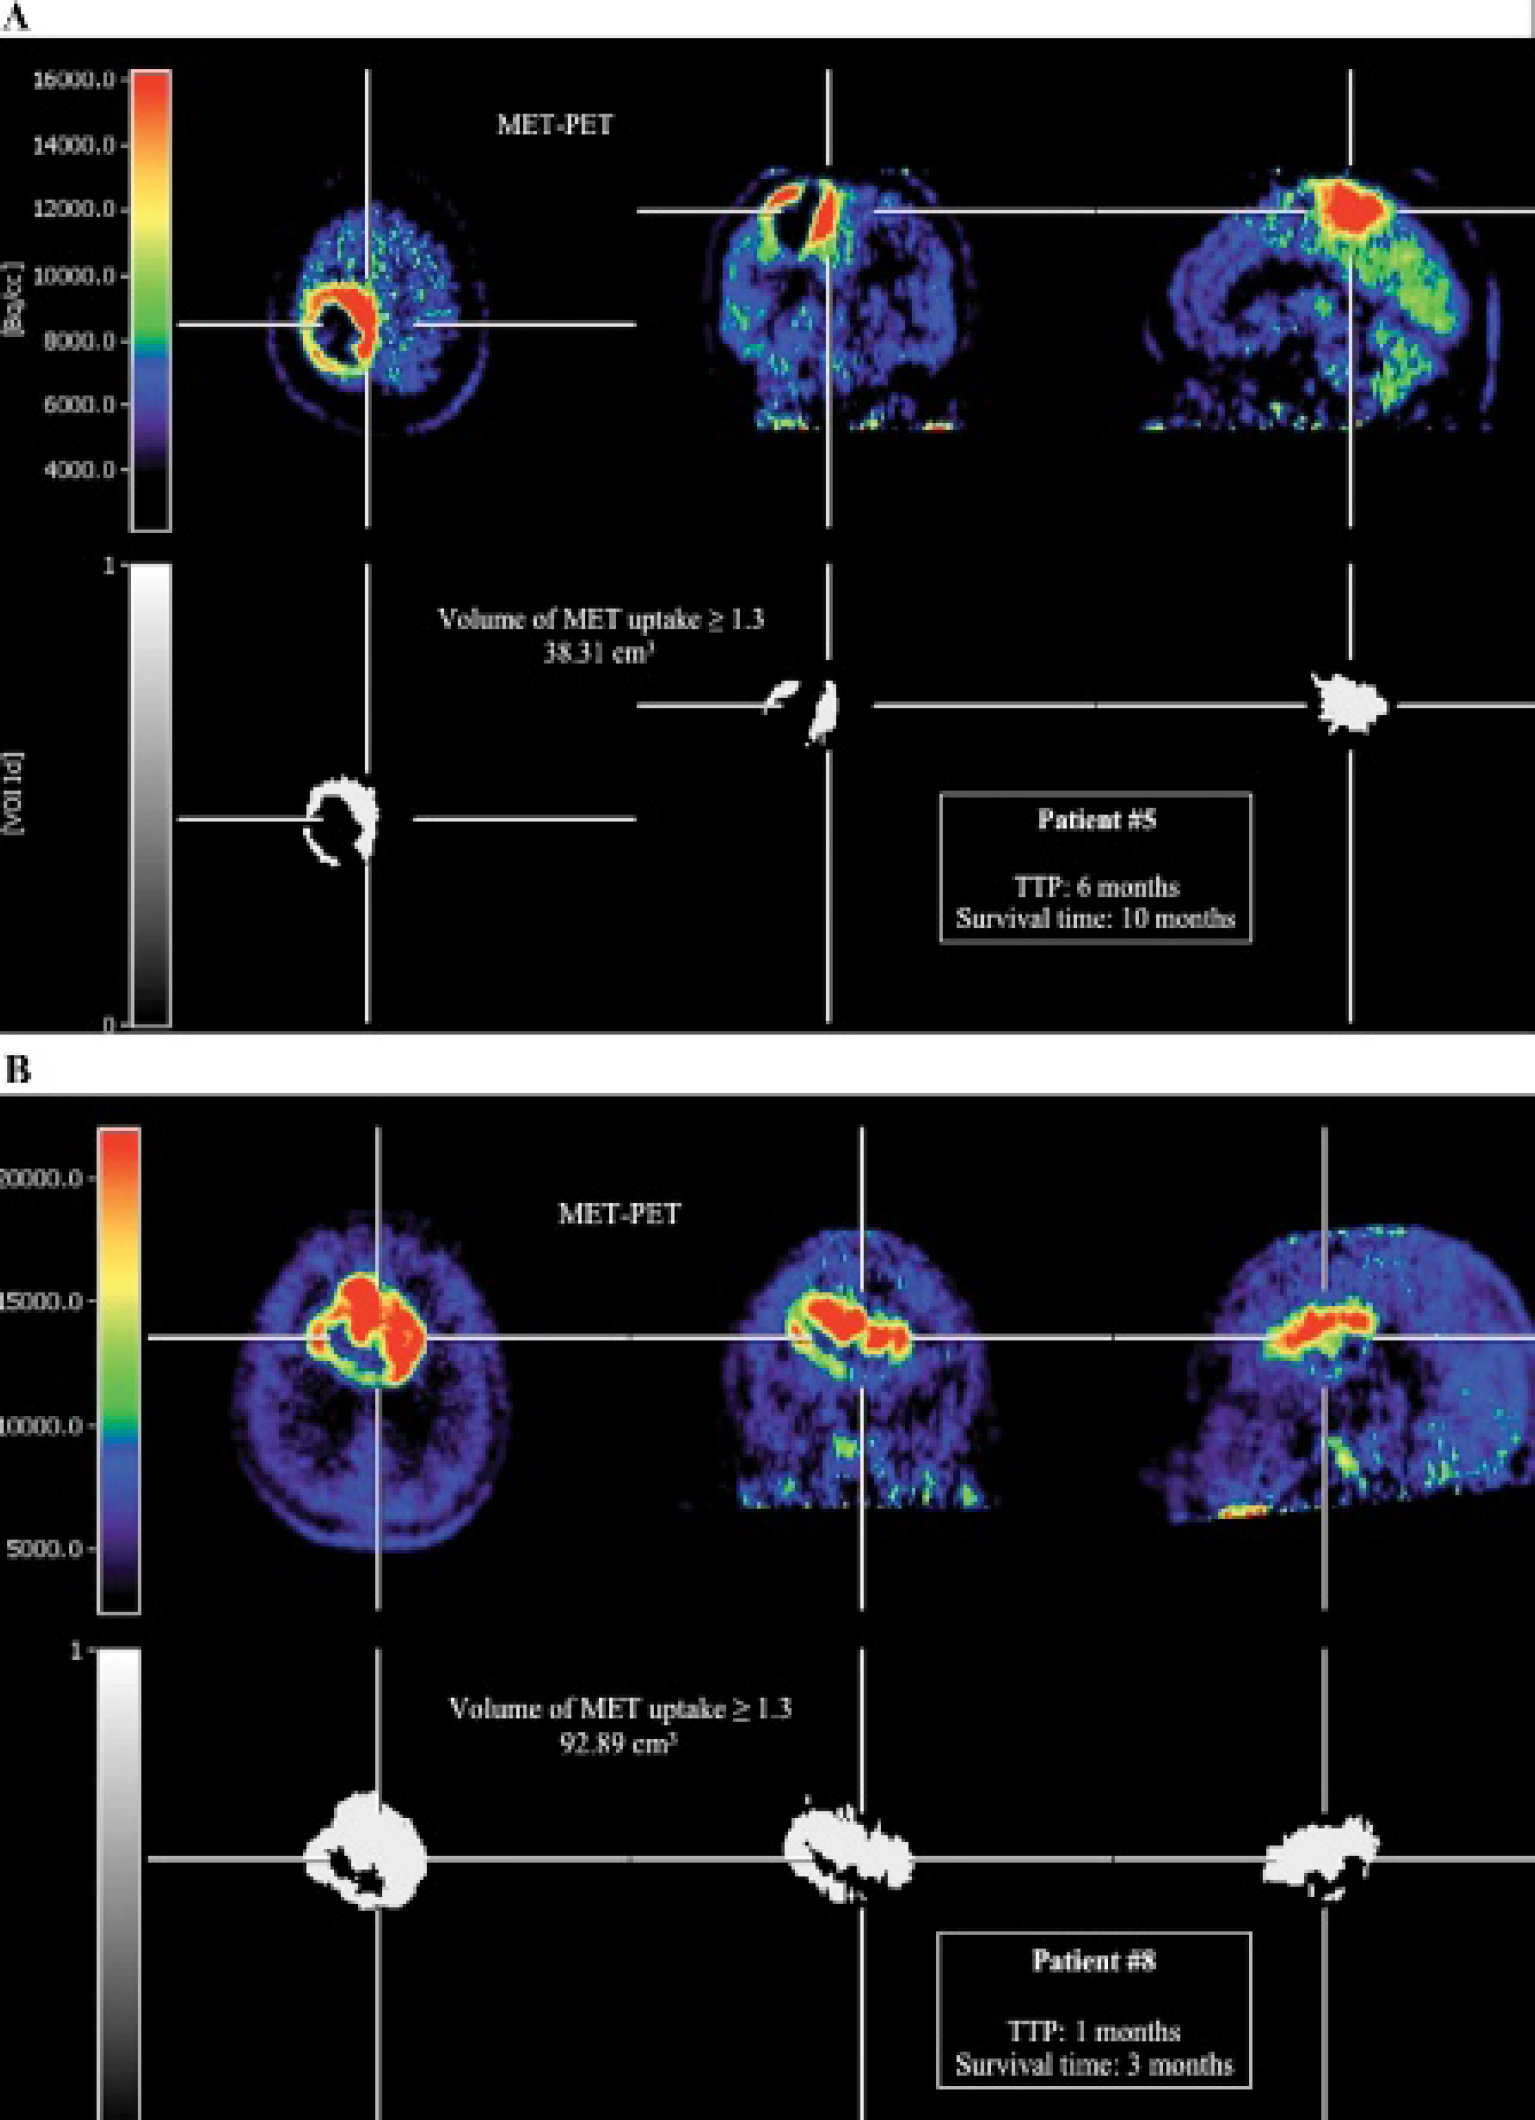
A and B, Images of the pretreatment active tumor volume (white) at a [11C]-methionine (MET) uptake threshold of ≥ 1.3. Assessment of the pretreatment volume of MET uptake in patient 5 reveals a volume of 38.31 cm3. Tumor progression in this patient was after 6 months, and the patient died after 10 months. In contrast, patient 8 has a clearly higher pretreatment metabolically active tumor volume. Tumor progression occurred after 1 month, and the patient died after 3 months. PET = positron emission tomography; TTP = time to progression.
To assess the maximum area of contrast enhancement on MRI, a two-dimensional analysis was performed. To determine the maximum area of contrast enhancement, the product of the two longest perpendicular diameters of the contrast enhancement was calculated. 22 It has been shown that one- or two-dimensional measurements were comparable to higher dimensional modalities in assessment of tumor growth and in correlation with disease progression and survival. 22
Survival time was defined as time in months between the pretreatment MET-PET study and death or in the terminal stage of the disease at the beginning of palliative care. Additionally, the time to progression (TTP), defined as the time in months between the initiation of the pretreatment MET-PET study and tumor recurrence according to the Macdonald criteria 23 (one criterion met by the following: contrast enhancement or tumor enlargement ≥ 25% in sum of the products of perpendicular diameters, clinical deterioration, or any new contrast-enhancing lesion), was determined retrospectively from the medical records. Where required, referring physicians or the most recent managing physicians were contacted and requested for clinical data relating to the patients′ functional status. Data pertaining to individual patients were kept confidential.
Descriptive statistics are provided as mean and standard deviation and as median and range. The Pearson productmoment correlation test was used to calculate the correlation coefficient. To compare the two groups, the Student t-test was used. The Mann-Whitney rank sum test was used when variables could not assumed to be normally distributed. To compare more than two groups, the one-way analysis of variance (ANOVA) test was used.
For univariate analysis, TTP and survival curves were constructed using the Kaplan-Meier method. The prognostic importance of the clinicopathologic variables, such as RTOG RPA class (includes tumor pathology [GBM or not], KPS score, treatment modalities [eg, resection or biopsy only], and age), gender, maximum area of contrast enhancement on MRI, MET uptake ratio, and pretreatment volume of MET uptake, was analyzed using the Kaplan-Meier log-rank test. The prognostic impact of pretreatment volume of MET uptake and MET uptake ratio was tested by an approximation procedure with different cutoffs to determine the cutoff value best separating the patients in two prognostic groups.
For multivariate analysis, a logistic forward-stepwise multivariate Cox regression analysis (Wald method) was carried out to investigate which of these variables are independent prognostic factors with respect to TTP and survival time. All variables with a significance level of ≤ .05 in the log-rank test were included. Hazard ratios and their 95% confidence intervals (CIs) were calculated.
Statistical analysis was performed using SigmaStat software version 3.0 (SPSS Inc, Chicago, IL) and PASW Statistics software release 18.0.0 (SPSS Inc).
Results
Patient and Tumor Characteristics
The clinical data are presented in Table 1 and Table 3. Forty patients were identified and followed up until tumor progression (median of 6.0 months; range 1–33 months), death, or the beginning of palliative therapy (median of 8.0 months; range 1–47 months). The results of TTP and survival time after stratification in prognostically homogeneous patient subgroups in correspondence with the RTOG RPA classification (see Table 2) are shown in Table 3. The median age at the time of pretreatment MET-PET was 58.3 ± 13.4 years (range 34.6–80.1 years). The histologic diagnosis was based on either a resected (17 patients) or stereotaxic biopsy specimen (23 patients) obtained within 1 to 8 weeks after pretreatment MET-PET. Pathohistologically, WHO grade III and IV malignant gliomas were identified (GBM [n = 28/70%] and anaplastic astrocytoma [AA; n = 12/30%], respectively). A majority of 32 patients (80%) underwent radiotherapy postoperatively, with a median dose of 56 Gy.
Pretreatment Semiquantitative ROI Analysis and Volumetry of MET Uptake
The ratios between pretreatment MET uptake and contralateral cortical uptake ranged from 1.07 to 4.05 (mean 2.58 ± 0.79; median 2.61). In 2 of 40 patients (5%), MET uptake was below the threshold of 1.3 for the detection of tumor tissue in the contiguous tumor region. The results of the pretreatment MET volumetry in all tumors revealed a range of 0 to 116.81 cm3 (mean 42.56 ± 34.9 cm3; median 32.24 cm3).
The results of the ROI analyses and volumetry of MET uptake (threshold of ≤ 1.3) after stratification in prognostically homogeneous patient subgroups in correspondence with the RTOG RPA classification are shown in Table 3. After stratification in prognostically homogeneous patient subgroups RTOG 1 to 3, 4, and 5/6, respectively, no significant differences in MET uptake ratios between the three groups could be observed (p = .145, one-way ANOVA; Figure 2). The differences between the volumes of the MET uptake (threshold of ≤ 1.3) in the three groups were statistically significant (p = .027, one-way ANOVA; see Figure 2).

Box plots of [11C]-methionine (MET) uptake ratios (top) and volumes of MET uptake (bottom) after stratification in Radiation Therapy Oncology Group (RTOG) recursive partitioning analysis classes 1 to 3, 4, and 5/6 and in patients with glioblastoma multiforme (GBM) and anaplastic astrocytoma (AA). ANOVA = analysis of variance.
The mean uptake ratio of MET-PET was higher in patients with GBM than in patients with AA (2.71 ± 0.76, range 1.07–4.05 and 2.29 ± 0.83, range 1.25–3.32, respectively), albeit the difference was not statistically significant (p = .122, t-test; see Figure 2). In contrast, the mean pretreatment volume of MET uptake in patients with GBM was significantly higher than in patients with AA (43.63 ± 31.22 cm3, range 0–116.68 cm3 and 30.73 ± 38.85 cm3, range 0-116.81 cm3, respectively; p = .045, Mann-Whitney rank sum test; see Figure 2).
Assessment of Pretreatment MRI
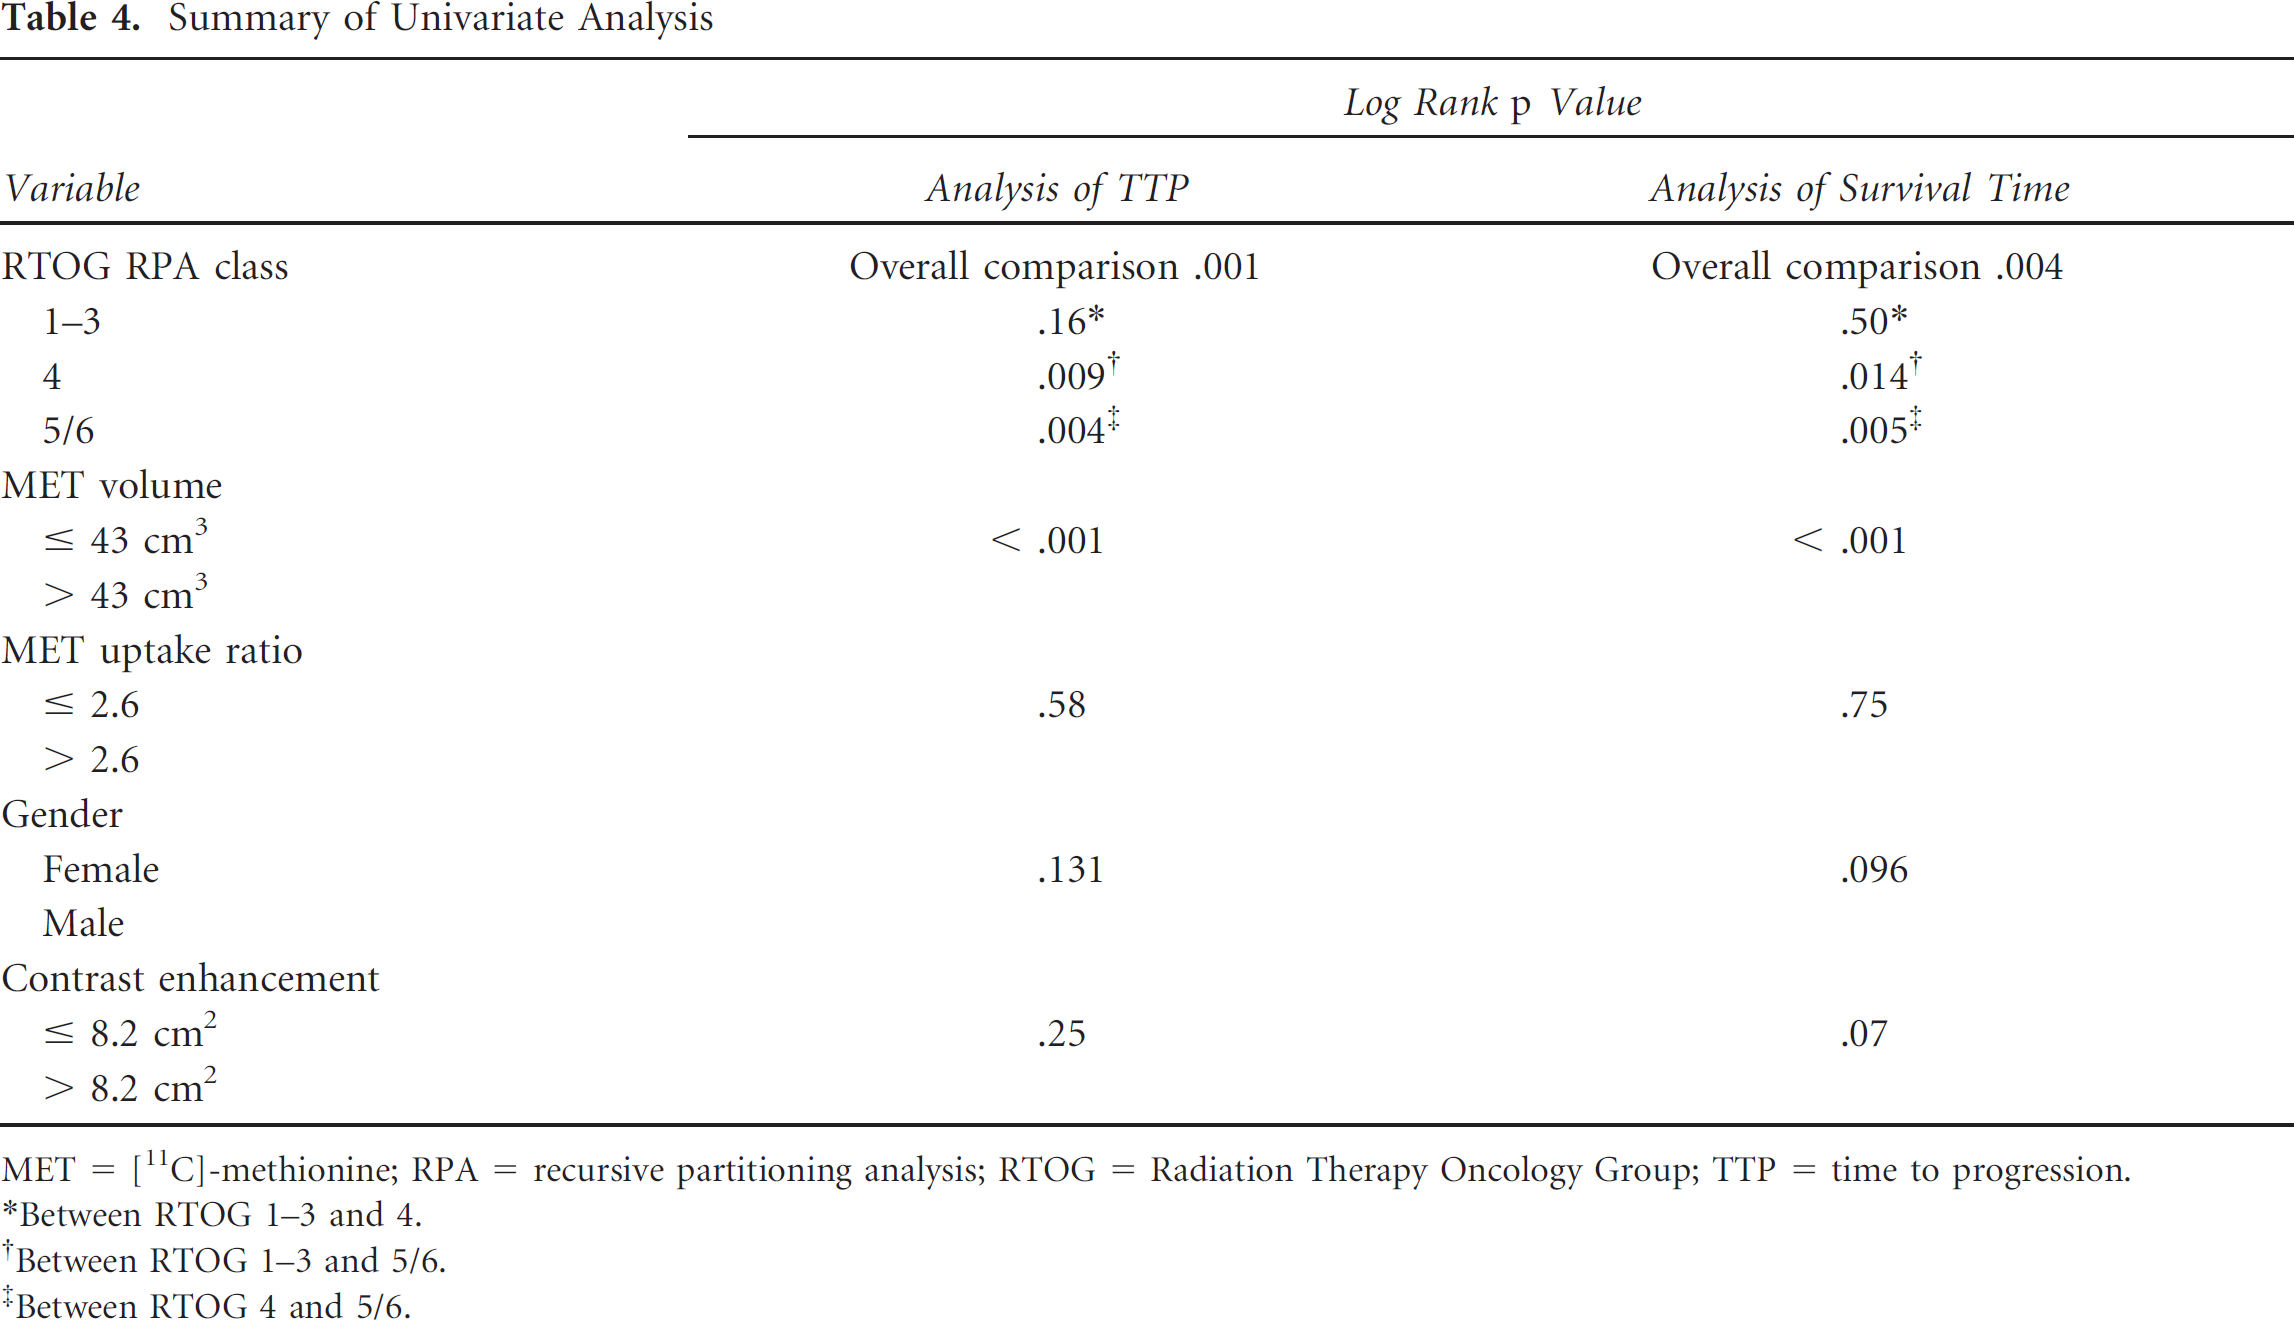
Retrospectively, pretreatment MRIs of 31 patients (78%) could be identified. In 19 patients, a contrast enhancement could be observed. The values of the maximum area of contrast enhancement on MRI ranged from 0 to 32.5 cm2 (mean 8.2 ± 9.4, median 4.2 cm2). Using the mean value of the maximum area of contrast enhancement on MRI as a cutoff value to separate the patients in two prognostic groups (≥ 8.2 cm2 [n = 18] vs > 8.2 m2 [n = 13]), Kaplan-Meier analyses revealed no significant differences in mean TTP and survival time between both groups (8.0 ± 1.4 vs 6.0 ± 1.2, p = .25 and 11.6 ± 2.3 vs 6.9 ± 1.5, p = .07, respectively, log-rank test) (Table 4). Testing of further cutoff values led to a strong disparity in group sizes and was discarded.
Summary of Univariate Analysis
MET = [11C]-methionine; RPA = recursive partitioning analysis; RTOG = Radiation Therapy Oncology Group; TTP = time to progression.
Between RTOG 1-3 and 4.
Between RTOG 1-3 and 5/6.
Between RTOG 4 and 5/6.
Prognostic Factors
Among the various prognostic factors, univariate analyses revealed that RTOG RPA class (includes tumor pathology [GBM or not], KPS score, treatment modalities [eg, resection or biopsy only], and age) and pretreatment volume of MET uptake showed significant differences in TTP and survival time. However, pretreatment semiquantitative MET uptake ratio and gender showed no significant differences (see Table 4 and Figure 3).

Kaplan-Meier plots of time to progression (TTP) and survival time for pretreatment mean [11C]-methionine (MET) uptake volume of patients stratified below or above the mean MET uptake volume of all patients/threshold of 43 cm3 (top) and below or above the mean MET uptake ratio of all patients/threshold of 2.6 (bottom.
In detail, an overall statistically significant difference in TTP and survival time could be observed between RTOG RPA classes 5/6 and 4 and between classes 5/6 and 1 to 3, respectively (p = .001 and .004, respectively, log-rank test). Subgroup analysis revealed no significant difference in TTP and survival time between RTOG RTA classes 1 to 3 and 4 (p = .16 and .50, respectively, log-rank test) (see Table 4).
After an approximation procedure to determine the cutoff value best separating the patients in two prognostic groups, Kaplan-Meier analyses of pretreatment MET uptake volumes revealed a best cutoff value with the highest significance at a threshold of 43 cm3 (mean pretreatment MET uptake volume of all patients). Using this threshold, patients with a MET uptake volume higher than 43 cm3 showed shorter TTP and survival time (p < .001 and p < .001, respectively, log-rank test) (see Figure 3, Table 4, and Table 5). In contrast, semiquantitative MET uptake ratio results at different cutoff values were not significantly related to TTP or survival time (p > .05, log-rank test) (see Figure 3, Table 4, and Table 5). The results of prognostic impact of pretreatment volumes of MET uptake and MET uptake ratios tested at different cutoffs are detailed in Table 5. Using the best cutoff value of 43 cm3, an analysis of the subgroup RTOG RPA 5/6 (n = 18) revealed significant results for both TTP (p = .006) and survival time (p < .001). In contrast, after stratification using MET uptake ratio (≥ 2.6 vs > 2.6) of subgroup RTOG RPA 5/6, no significant differences of both TTP (p = .84) and survival time (p = .89) could be observed. Due to the small sample size and disparity of subgroup size, these findings should be interpreted cautiously.
Summary of Prognostic Impact of Pretreatment Volumes of MET Uptake and MET Uptake Ratios Tested at Different Cutoffs

MET = [11C]-methionine; TTP = time to progression.
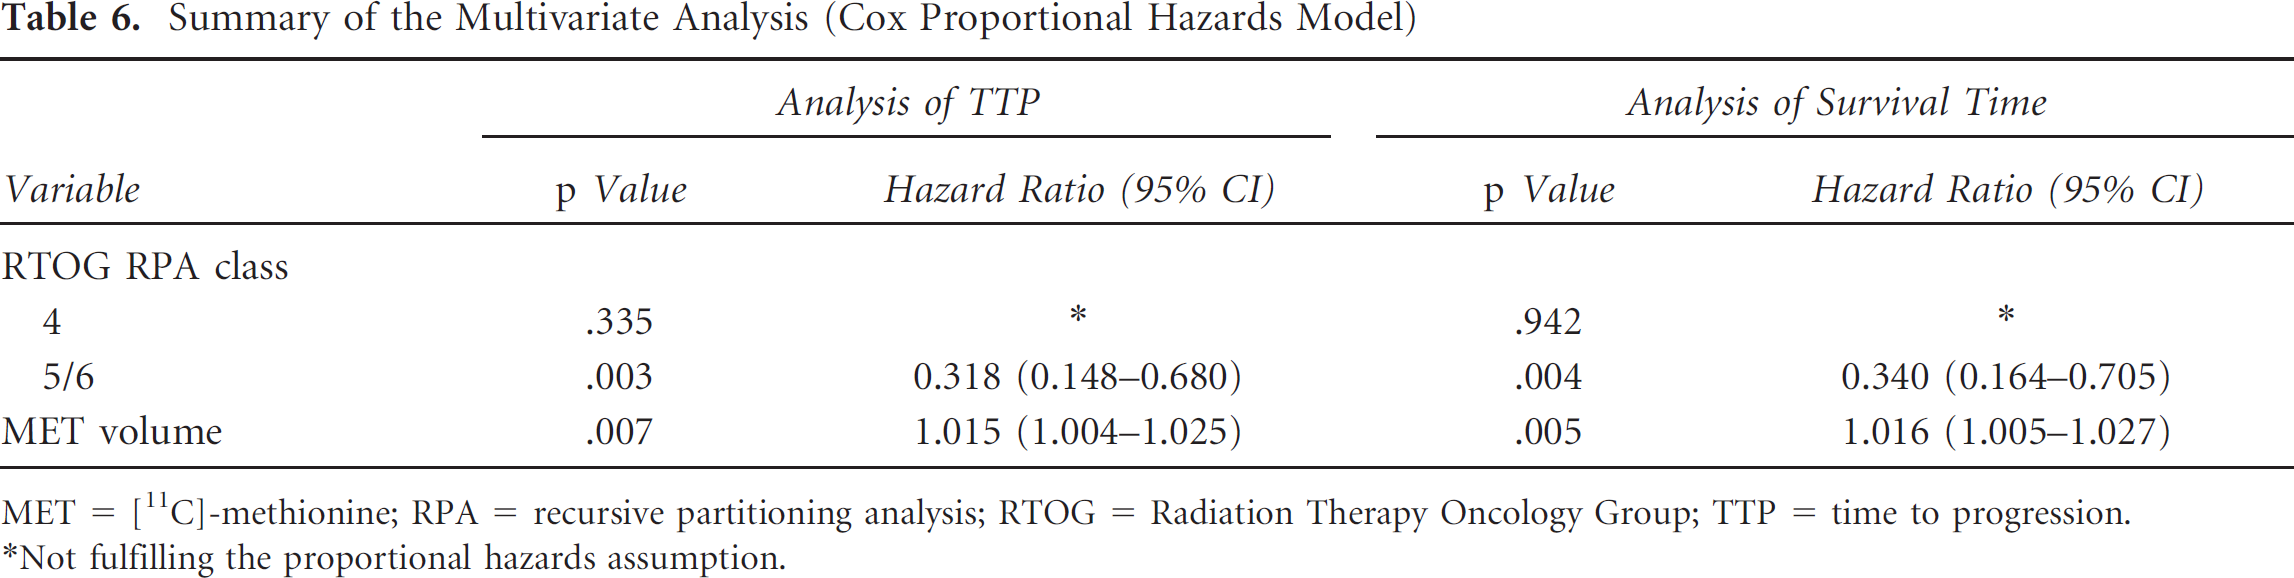
By multivariate Cox regression analysis, RTOG RPA classes 5/6 and pretreatment volume of MET uptake were shown to be significant independent predictors of a shortened TTP and survival time. Values of p, hazard ratios, and 95% CIs are presented in Table 6. In contrast, RTOG RPA class 4 was not shown to be an independent prognostic factor (see Table 6).
Summary of the Multivariate Analysis (Cox Proportional Hazards Model)
MET = [11C]-methionine; RPA = recursive partitioning analysis; RTOG = Radiation Therapy Oncology Group; TTP = time to progression.
Not fulfilling the proportional hazards assumption.
Discrepancies between MET Uptake Ratios and Volumetry of MET Uptake
We identified discrepancies between MET uptake ratios and volumetry of MET uptake in the patient population with a favorable outcome (defined as median TTP/survival time in this population > median of TTP/survival time of all patients). In five patients (13%), the MET uptake ratios were higher than the median MET uptake ratio (2.61) of all patients. In contrast, in these patients, the pretreatment volumetry of MET uptake revealed a metabolically active tumor volume below the median volume (32.24 cm3) of all patients.
Correlation between Pretreatment MET Uptake, MET Volume, and Outcome
The pretreatment volume of MET uptake of all patients correlated significantly with TTP and survival time (r = −.418, p = .007 and r = −.412, p = .008, respectively, Pearson correlation). In contrast, semiquantitative analysis of pretreatment MET uptake ratio showed no significant correlation with TTP and survival time (r = −.281, p = .079 and r = −.248, p = .122, respectively, Pearson correlation).
After stratification of all patients according to RTOG RPA classes 1 to 3, 4, and 5/6, pretreatment volume of MET uptake of patients stratified to RTOG RPA classes 4 and 5/6 was significantly correlated with TTP and survival time (RTOG RPA class 4: r = −.531, p = .05 and r = .528, p = .05, respectively; RTOG RPA class 5/6: r = .581, p = .012 and r = −.628, p = .005, respectively; Pearson correlation). A correlation between pretreatment volumes of MET uptake of patients stratified to RTOG RPA classes 1 to 3 and TTP and survival time could not be observed (r = −.139, p = .743 and r = −.124, p = .770, respectively; Pearson correlation). Both median and mean TTP and survival times for each subgroup are presented in Table 3. After stratification according to RTOG RPA classes, no significant correlations between semiquantitative pretreatment MET uptake ratios and TTP and survival time were observed.
Additionally, besides the significant correlation between pretreatment volume of MET uptake and TTP and survival time, in all patients, a significant correlation between pretreatment volume of MET uptake and scores of the KPS could be observed (r = −.567, p = .0001). In contrast, semiquantitative pretreatment MET uptake ratios and KPS scores were not significantly correlated (r = −.299, p = .061).
Discussion
Established, good prognostic factors of malignant gliomas are limited 24 but include young age,15,25 high KPS score,15,25 high mini-mental state examination score, 25 O6-methylguanine DNA methyltransferase (MGMT) promoter methylation,26,27 and resection of > 98% of the tumor.28,29 There are ongoing efforts to identify biologic and genetic alterations in the tumors that may provide additional prognostic information and guidance in making decisions about optimal therapy. 30 For example, in recent years, extensive molecular studies have aimed at identifying diagnostic and prognostic markers in malignant gliomas. Chromosome 1p19q codeletion, MGMT status, and mutations of isocitrate dehydrogenases 1 and 2 (IDH1/IDH2) are currently the three most pertinent markers in malignant gliomas. 31 In addition to molecular markers in malignant gliomas, MET-PET is an excellent tool to monitor the metabolic activity of gliomas and, therefore, has the potential to add important prognostic information.
Among several clinical and metabolic factors, we found in our study that apart from stratification in a higher RTOG RPA class, pretreatment volume of MET uptake had prognostic value in patients with malignant glioma. The prognostic value of patient stratification in RTOG RPA classes has been shown previously. 15 Higher pretreatment volume of MET uptake was a significant prognostic factor identified by both univariate and multivariate analyses and was found to be an independent prognostic factor for TTP and survival. In contrast, in our study, the prognostic value of pretreatment semiquantitative MET uptake ratio, which was demonstrated in some of the previous studies investigating this issue, could not be observed. This finding is in line with our hypothesis that volumetry of pretreatment MET uptake provides a better prognostic value than a semiquantitative ROI analysis for assessment of MET uptake ratio.
In contrast to those studies that previously reported a predictive value of pretreatment MET uptake ratios,11–14 the missing predictive value of semiquantitative MET uptake ratio in our study may reflect the selected study population with predominantly high-grade gliomas.
Besides the fact that 70% of all patients were suffering from GBM, 80% of all patients were stratified to RTOG RPA classes 4 to 6 with poor prognosis. In our patient sample, mean MET uptake ratios in patients with GBM and AA appeared relatively high, with differences between the two groups not being significant (GBM 2.71 ± 0.76, AA 2.29 ± 0.83; p = .122). In comparison with previous studies, De Witte and colleagues reported lower mean MET uptake ratios in patients with AA (1.88) and GBM (2.37). 14 Kim and colleagues observed in a mixed population of patients with WHO grade III glioma a lower mean MET uptake ratio of 1.67 relative to patients with GBM and a ratio of 2.16. 11 In our patient sample with malignant gliomas, a semiquantitative ROI analysis to determine the MET uptake index may be more difficult and may have less power due to increased sources of error.
For example, large zones of hypermetabolic areas or hypometabolic necrosis in malignant gliomas 14 may influence the quantification of MET uptake due to an inappropriate ROI localization; in consequence, uptake ratios may vary considerably. Furthermore, as previously reported, assessment of predictive value using a semiquantitative ROI analysis in WHO grade IV tumors was not significant. 14 In a previous study, Kim and colleagues showed that an only visually assessed, nonquantitative hypermetabolic pattern in malignant gliomas has a negative predictive value; however, the predictive value of the MET uptake ratios in this group was not tested. 11 Based on our findings, three-dimensional assessment of the pretreatment volume of MET uptake seems to be more suitable to add prognostic informations in patients with high-grade glioma and unfavorable prognostic factors.
The finding that pretreatment volume of MET uptake had prognostic value in patients with malignant glioma is stressed by significant correlations between pretreatment volume of MET uptake and TTP/survival time and KPS scores. A better clinical condition as determined by a higher KPS score in combination with a lower pretreatment metabolically active tumor volume may be a favorable constellation for an improved outcome.
From the biologic point of view, brain tumors with large volumes may cause a deprivation of adequate oxygen and nutrient supply to healthy brain parenchyma, which occurs when the tumor makes use of nearby blood vessels for its supply of blood and other nutrients. Thus, the neoplasm enters into competition for nutrients with the surrounding healthy brain tissue. Furthermore, a large brain tumor may cause release of metabolic end products (eg, free radicals, altered electrolytes, neurotransmitters). Hence, this release and a recruitment of cellular mediators (eg, cytokines) may disrupt normal parenchymal function. Finally, due to brain tumors with a large volume, more secondary neurologic symptoms due to mass effects may occur, for example, increased intracranial pressure with compression of healthy brain tissue. Therefore, to improve therapeutic strategies, diagnostic procedures to detect the tumor extent three-dimensionally are needed.
For example, amino acid–PET–derived three-dimensional information may help delineate more precisely the tumor extent and may thereby help improve the planning of neurooncologic treatments, for example, radiotherapeutic interventions. In various other recently presented studies, amino acid–PET data were successfully combined with MRI data to provide specific information for defining the target volume for radiosurgery and neuronavigation surgery in patients with brain tumors such as meningiomas and high-grade gliomas.6,8,32,33 Additionally, in a recent study, metabolic information derived from MET-PET helped the surgical planning using PET-guided volumetric resection of high-grade gliomas. 7 It could be demonstrated that a complete resection according to PET tracer uptake in high-grade gliomas increases survival, whereas a complete resection according to MRI contrast enhancement does not. 7
Another implication of tumor volume measured using MET-PET might be the differentiation between less aggressive tumors and more aggressive tumors. The semiquantitative ROI analysis of MET uptake is commonly used for prognostic evaluation.9,11–13 Tumors with a higher MET uptake are supposed to be more aggressive. However, we found discrepancies between MET uptake ratios and volumes of MET uptake. In 13% of all patients, MET uptake ratios were higher than the median MET uptake ratio (2.61) of all patients and the pretreatment metabolically active tumor volumes were below the median volume (32.24 cm3) of all patients. All of these patients had a favorable outcome.
A restriction of our study is that the study population spans a wide gap between the years 1995 and 2006, and in that period of time, a few advances in therapy of malignant gliomas have occurred (eg, treatment according to the EORTC trial 22 981/2698134,35). Additionally, a maximal tumor resection was, however, not performed in more than 50% of all patients but only stereotaxic biopsy to obtain histology. This might reflect a potentially less representative patient group. Therefore, our results need to be confirmed through future prospective studies that include an identically treated patient collective.
Due to the relatively short half-life of 11C-labeled amino acids (20 minutes), the use of MET is restricted only to a few centers with a cyclotron unit. Novel 18F-radiolabeled amino acids are more convenient and may be an alternative to MET-PET in the near future. For example, tracer uptake, especially in malignant gliomas without contrast enhancement on MRI, has been shown in PET imaging studies with the tracer O-(2-[18F]fluoroethyl)-L-tyrosine (FET).36,37 Additionally, it was recently demonstrated that FET-PET and MET-PET provide comparable diagnostic information on gliomas and brain metastases. 38 Like MET-PET, FET-PET can be used for differentiation of residual or recurrent tumor from treatment-related changes or pseudoprogression, as well as for delineation of gliomas. 38
In contrast to the pretreatment volume of MET uptake, in our study, the maximum area of contrast enhancement on MRI was not significantly related to prognosis. Due to the limitations of conventional MRI, the assessment of tumor size and extent may be limited. Numerous studies have observed that glioma cells are commonly found beyond the enhanced portion of the tumor.39,40 In comparison with MRI, MET-PET delineates the tumor extent more precisely. 41 To overcome the limitations of conventional MRI, several advanced MRI techniques are presently evaluated to assess various functional parameters of gliomas before treatment. For example, a promising approach appears to be perfusion-weighted imaging (PWI), and recent reports have highlighted its potential, 42 but the clinical relevance of these methods is not yet established. Developments of advanced MRI techniques are rather encouraging, and comparative studies are needed to investigate the relationship, diagnostic performance, and complementary character of amino acid-PET and modern MRI techniques. Furthermore, in comparison with Gd-DTPA, other Gd-based magnetic resonance contrast agents (eg, gadobenate dimeglumine–enhanced MRI) may provide a more intense contrast enhancement and a better tumor contrast, which might be of importance for the further management of patients with malignant glioma. 43
Conclusion
In contrast to the commonly used semiquantitative ROI analysis of MET uptake for prognostic evaluation, three-dimensional assessment of the pretreatment volume of MET uptake was found to be an independently significant prognostic factor, especially in the subgroup of patients with a high-grade malignant glioma (AA and GBM) and unfavorable prognostic markers (higher than RTOG RPA class 3). It should be noted that the patient sample in this study was relatively small, patient data were collected retrospectively, and the proportion of high-risk patients in our study was higher than in previous MET-PET studies for the assessment of prognostic factors (80% were stratified to RTOG RPA classes 4 to 6). However, on the other hand, in this subgroup of patients with an unfavorable prognosis, additional information concerning prognostic factors may be clinically very important. Therefore, our results suggest that three-dimensional assessment of the pretreatment volume of MET uptake as a biologic prognostic marker may be helpful in combination with established clinical prognostic factors to improve treatment in glioma patients. Its clinical value should be evaluated in prospective studies.
Footnotes
Acknowledgment
Financial disclosure of authors and reviewers: None reported.