
Abstract
Although laboratory data clearly suggest a role for oxidants (dioxygen and free radicals derived from dioxygen) in the pathogenesis of many age-related and degenerative diseases (such as arthrosis and arthritis), methods to image such species in vivo are still very limited. This methodological problem limits physiopathologic studies about the role of those species in vivo, the effects of their regulation using various drugs, and the evaluation of their levels for diagnosis of degenerative diseases. In vivo electron paramagnetic resonance (EPR) imaging and spectroscopy are unique, noninvasive methods used to specifically detect and quantify paramagnetic species. However, two problems limit their application: the anatomic location of the EPR image in the animal body and the relative instability of the EPR probes. Our aim is to use EPR imaging to obtain physiologic and pathologic information on the mouse knee joint. This article reports the first in vivo EPR image of a small tissue, the mouse knee joint, with good resolution (≈ 160 μm) after intra-articular injection of a triarylmethyl radical EPR probe. It was obtained by combining EPR and x-ray micro-computed tomography for the first time and by taking into account the disappearance kinetics of the EPR probe during image acquisition to reconstruct the image. This multidisciplinary approach opens the way to high-resolution EPR imaging and local metabolism studies of radical species in vivo in different physiologic and pathologic situations.
IN VIVO ELECTRON PARAMAGNETIC RESONANCE (EPR) IMAGING and spectroscopy 1 emerged during the 1990s. These methods are now regarded as unique and noninvasive approaches for locating, characterizing, and possibly quantifying paramagnetic species such as nitric oxide, 2 dioxygen,3,4 and free radical species derived from dioxygen, ascorbic acid, or melanin 5 in living organisms. The concentration and fate of those species are very important factors in physiologic signaling and in pathologic situations such as joint and neurodegenerative diseases, 6 cancer, 7 and tissue inflammatory processes. 8 Thus, their detection and measurement are crucial for the development of new diagnostic methods and treatment perspectives.
An EPR image is recorded like an EPR spectrum, using an additional magnetic field gradient in a set of different orientations around the sample (see Supplementary Methods online). The acquisition can be expressed as a convolution of the EPR line shape with the species quantity along the axis of the gradient.
Two main problems are frequently encountered in in vivo EPR imaging of small tissues or organs. The first one is linked to the relative instability of the observed radicals or EPR probes because of their possible metabolism during the time necessary to make a three-dimensional (3D) image of the tissue of interest. Tomographic continuous-wave EPR imaging acquisition time may vary from minutes to hours. The disappearance of the observed paramagnetic signal as a function of time leads to severe image distortions. Yet faster acquisition of the EPR data generally leads to lower image resolution, despite some recording9–12 and postprocessing13–16 methods that were proposed recently (but are not routinely implemented). The second problem is related to the anatomic location of the obtained EPR image in the whole body of the studied animal. The use of combined EPR imaging and magnetic resonance imaging as a solution to this problem was reported recently.17–19
This article describes a study of the mouse knee joint by in vivo EPR imaging using a triarymethyl radical, the tris-(p-carboxyltetrathiaaryl)methyl radical (TAM) (Figure 1), which is well known as an oximetry probe.20,21 TAM has interesting physicochemical and spectroscopic properties. Its EPR spectrum displays a single narrow line, leading to a good signal to noise ratio and high image resolution as resolution in EPR imaging is equal to the peak-to-peak line width divided by the gradient strength. The new methodology used in this study to obtain these high-resolution EPR images partly solves the above-mentioned problems, first by reconstructing the original image after evaluation of the disappearance kinetics of the probe and then by combining EPR imaging and x-ray micro–computed tomography (micro-CT) of the same mouse. This method is based on a multidisciplinary approach, from mathematics to biology. It may be used as an indication of the biologic environment of the EPR probe because it determines the local disappearance kinetics of the TAM probe in the mouse knee joint. Thus, this method opens the way to physiologic and pathologic studies of the knee joint in degenerative diseases (arthritis and arthrosis) and of other tissues.

Formula of tris-(p-carboxyltetrathiaaryl)methyl radical (TAM).
Materials and Methods
Animals
All experiments performed in the present study were approved by the Préfecture de Police-Direction Départementale des Services Vétérinaires de Paris (agreement #B75-06-07) and by the Comité Régional d'Ethique pour l'Expérimentation Animale d'Ile de France (agreement #P2.YF.144.10). Five-week-old (20–25 g) male C57BL/6J mice were purchased from Charles River laboratories (Arbresles, France). The mice were housed in the animal facilities of the UFR Biomédicale des Saints Pères (Université Paris Descartes), at a maximum of four littermates per cage, with nutritionally complete purified diet 4RF21 (Mucedola s.r.l., Settimo Milanese, Milano, Italy) and water ad libitum and at constant temperature (22°C) with a 12-hour light, 12-hour dark cycle. Three groups of three mice were explored for 7 days, 11 days, and 13 days, respectively, after their arrival. One isolated mouse was studied on the fourteenth day.
Anesthesia
We used anesthetic and physiologic monitoring devices provided by Minerve (Esternay, France). The gas flow was controlled using a Mix3000 gas mixing device (Messer France SAS, Puteaux, France). The mice were preanesthetized in a chamber at 2.5% of isoflurane and then transferred to a thermoregulated bed; anesthesia was maintained during the whole experimentation with 1% isoflurane.
Injections
Injections in the inner side of one knee joint were made using a 10 μL microsyringe, 1801RN, fitted with a 100 μm diameter RN 803-05/00 needle (Hamilton, Reno, NV). TAM solutions were prepared using home-synthesized TAM according to an already published protocol. 20
Retailed Chemicals
4-Oxo-2,2,6,6-tetramethylpiperidine-1-oxyl radical (tempone), ascorbic acid, and glutathione were obtained from Sigma-Aldrich (St Louis, MO) and were of the highest grade purity commercially available.
Micro-CT imaging
Micro-CT imaging was obtained using a 1178 X-ray computed tomograph (Skyscan, Kontich, Belgium) with settings at 50 kV, 615 μA, pixel size 80 μm. Raw micro-CT images were processed using the Skyscan software suite (Nrecon, CTAn, and CTVol).
EPR Spectroscopy and Imaging
EPR spectra were recorded at 1 GHz using a Bruker (Rheinstetten, Germany) E540 spectrometer fitted with a 23 mm bird cage resonator or a surface coil (6 mm inner diameter). Data, unless otherwise stated, were treated using Xepr. Homogeneity of the surface coil over the region of interest (6 × 6 × 4 mm) in the field of view (6 × 6 × 6 mm) was checked; the intensity variation in the region was found to be less than 10%.
The in vivo image was obtained using 0.10 T/m gradient strength, with 625 tomographic projections on theta and phi angles to obtain a 3D image. Standard in vivo images were recorded using 0.11 T/m gradient strength with 529 projections to obtain a voxel size of 163 μm. A 3D image of the solution in the cuvette was obtained by applying a 0.14 T/m gradient strength and using a tomographic revolution of 441 projections. The theoretical resolution of EPR imaging indicated in the Results and Discussion sections (160 μm) was the line width of the TAM EPR signal to gradient strength ratio. An experimental resolution was also evaluated on the basis of the image of the 1 mm diameter capillaries containing a TAM solution and used for positioning the mouse knee. The capillaries diameter was measured to be 1,000 ± 100 μm, and the experimental resolution was estimated to be between 100 and 200 μm.
Mathematical Procedure
In the processing of the data coming from the in vitro model experiments, we applied a manual technique for the estimation of the nitroxide radical decay. This technique is based on the double integration of the EPR imaging data, followed by a monoexponential fitting of integrated signals with respect to the acquisition time. Such a technique was no longer adapted when dealing with in vivo EPR images of TAM in mouse knee joints where the signal to noise ratio was low. The integration dramatically modified the nature of the noise in such a way that it became difficult to monitor and separate from the true signal. Therefore, we proposed a second technique, which is based on a direct deconvolution of EPR imaging data rather than its integration. The deconvolution was done using a well-suited Wiener filter, which is a pseudoinverse of the EPR line shape. 22 This allowed us to directly estimate spatial distributions of radical species along gradient axis directions. However, given that the zero-frequency component of the EPR line shape was null, distributions were recovered only up to a constant. Hence, we also set an original technique to estimate constants using parts of signals where there is only noise. Finally, the kinetics were evaluated by fitting a monoexponential decay to deconvolved signal integrals according to acquisition time.
The Wiener filter has several features. Its definition is based on a denoised reference spectrum obtained using hard thresholdings on wavelet coefficients. 23 It is also adapted to each acquisition by including statistics of the EPR imaging data. In addition, the technique is completely automated and includes the estimation of optimal parameters.
Informatics Procedure
The Bruker EPR raw data were exported in a .csv file and transformed into a sequence of .bmp format images. The program was developed as an ImageJ plugin (National Institutes of Health, Bethesda, MD). The images were then compatible with CTAn software. This software permits the rendering of a 3D representation from the different slices. Finally, the EPR 3D and the CT 3D representations were registered and manually adjusted with CTVol.
Results
3D EPR Imaging of TAM in Mouse Knee Joint and Fusion with X-Ray Micro-CT Imaging of the Same Animal
To minimize the number of animals used in this study, all of the EPR experiments and parameters were optimized on an EPR tube containing two plastic balls (2 mm diameter) in a 2 mM TAM solution in phosphate buffer pH 7.4, providing an adequate model (1:1 scale) of the space between the tibia and the femur of the mouse knee joint (100–200 μm, for a volume ca 8 μL). Preliminary experiments allowed us to choose the volume (1 μL) of the TAM solution injected into the mouse knee joint and the concentration of TAM (500 mM) in this solution. The double integration of the observed signal (Figure 2) compared to the reference signal corresponded to a 3 mM TAM concentration in the knee joint. The line width of the TAM signal was 15 μT, indicating a local dioxygen concentration of 150 μM. For in vivo experiments, 1 μL of a saline solution containing 0.5 M TAM was injected intra-articularly in mice under gaseous (1% isoflurane in air) anesthesia. An EPR spectrum was recorded before and after EPR image recording (90 minutes) at 1 GHz using a Bruker E540 spectrometer fitted with a 23 mm bird cage resonator. Two 1 mm inner-diameter glass capillaries containing a 2.5 mM TAM solution in water were set next to the mouse knee to allow spatial registration of the EPR images relative to those obtained from the same mouse by micro-CT. The EPR spectra recorded with a gradient at different orientations were deconvolved using the EPR reference spectrum recorded before imaging. They were then filtered using back-projection with the Xepr software. This gave frontal and medial (inner side) views of the raw EPR image of a mouse knee joint after injection of TAM and of the two glass capillaries containing TAM on both sides of the mouse knee (Figure 3A).

EPR spectrum of TAM injected in the mouse knee joint obtained (a) before and (b) after acquisition of the image data (around 90 minutes).
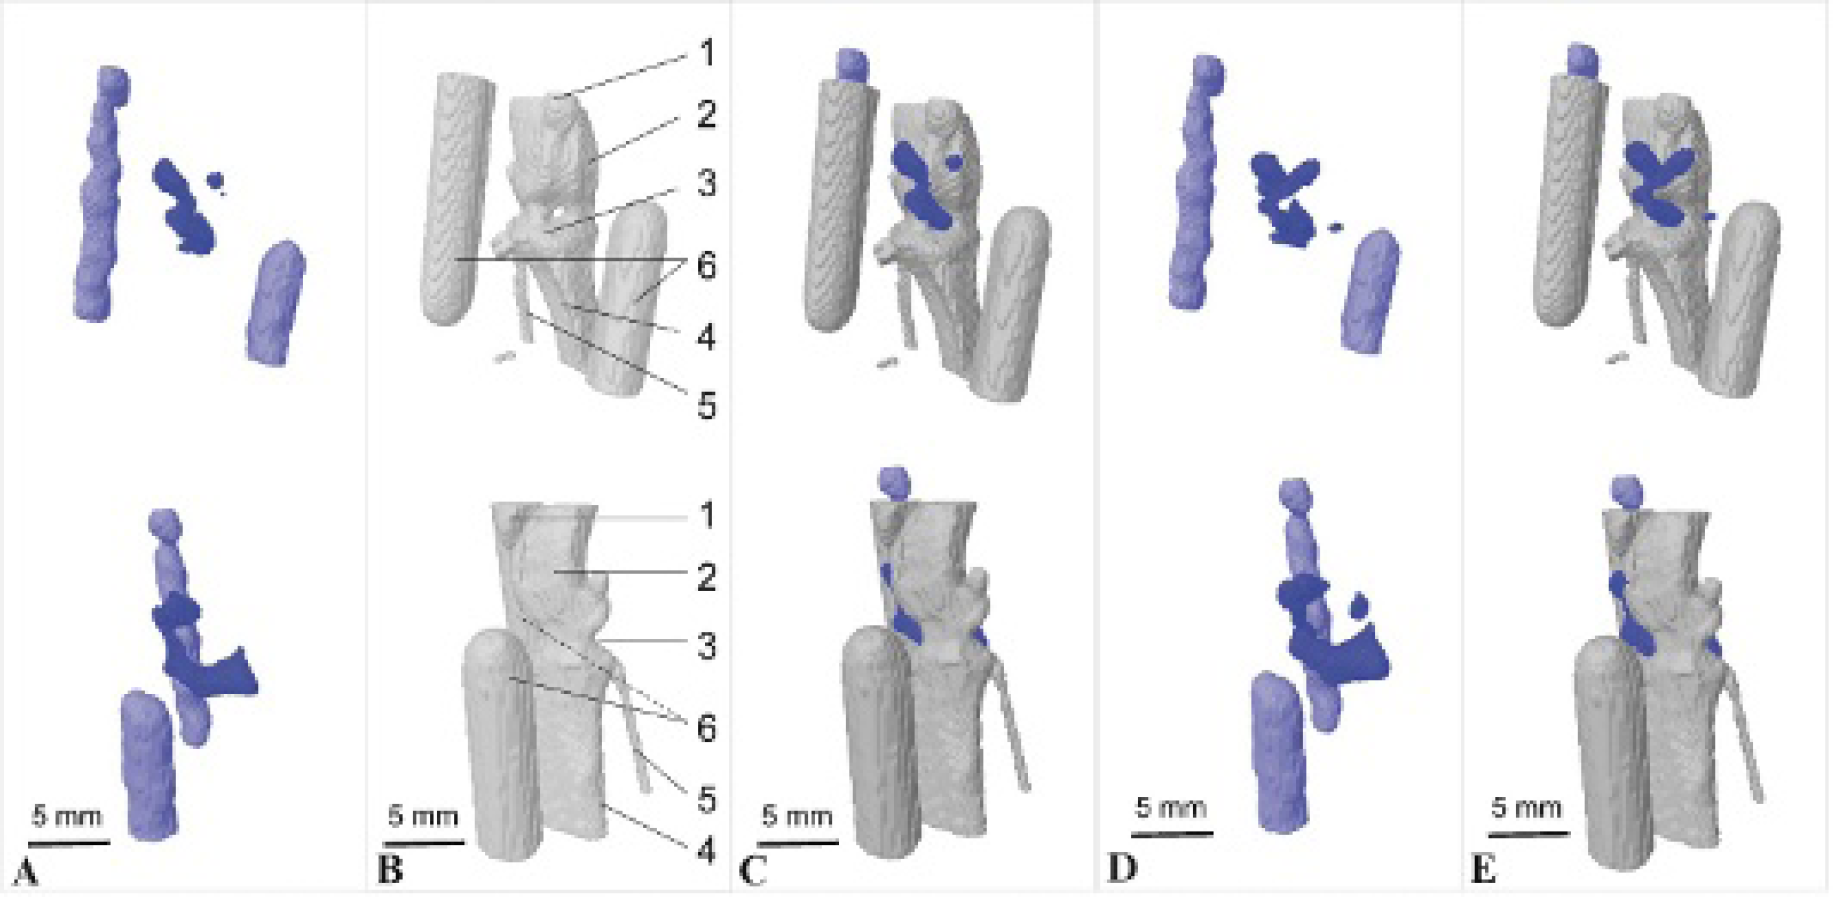
In vivo molecular EPR images of the mouse knee joint after intra-articular injection of TAM. A, Frontal (upper) and medial (lower) views of the raw EPR image of the mouse knee joint and of two glass capillaries containing a TAM solution that were placed on each side of the mouse knee joint to locate it. B, Anatomic x-ray micro-CT image of the same mouse knee and capillaries. C, Spatial registration and fusion of the raw EPR and micro-CT images using capillaries as fiducial points. D, Molecular EPR image of the mouse knee joint after mathematical reconstruction of the image taking into account TAM disappearance during data acquisition. E, Spatial registration of image D to the micro-CT anatomic image (B) of the same mouse knee. On B, 1 = patella; 2 = femur; 3 = joint cavity; 4 = tibia; 5 = fibula; 6 = reference capillaries. A small volume of TAM is detected away from the bone on the inner side of the knee (see D and E). This could be a small drop of radical located on the skin, where the needle was inserted.
Micro-CT images were obtained using a Skyscan 1178 X-ray computed tomograph. Figure 3B displays the micro-CT image of the same mouse, still under anesthesia, in the same bed and position, surrounded by the two capillaries. The EPR imaging data were processed to obtain a 3D image (see Figure 3A), which was used for fusion and manual spatial registration of the EPR image (giving the spatial distribution of TAM in the mouse knee joint) and of the anatomic micro-CT image (displaying the bones of the same mouse and the same capillaries) (Figure 3C). A video showing the superimposition of the EPR and micro-CT images without the capillaries and using semitransparency of the micro-CT image to better see the 3D EPR volume can be downloaded in the supplementary material (see Supplementary Video 1 online).
Most of the EPR signal disappeared during image recording, as can be seen on successively recorded EPR spectra (see Figure 2). TAM in the mouse knee joint could decrease with time because of metabolism and/or diffusion. To simplify the protocol, we repeated the experiment on 10 mice without the capillaries. The removal of the capillaries allowed the use of a 6 mm inner-diameter surface coil with higher sensitivity and easier positioning of the mouse knee. Under these conditions, we observed the same shape for the EPR images obtained from the 10 mice. The intensity of the TAM signal of the EPR spectrum measured after recording the image, which takes about 90 minutes, was only 25% of that of the initial EPR signal of the spectrum taken before image recording. This decrease in TAM amounts as a function of time was similarly observed in the 10 mice used in this study (25 ± 10%).
This disappearance of TAM could be explained by data in the literature showing that TAM is rapidly reduced or oxidized to diamagnetic metabolites.24,25 Such a decrease in the EPR signal during the experiment is a problem for EPR imaging as it should induce artifacts in the obtained EPR image. Thus, the following in vitro EPR imaging study of simple ultraviolet (UV)-visible spectrometer cuvettes containing a free radical disappearing as a function of time was performed to find a solution to this problem.
Model EPR Imaging of an Object Containing a Free Radical Disappearing during the Study: Estimation of the Disappearance Kinetics from the Imaging Data and Reconstruction of the Image
Because of difficulties encountered in the search of conditions to obtain a controlled disappearance of TAM in the time scale of EPR imaging in vitro, we used the nitroxide radical, 4-oxo-2,2,6,6-tetramethylpiperidine-1-oxyl (tempone), to model the radical disappearance effect during imaging. Plastic UV-visible spectrometer cuvettes (1 cm) were filled with 1 mL of a 2 mM solution of tempone in 0.1 M phosphate buffer, pH 7.4. This radical is stable during the recording time of the cuvette EPR image using a 23 mm bird cage resonator. The tempone radical can be easily reduced to the corresponding diamagnetic hydroxylamine by ascorbic acid and glutathione. 26 Reduction of 75% of the tempone radical during the time necessary for image recording (about 90 minutes, as in the in vivo experiment) was obtained by the addition of 3 mM glutathione and 0.3 mM ascorbic acid. 3D EPR images of a cuvette that contained only the stable nitroxide solution (Figure 4A) were obtained. As expected, they exhibited a square shape with the meniscus at the top. By contrast, the 3D EPR image of a cuvette containing the nitroxide, glutathione, and ascorbic acid (Figure 4B) exhibited distorted shapes, low contrast, and abnormal inhomogeneity compared to the initial image (see Figure 4A). The difference image is shown at the bottom of Figure 4 (Figure 4D) and has 22% pixel difference from the initial image. These reconstruction artifacts are most likely due to the disappearance of the radical probe during tomographic data acquisition. It was possible to follow the disappearance kinetics of the nitroxide radical in the presence of glutathione and ascorbic acid by recording temporal EPR spectra (spectra as a function of time). Without glutathione and ascorbic acid, the value of the double integral of the signal, related to the concentration of tempone, remained constant (see Figure 5A). In the presence of glutathione and ascorbic acid, the tempone signal rapidly disappeared with a half-life time of 40 minutes (see Figure 5B). This value can be extracted from the monoexponential fitting (α t = e(−at)α0; see Supplementary Methods, equation 6, online), using the formula t1/2 = ln(2)/α. The kinetics of tempone disappearance was also deduced from the EPR imaging data by standard double integration of the EPR signal (see Figure 5C). Both curves representing the disappearance of the probe (see Figure 5, B and C) are almost superimposable. This shows that the disappearance kinetics of the tempone radical can be measured by double integration either of the temporal EPR spectra or of the EPR imaging data.

Views of the experimental EPR images of a UV-visible spectrometer cuvette containing (A) 2 mM tempone alone or (B) a mixture of 2 mM tempone, 3 mM glutathione, and 0.3 mM ascorbic acid. C, Image from the same cuvette as in B obtained after kinetic reconstruction of the image taking into account tempone disappearance during data acquisition. D shows the difference between B and A, and E shows the difference between C and A.
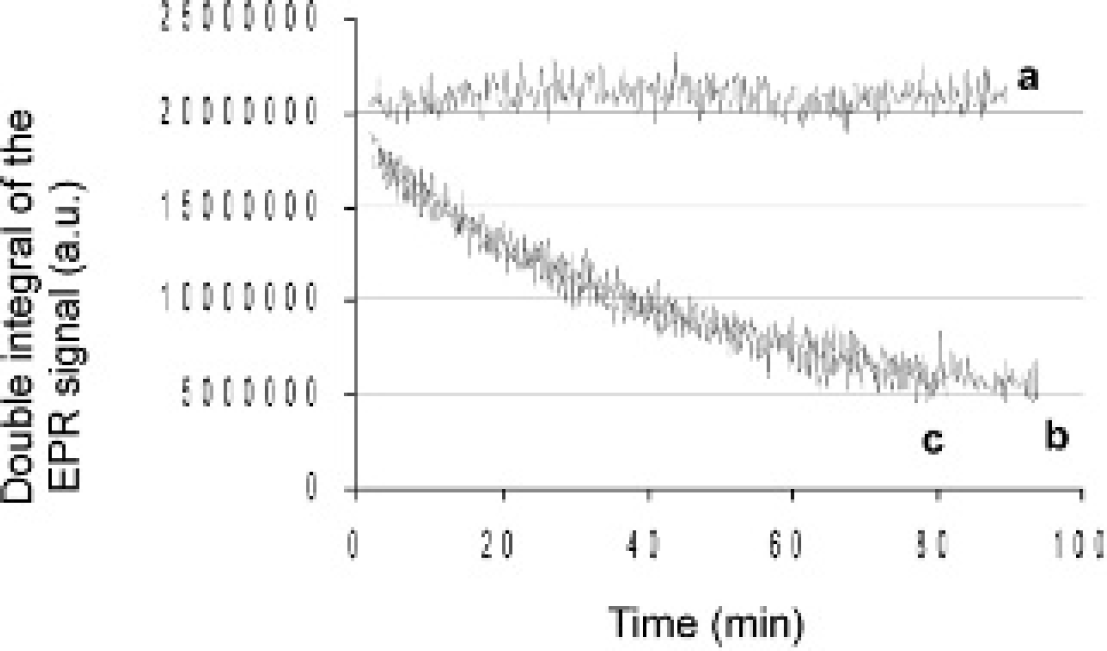
Kinetics of the double integral of the EPR signal of tempone, (a) alone and (b and c) in the presence of ascorbic acid and glutathione (b) data from the EPR spectra recorded as a function of time; (c) curve extracted from EPR imaging data (not shown after 80 minutes to ease the visualization).
The initial EPR image of the cuvette containing nitroxide, glutathione, and ascorbic acid was reconstructed by using the EPR imaging data recorded during the nitroxide disappearance (Figure 4C). To obtain this image, we extracted the kinetics from the double integration of the imaging raw data (spectrum recorded as a function of the gradient angle) using Xepr, fitted the kinetics with a monoexponential decay, and finally normalized it. Then the raw imaging data were divided by this normalized exponential to compensate for the disappearance of the radical during data acquisition. For this processing to be correct, one has to make the assumption that the disappearance of the probe is homogeneous, which is very likely because, in an aqueous medium, the repartition of the radical depends only on its diffusion. This processing of the experimental image (see Figure 4B) led to a 10% pixel difference (see Figure 4C) from the initial image (see Figure 4A). The difference image of the corrected (see Figure 4C) and initial (see Figure 4A) images that corresponds to the situation of the object at t = 0, before any disappearance of the radical, is displayed in Figure 4E.
This series of in vitro experiments was a proof of concept on a simple object. A kinetic compensation approach was also used for in vivo EPR imaging experiments.
Disappearance Kinetics of the TAM Radical in Mouse Knee Joint and Reconstruction of the Initial EPR Image
As indicated above, 1 μL of a saline solution of 0.5 M TAM was injected into the knee joint of a mouse; this experiment was repeated 10 times on 10 different mice. For each mouse knee, an initial EPR spectrum, EPR imaging data, and a final EPR spectrum were sequentially recorded. For six of these mice, we independently recorded the temporal EPR spectra of the other knee joint after injection of the same TAM solution. TAM radical kinetics was deduced from the temporal EPR spectra of the mouse knee after fitting of the signal using the Xepr built-in fitting procedure (see Figure 6B). Using the double integration technique described in the previous section, the kinetics of TAM disappearance could also be estimated from processing the imaging data (see Figure 6A). The obtained kinetic curve was very noisy and could not be accurately fitted by a monoexponential decrease. To improve the kinetic estimation, a mathematical procedure, based on a Wiener deconvolution of the imaging data and an integration of the deconvolved data (see Supplementary Methods online), was defined. This procedure drastically increased the accuracy of the kinetic information (see Figure 6D) and allowed a monoexponential fitting of the kinetics (see Figure 6C) in much better agreement with the kinetic data obtained by temporal EPR spectroscopy (see Figure 6B). Contrary to the Xepr procedure, our mathematical procedure does not require any manual and subjective intervention. The information extracted from EPR spectroscopy and the imaging data processing were very similar in the six mice studied (α = 0.041 ± 0.007 min−1 and 0.04 ± 0.01 min−1, respectively, which gives a half-life time of the radical probe t1/2 = 18 ± 4 minutes and 17 ± 2 minutes, respectively).
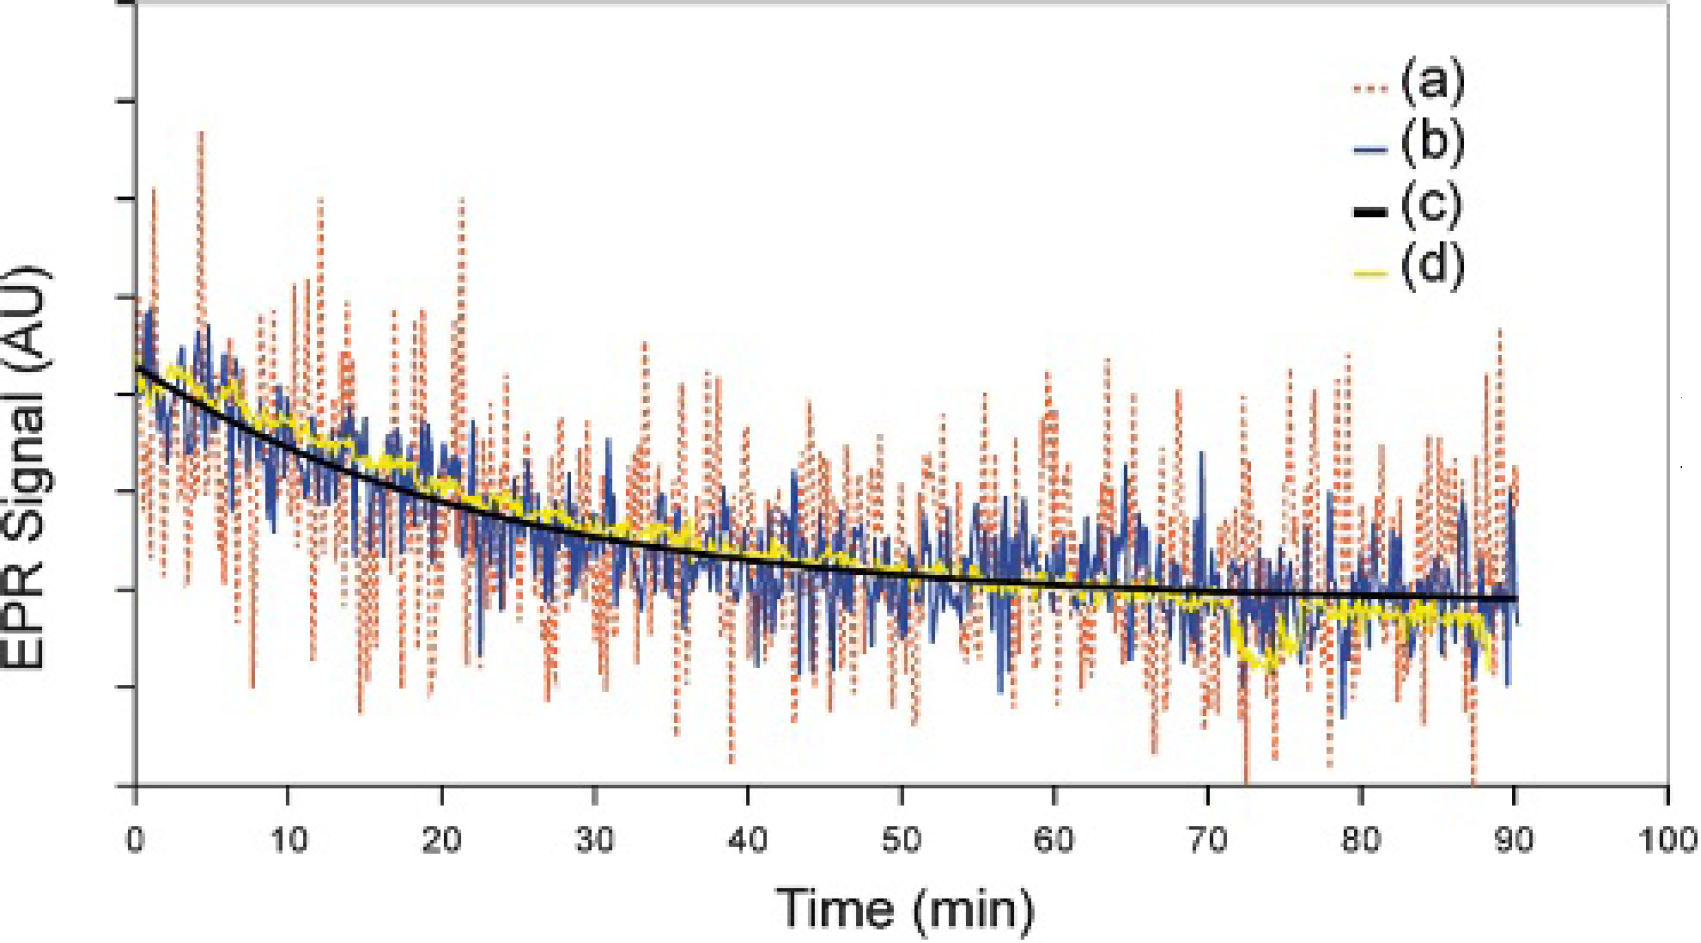
Kinetics of the disappearance of TAM in the mouse knee joint obtained either by (a) following the in vivo EPR spectrum of mouse knee joint or by analysis of the EPR image data of the other knee joint of the same mouse (b) without or (c) with mathematical treatment. d = noise reduction and experimental fitting optimization.
The data obtained from EPR imaging were then processed in a manner similar to the one described in the previous section and provided the reconstructed image (see Figure 3D) and the reconstructed image registered to the micro-CT image (see Figure 3E). Figure 3 compares this reconstructed image (see Figure 3E) to the experimental, uncompensated image registered to the micro-CT image of the mouse knee (see Figure 3C). A video of the 3D fusion after reconstruction of the image can be downloaded (see Supplementary Video 2 online).
Discussion
On the way to high-resolution molecular EPR imaging of the mouse knee joint after intra-articular injection of the TAM EPR probe, we chose to combine and spatially adjust EPR images to micro-CT images. Figure 3 shows the first example of EPR and micro-CT co-imaging, at a resolution level (around 160 μm) that has never been obtained in molecular in vivo EPR imaging before. To fit the EPR and micro-CT images as well as possible, glass capillaries filled with the radical probe at a concentration similar to the one inside the joint cavity were used as a spatial reference. Experimental EPR images (see Figure 3, A and C) showed that the TAM probe was efficiently spread in the mouse knee joint cavity, between the tibia and the femur and within the joint, below the patella. However, considering the known anatomy of this joint, 27 an unexpected asymmetry was observed in the frontal view. Actually, parallel in vivo EPR spectroscopy experiments showed that the TAM probe partially disappeared during the time of EPR imaging data acquisition (about 90 minutes) (see Figure 2). It is likely that this loss of the molecular probe during EPR imaging led to an image distortion that could be at the origin of the peculiar form of the joint cavity observed by EPR imaging.
To find a solution to the problem of disappearance of the EPR probe during EPR imaging, we used a model system based on cuvettes containing a nitroxide radical that disappears during EPR imaging owing to its reduction by ascorbic acid and glutathione. The corresponding data showed that extracting the kinetic information by double integration from the imaging data gave the same results as a temporal EPR spectroscopic approach (see Figure 5). By comparing the images of the cuvettes containing the nitroxide with or without reductants, it was clear that the disappearance of the probe led to an image distortion and a decrease in the signal to noise ratio (see Figure 4, A and B). To reconstruct the initial image (t = 0), we used the monoexponential fit of the decay of the nitroxide obtained by processing the raw imaging data. Then the division of the raw data by the normalized exponential allowed us to reconstruct a less distorted image with a better signal to noise ratio (see Figure 4C), similar to the one obtained with tempone alone (see Figure 4A).
By applying this methodology to EPR imaging of TAM injected in the mouse knee joint, it was possible to obtain in vivo EPR imaging of the mouse knee joint taking into account the local metabolism and disappearance of the EPR molecular probe during the time of the imaging experiment. To improve the poor signal to noise ratio obtained during the experiment, we developed a mathematical procedure to extract the kinetic information based on deconvolution of the raw data after noise reduction. The obtained kinetic characteristics of the TAM disappearance were very similar in the 10 mice used in this study (α = 0.04 ± 0.01 min−1) (see Figure 6). After correcting the raw imaging data using the kinetic information, an undistorted molecular initial image of the knee joint could be reconstructed (see Figure 3D). The shape of the joint cavity then accurately matched the expected anatomy, as can be seen in an EPR-micro-CT fusion image (see Figure 3E). In that regard, it is noteworthy that the symmetry below the patella was restored in the reconstructed image (see Figure 3, D and E).
Conclusion
The above-described results led to the first combined in vivo EPR and micro-CT images of a small anatomic area, the mouse knee joint, with a good resolution (≈ 160 μm). The EPR image was obtained after intra-articular injection of the TAM radical and after reconstruction of the original image (at t = 0) by taking into account the disappearance of the probe during data acquisition. The above-described protocol allowed us to overcome the two main problems of in vivo EPR imaging, namely the disappearance of the EPR probe and the difficult anatomic location of the EPR image in the whole body of the studied animals. In vivo EPR spectroscopy and in vivo EPR imaging appear to be promising noninvasive methods for determination of the local pharmacokinetics of radical or paramagnetic species. This method will be applied in physiologic and pathologic studies of the mouse knee joint. In particular, we will use it to measure the intra-articular oxidative stress that is involved in various pathologic situations, such as osteoarthritis or rheumatoid arthritis.
More generally, integrating the kinetic data of the probe disappearance in the image processing opens the way to more reliable images and better resolution for different imaging methods (eg, micro-CT, EPR), for which the time scale of image acquisition is long compared to the variation of the local probe concentration.
Footnotes
Acknowledgments
We thank J.-L. Boucher for fruitful scientific discussions.
Financial disclosure of authors: We gratefully acknowledge the French National Ministry of Research (PPF IRPE), French National Research Agency (ANR IRPE BLAN-06-0351), Fondation pour la Recherche Médicale (FRM DGE2006100 7745), CNRS (Department of Chemistry and Life Sciences), and INSERM (Institut National de la Santé et de la Recherche Médicale) for special funding.
Financial disclosure of reviewers: None reported.